Transition from coal to renewable energy on the

Transition from coal to renewable energy on the SWIS by 2021 Presentation to Unions December 21 th 2016 Angus King Ben Rose

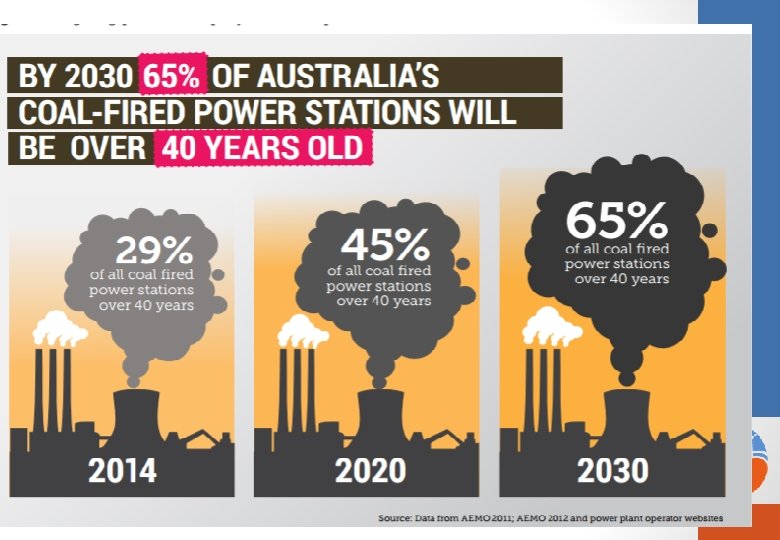
WA electricity generation now = 1960’s Holden

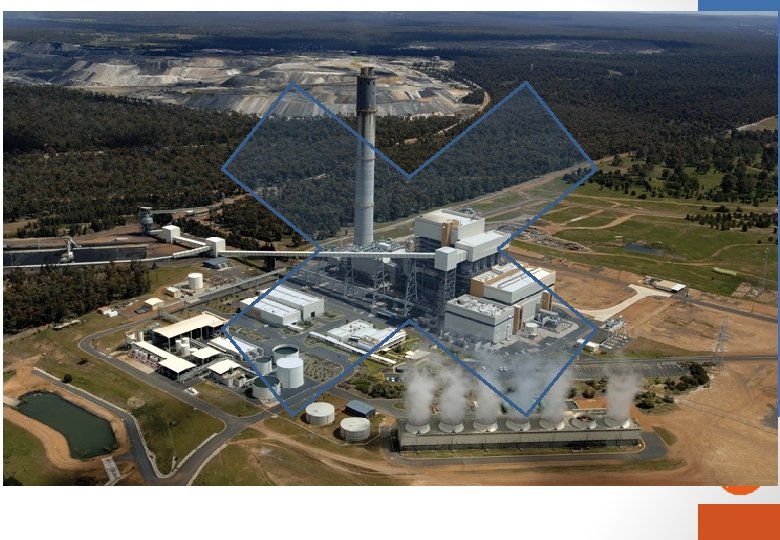
WA’s aging coal power stations on the SWIS are due for replacement (note: Bluewaters could be closed in 2030 aged 21 years)

Key Messages 1. Transition to wind and solar PV is happening and accelerating. Coal will be displaced by PV and flexible gas. 2. There are more jobs in wind, PV and biomass than in coal. 3. Most of these jobs could be in the Collie region……. .

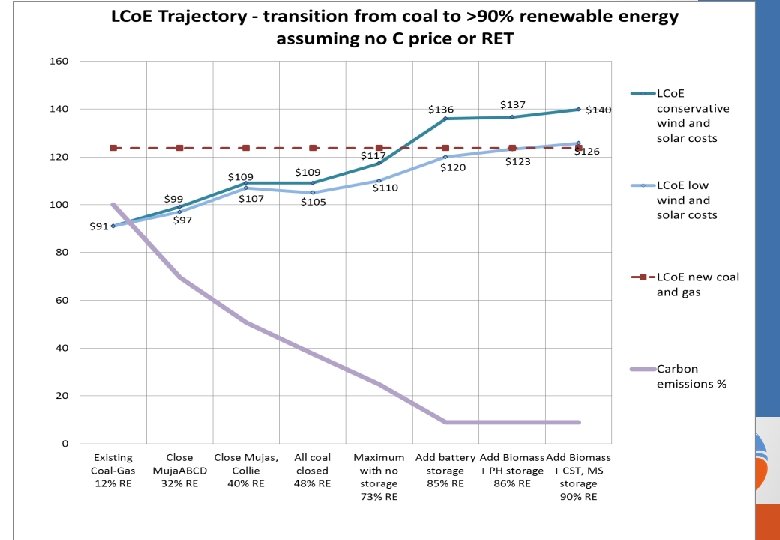
Other messages 1. The older SWIS coal generators are overdue for retirement. 2. PV and wind generation costs less than new coal 3. Retiring all coal and replacing it with wind and solar PV generation will reduce the carbon emissions from electricity by 63%. 4. Muja ABCD and Collie power stations can be retired by 2021, reducing SWIS electricity emissions by 50% 5. When the current 20% RET is taken into account, retiring of all old coal would increase LCOE by about 1. 4 c per k. Wh or 14%. This equates to 5% increase in retail tariff (less than $100 per year). 6. 91% reduction in emissions is feasible by 2030 by adding storage and some more bio-fuelled OCGT capacity (future industry for Collie) 10

WA clean renewable electricity by 2021 = New Tesla EV – for the same price as a new Holden

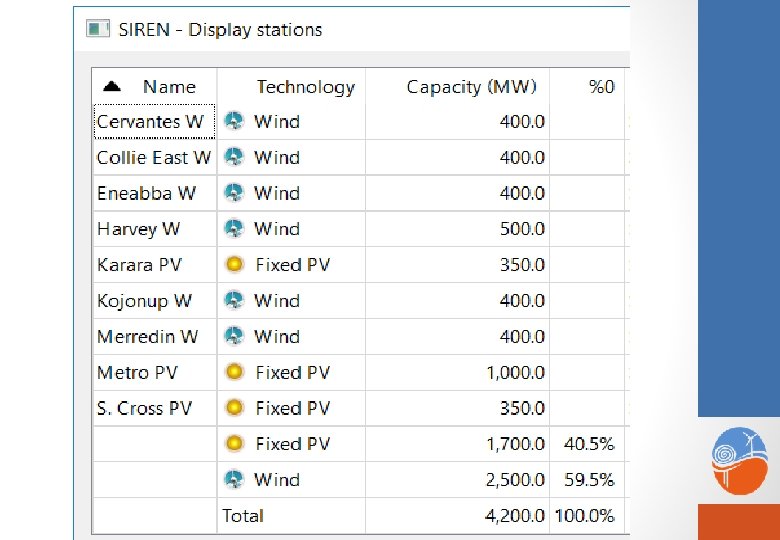
WHAT COULD THE TRANSITION TO CLEAN ENERGY LOOK LIKE? • For WA: 2300 MW of new wind and 900 MW of new solar PV (increasing total RE to 4200 MW) • For Collie Region: 1000 – 1400 MW of Wind to the east and west (up to 7 Collgar windfarms) and up to 200 MW of utility scale PV. • Enormous economic benefits for the WA economy: • Several thousand new jobs in construction and manufacturing; several hundred net new permanent jobs • $ 7. 1 billion of private investment in wind and PV plus $1 billion in new transmission lines. • Muja ABCD and Collie power stations retired, reducing SWIS CO 2 emission by 50% or 6. 2 million tonnes / year

Higher agricultural land east of Collie and Kojonup and coastal plain west of Harvey; 1400 MW of wind would easily fit in these 3 areas

An energy jobs revolution Ø 1300 new permanent jobs (600 more than currently in coal) Ø 6, 500 construction and manufacturing jobs for 5 years Cleaner energy • CO 2 emissions reduced by 50%, 6. 2 million tonnes per year 3 tonnes per head of people in WA (each person taking a car off the road)

Jobs in WA created by new wind and solar generation replacing Muja ABCD and Collie power stations

How to make a just transition for Collie ? Short term 5 year Package for coal workers – options for redundancy, retraining in wind installation, mine rehabilitation, tourism. Installation hub – construction base at Collie for > 1000 MW of wind. Fabrication industries – wind turbine towers and blades, solar panel mountings - at Kemerton, Collie or Bunbury. Potential in the longer term (10 years) Biomass power generation at Collie Biomass pellet export industry at Collie New rail Collie to Wagin / Katanning transporting biomass from the 600 mm Southern Agricultural area

18
")
Map of Wind and PV installation to replace coal (modelled in SIREN)

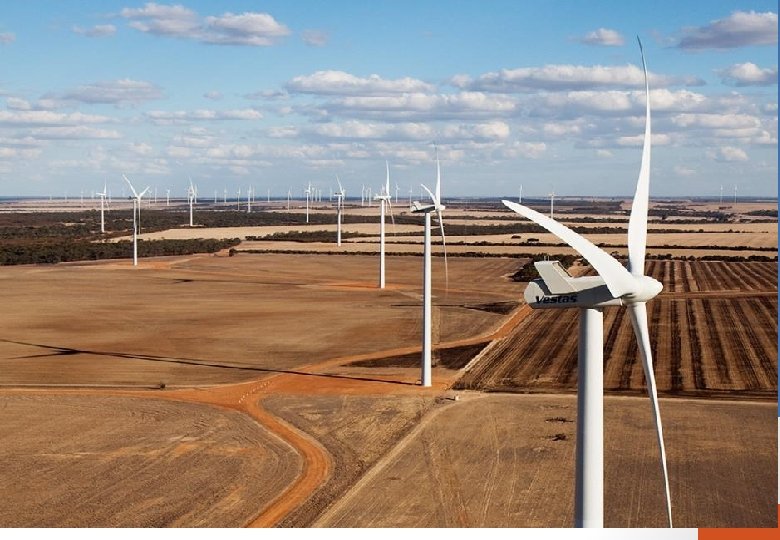
Collgar Wind Farm is a $750 million renewable energy project consisting of 111 wind turbines located approximately 25 km south east of Merredin in Western Australia, with a generation capacity of 206 Megawatts. During the construction phase, Collgar employed up to 150 people over a period of two years……. Ongoing employment for a team of 10 -20 locally based staff. http: //www. collgarwindfarm. com. au/ Landholders are paid $4, 000 to $8, 000 per turbine, $3, 000 to $4, 000 per megawatt of capacity, or 2 -4% of gross revenues. http: //www. windustry. org/how_much_do_farmers_get_paid_t o_host_wind_turbines Australian owned – by two superannuation funds

SEN’s costing assumptions. LCOE is levelized cost of electricity Conservative LCOE's Wind $85 PV, rooftop $65 PV, fixed, utility $110 CST with 6 hrs storage $165 ‘Behind meter’ Battery $40 Coal $100 Nuclear (SMR) $159 Reference Recent Power Purchase Agreement prices, BREE 2014 est. for 2025 Solar Choice, 2016 BREE 2014 est. for 2025 nominal subsidy = SRET BREE 2014 est. for 2025 $77 $40 $140 * 20 year fixed PPA for Hornsdale Stage 2 Wind Farm (Renew Economy, 23 -8 -2016) ** http: //reneweconomy. com. au/2016/12 -large-scale-solar-projects-to-get-arena-funding-and-the-winners-

23

Renewable energy grids are reliable Frequency stability response to load fluctuations for a 100% RE grid can be provided by: 1. Dispatchable synchronous generators (OCGT, CCGT, steam or diesel) provide frequency stability as for traditional fuelled grids. 2. OCGT’s running in isochronous mode can provide stability in the same way. 3. Modern battery systems - dedicated on-grid bidirectional inverter connected batteries – can provide even faster stabilizing response.

Open Cycle Gas Turbines 5 - 15% of energy • Ramp from cold start to full load in 6 – 13 minutes. • Energy cost $200 - $550 / MWh. • Can use many fuels – gas, bio-oil, bioethanol, bio-gas. • In Metro and industrial areas. • 1 in 6 equipped to run as ‘synchronous compensators’.

Wind and PV generation is predictable in advance • Forecasting wind and solar is increasingly accurate. The Australian Wind Energy Forecasting System (AWEFS) provides accurate forecasts of wind generation • Down to 5 minutes in advance, for individual wind farms and regions. • Proven in practice world-wide to allow adequate time for dispatch of stored or fuelled energy to compensate for falling RE generation.

Existing 2016 50% reduction in C emissions achievable by 2021 >90% reduction in C emissions achievable by 2030

Key Messages 1. Transition to wind and solar PV is happening and accelerating. Coal will be displaced by PV and flexible gas. 2. There are more jobs in wind, PV and biomass than in coal. 3. Most of these jobs could be in the Collie region……. .

Collies opportunity is now……. . Dinosaur ark slide

More slides including costing tables – SWIS transition

Effect of residential and commercial PV on California’s average daily electricity demand

People willing to pay more for Renewable Energy outnumber those who are not. (Newspoll, Oct 2016) Percentage of Amount per year $/year increase in households willing (Newspoll, Oct power bill at average to pay 2016) consumption c/k. Wh increase 28% $100 $99 1. 7 $116 2 $175 3 $233 4 11% $300 $291 5 $349 6 $407 7 4% $500 $465 8 17 2% $1000 $524 PERCENTAGE WILLING TO PAY MORE 45% PERCENTAGE NOT WILLING TO PAY MORE 44%

Annualized cost of transmission for 4300 MW of dispersed wind and PV , replacing all coal, is < $3/MWh, i. e. 0. 3 c /KWh (with interest on capital 6% /30 yrs) * A '5/8' rule is applied: Transmission line capacity need only be 5/8 th of the maximum capacity of all generation feeding into it. This is because it is assumed that power exceeding 5/8 th of maximum will be curtailed (this amounts to less than 4% of total energy generated). For example, wind or solar power stations totalling 800 MW capacity can feed into a transmission line with only 500 MW of capacity. Note: 1000 MW of PV in metro area not included as no transmission needed
 for Collie coal plant SEN’s modelling")
Synergy plan for Carbon Capture and Storage (CCS) for Collie coal plant SEN’s modelling shows: • CCS retrofit of old plants will cost about the same as the Wind – PV option. (LCOE $106/MWh compared to $109) • With current RET the LCOE of CCS retrofit option is higher than Wind-PV ($113 compared to $94) • Increased maintenance of old plants would inevitably push the LCOE higher. • • • New coal – CCS plants are not cost effective – LCOE $133/MWh or $136 with RET. Coal CCS is not yet ‘stand alone commercial’ on power stations; high technical and social risks and the energy is not renewable. Less popular politically and foregoes the higher employment opportunities of wind and PV.
 – Canada’s experience “When the coal-fired 140 megawatt (MW)")
Carbon Capture and Storage (CCS) – Canada’s experience “When the coal-fired 140 megawatt (MW) Boundary Dam power station with a CCS plant was officially opened in early October 2014 ……it was touted as the world’s first “commercial scale” CCS plant……. . ” “In the last two weeks, Sask. Power’s carefully-crafted illusion of the CCS plant as a success story has been shattered by revelations in a series of leaked internal documents. Instead of capturing 90 per cent of the carbon dioxide from the power station, the plant has captured about half that amount or less. Problems with the plant have meant that it has often been shut down. ” http: //reneweconomy. com. au/2015/the-fallout-from-saskpowers-boundary-dam -ccs-debacle-54803

Transitioning : WA needs a RENEWABLE ENERGY TRANSITION Planning Agency. 75% > 6 202 E R 14% 6 1 20 l Coa Gas , d n i W ting r a t S PV Wind PV ery att B T BM G C O Gas 0 3 20 % 0 t t 0 a 1 B V P W - T e d n i CS rag + to s s s S ma GT M + Bio OC + -oil io b + 2030 100% RE Wind-PV-Batt +PHS $85 MWh Generates at night + Bio-oil OCGT
 target > 85%")
Government policies for clean energy 1. WA State renewable electricity (RE) target > 85% by 2030 and develop a detailed transition plan. 2. Enact an Office of Renewable Energy, to plan transition to RE. 3. Phase out all existing coal and base load gas generation, replacing it with RE capacity, according to a master plan 4. Plan, locate and commence installation of large utility scale storage 5. Convert all consumers’ meters to standardised smart meters. with both user and utility interface capability 6. Design and implement tariff structures and or subsidies that incentivise the uptake of energy storage with rooftop PV on premises. 7. Plan and establish commercial-scale production of sustainable renewable fuels using cheap surplus RE and or biomass, for example: hydrogen from electro – hydrolysis; liquid bio-fuels; electro-chemical production of energy 8. Identify, incentivise and implement innovative energy use optimisation strategies e. g. shifting large industrial loads from winter to summer months 9. Energy market reform - to facilitate wider adoption of power purchase agreements (PPAs) by reverse auctions. Federal (Government through the AEMO) 10. Retain WA Government and control of Western Power to facilitate optimal transition to a renewable electricity system. 11. Commercial-scale sustainable woody biomass (oil mallee) production on farms

PV now less than AU$35/MWh In September 2016 Marubeni and Jinko Solar won a reverse auction to build a 350 MW solar plant in Abu Dhabi with a price of $US 24. 20/MWh ($A 32. 11/MWh) The Marubeni-Jinko Solar bid is now the world’s lowest, the previous low being $US 29. 10/MWh for a solar plant in Chile The other bids for the Abu Dhabi project were: $US 25. 90/MWh from Tenaga and Phelan Energy $US 29. 10/MWh from RWE/Belectric $US 30. 80/MWh from JGC, First Solar and Sojitz $US 36. 30/MWh from Kepco, Q Cells and GSE The cost of solar PV in the UAE is currently around one third of the price of gas generation Deploying solar enables the UAE to export higher volumes of natural gas Ref: http: //reneweconomy. com. au/2016/how-the-jaw-dropping-fall-insolar-prices-will-change-energy-markets-55160

LCOE of Wind generation is falling The 100 MW Hornsdale wind project…… has achieved Australia’s lowest known contract price for renewables at $77/MWh. Ref: http: //reneweconomy. com. au/2015/sa-wind-farm-delivers-cheapest-wind-energyever-procured-in-australia-68843 Ref: Wiser et all, 2016, Berkeley Lab, NREL, IEA

How did SEN model and cost scenarios for transition to Renewable Electricity? By using SIREN and POWERBALANCE • Power. Balance is a set of programmed Excel spreadsheet templates for scenario types. • A tool with which users can quantify and cost dispatchable energy generation, storage and CO 2 emissions. • Balances power with load for 8760 hours of a year. • Provides balanced, costed RE scenarios.

2 PB data 1 Siren 8760 hr 3 Powerbalance

SEN’s modeled LCOE’s for scenarios for reducing carbon emissions on the SWIS electricity grid With a RET LGC price of $55, closing all coal and replacing with wind and PV generation would not increase the wholesale electricity price, while deceasing CO 2 emissions by 50% Close Muja AB; CCS BAU Close Muja ABCD retrofit existing; ABCD; Collie; coal; C=100% C=69% C=50. 3% C=38. 3% Zero C price and zero RET $30 C price $55 LGC price, 20% RET target; excess LGC's sold RET as above; Recent PPA's for wind, PV in Australia No coal, no Close Muja storage, AB; New incr. Wind, PV; coal retrofit Eq to CCS; C=38. 3%; C=37. 2% Wind, PV max. economic without storage C=24. 4% $91 $99 $106 $132 $109 $117 $109 $112 $119 $113 $140 $116 $122 $98 $96 $100 $113 $140 $98 $94 $97 $113 $140 $94 $84 Note: $100 / MWh = 10 c /k. Wh

STORAGE Economic to store 5 – 15% of the cheap renewable energy for use at night ‘Behind the Meter’ Batteries Concentrating Solar Thermal with Molten Salt Storage Pumped Ocean Hydro

What might a modern renewable electricity generation system for WA look like? One scenario achievable by 2030: Percent renewable energy Energy source 91. 0% - 100% CO 2 e million tonnes; 1. 32 CO 2 % of BAU 9. 88%* % of total annual LCOE $/MWh grid energy (BREE AETA demand 2025) LCOE $/MWh (likely 2020) MW power capacity MWh storage capacity Wind 59. 3% $85 $77 5800 n/a PV 17. 6% $80 $75 2400 n/a (Surplus Wind and PV) CST 17. 1% 5. 4% $165 $140 BM Battery 1. 4% $40 PHS 0. 0% Biomass / MS (at Collie) OCGT $40 500 n/a 7000 2000 $0 $0 0 0 7. 4% $249 400 6400 9. 0% $219 2200 n/a Weighted average LCo. E ($/MWh) $137 with zero C price, zero RET $128 Plus transmission $6 -7/ MWh *Assuming OCGT’s are still fuelled by natural gas. If the OCGT’s used renewable fuels, C emission reduction could be <5%

7 Key Messages 1. The older SWIS coal generators are overdue for retirement. 2. Retiring all coal and replacing it with wind and solar PV generation will reduce the carbon emissions from electricity by 63%. 3. The increase in wholesale cost of electricity will be about 2 c per k. Wh or 20% (8% of retail tariff). 4. This is a lot less than cost increase if the old coal power stations were replaced with new ones. 5. Muja ABCD and Collie power stations can be retired by 2021, reducing SWIS electricity emissions by 50% 6. Assuming the RET scheme stays in place and the target increases to 60%, 1. and 2. above will cost no more than keeping the old coal running. 7. 91% reduction in emissions is feasible by 2030 by adding storage and some more bio-fuelled OCGT capacity

48

Deep, prolonged shortfalls in RE generation. • To provide enough energy for all shortfall periods during winter, storage would have to be increased 100 -fold, increasing LCOE to >$500/ MWh. • OCGT’s are the most cost effective generation capacity to cover periods of low wind and sun. 49
 Biomass")
Possible future biomass industries for Collie Possible in the longer term (10 years) Biomass power generation Wood pellet export industry; Oil mallee biomass production on farms in the 400 - 600 mm southern agricultural region Rail connecting Collie / Bunbury port to Wagin / Katanning for transportation of biomass and other agricultural products

Biomass thermal power generation with Molten Salt storage. Up to 400 MW could be located at Collie (using plantation and waste biomass only) 50 MW Mc. Neil Biomass Power station Vermont, US Molten salt tank at 110 MW Concentrating Solar Thermal power station in Nevada
 Biomass from Oil Mallee “Alleys” on")
WA Biomass resources (Mt = million dry tonnes) Biomass from Oil Mallee “Alleys” on 10 % of dryland farms 3. 6 Mt 10% of the Gt Southern Region alone would produce enough (1. 2 Mt) to generate 10% of projected 2029 electricity demand. Note: need to legislate no biomass harvest from state forests Wood waste - pine and blue gum plantations, and municipal combustible waste – >1 Mt Cereal straw – up to 1 Mt (wheat belt )

Oil mallee - a coppicing crop for biomass energy: electricity generation and wood pellets for export 120 -140 km of new rail Collie to Wagin or Katanning. Cost $360 – 400 million. To transport 1. 2 million tonnes* of woodchips for a 400 MW power station plus 0. 2 million tonnes for wood pellet exports. (*seven 5, 000 tonne trains per day) Harvester cuts coppiced trees at ground level, chops biomass to size, and chutes it into a mobile hopper, which conveys it to road trucks. (Photo: courtesy John Bartle)

Coal phase-out to 100% renewable energy for the SWIS: Percentage of total electricity generation by Technology Overbuild Close Overbuild Wind, PV; Muja Overbuild Wind, PV; biomass CST and biomass ABCD Close Muja No coal Wind, PV behind & MS power ABCD and power, no Max. the meter storage; with stations Collie storage, economic battery pumped molten BAU power increase without storage, hydro salt existing (C=71. 6 stations (C Wind, PV storage (C=16. 9% storage, (C=100% ) %) = 56. 4%) (C=38. 7%) (C=23. 9%) ) (C=9%) Technology Coal CCGT OCGT PV Wind Biomass/ MS CST/MS PHS BM Battery total Percentage of total electricity generation 41. 8% 26. 3% 40. 1% 36. 4% 5. 9% 4. 9% 5. 6% 10. 6% 6. 8% 21. 8% 0. 0% 0. 0% 100. 2% 100. 0% 15. 3% 39. 4% 5. 5% 15. 2% 24. 7% 0. 0% 100. 0% 34. 9% 17. 1% 17. 2% 30. 8% 0. 0% 100. 0% 27. 3% 21. 1% 51. 6% 0. 0% 100. 0% 11. 4% 22. 5% 62. 3% 0. 0% 3. 7% 100. 0% 9. 0% 20. 2% 58. 3% 7. 5% 0. 0% 3. 3% 1. 7% 100. 0% 9. 0% 17. 6% 59. 3% 7. 4% 5. 4% 0. 0% 1. 4% 100. 0%

Power capacity for SWIS transition scenarios Technology CCGT Coal OCGT Rooftop PV Fixed PV Wind CST with MS storage Biomass with MS storage TOTAL PHS BM Battery Wind, PV; Close Storage Muja MWh: Close Muja No coal Wind, PV; ABCD PH+BMB CST - MS power ABCD and power, no Maximum Storage MWh: 8000, stations Collie storage, economic PHS 42, 000, Biomass with and biomass BAU power increase with no BM Battery Molten Salt with molten existing (C=71. 6% stations (C Wind, PV storage 8, 000 , storage, salt storage, (C=100% ) ) = 56. 4%) (C=38. 7%) (C=23. 9%) (C=16. 9%) (C=9%) Generation Power capacity MW 1, 475 1, 000 0 0 1, 778 752 435 0 0 0 1, 659 1, 486 2, 600 3, 000 0 2, 200 3, 000 500 800 1, 400 1, 200 2, 300 2, 000 0 0 10 200 500 400 1, 000 2, 800 2, 400 500 1, 700 2, 300 2, 600 4, 800 6, 000 5, 800 0 0 5, 922 0 6, 413 0 7, 596 0 0 0 0 0 7, 900 10, 500 Storage Power MW 0 0 0 500 0 9, 000 400 11, 200 400 12, 100 1, 000 1, 600 0 0 0

LCOE’s of Coal and Renewable Electricity Scenarios C= C= 50. 7% C= 9% C= 100% C= 69. 5% 24. 9% C= 9% Close C= 37. 6% RE + Existing Close RE max. RE + Mujas, All coal Biomass + Coal at Muja. ABC econ. battery Collie at closed + PH CST, MS 2021 D at 2021 No storage 2021 storage LCOE with Zero C price $91 $99 $109 $117 $136 $137 $140 and zero RET LCOE low wind and solar $91 $97 $105 $110 $123 $126 costs LCOE with $30 C price $109 $112 LCOE with RET target $98 $102 increasing LCOE with 20% RET target; $55 LGC price, $98 $96 excess LGC's sold LCOE with RET as above; current PPA's for wind, $98 $94 PV in Australia Renew all existing coal and gas, LCOE with zero C $124 $119 $116 $122 $138 $142 $112 $109 $117 $100 $98 $97 $94 $124 $124
 scenarios for the SWIS, compared with")
Summary of modelled carbon capture and storage (CCS) scenarios for the SWIS, compared with renewable energy scenario Percentage of total electricity generation Coal CCGT OCGT PV Wind Biomass/ MS CST/MS PHS BM Battery total LCOE with Zero C price and zero RET LCOE with $30 C price LCOE with 20% RET target; $55 LGC price, excess LGC's sold LCOE with RET as above; current PPA's for wind, PV in Australia Close Muja AB; CCS retrofit (C=40. 9%)) No coal, no storage, Close Muja AB; New coal increase Wind, PV CCS (C=40%) (C=38. 7%) 41. 9% 40. 3% 41. 9% 5. 6% 6. 8% 0. 0% 0. 0% 100. 3% 100. 2% Weighted average LCOE of scenarios 0. 0% 34. 9% 17. 1% 17. 2% 30. 8% 0. 0% 100. 0% $106 $113 $132 $140 $109 $116 $113 $140 $98 $113 $140 $94

High penetration RE scenarios – cost and emissions comparison with coal with $30 C price

WA Carbon emissions by sector: WA carbon emissions % Agriculture forestry and fishing Mining Manufacturing 6. 9% 5. 6% 15. 3% 5. 7% Electricity gas and water Commercial Services and construction Transport and storage Residential 20. 1% 27. 5% 18. 9%
- Slides: 57