Transient Conduction Spatial Effects and the Role of


 • Non-dimensionalization of Heat Equation and Initial/Boundary Conditions: The Biot")
 Approximation Analytical and graphical solution • The One-Term Approximation :")
 Approximation Analytical and graphical solution Ø Variation of midplane temperature")

")
")
")
")
")
")


- Slides: 26
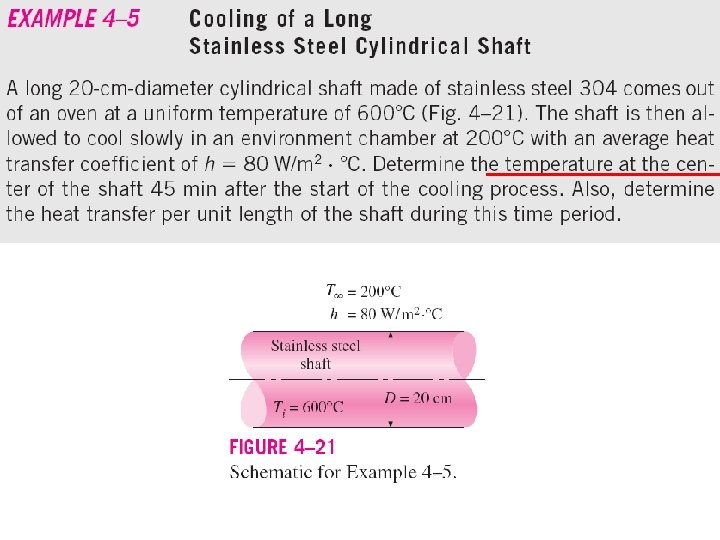
Transient Conduction: Spatial Effects and the Role of Analytical Solutions
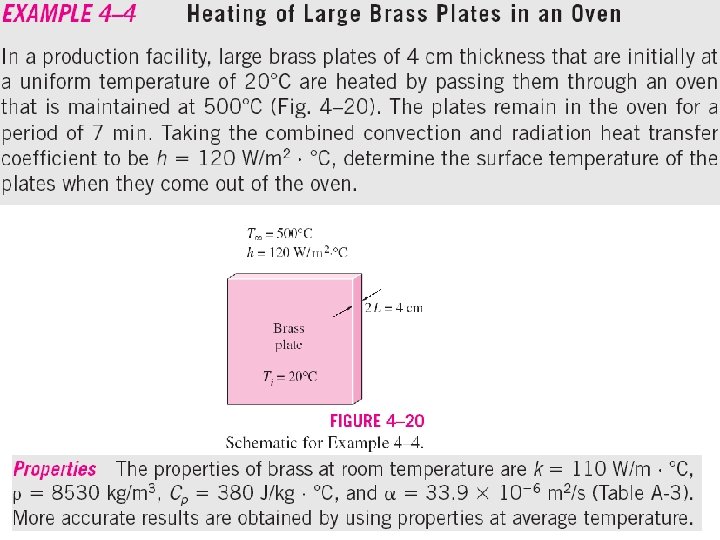
Plane Wall Solution to the Heat Equation for a Plane Wall with Symmetrical Convection Conditions • If the lumped capacitance approximation can not be made, consideration must be given to spatial, as well as temporal, variations in temperature during the transient process. • For a plane wall with symmetrical convection conditions and constant properties, the heat equation and initial/boundary conditions are: (5. 26) (5. 27) (5. 28) (5. 29) • Existence of seven independent variables: (5. 30) How may the functional dependence be simplified?
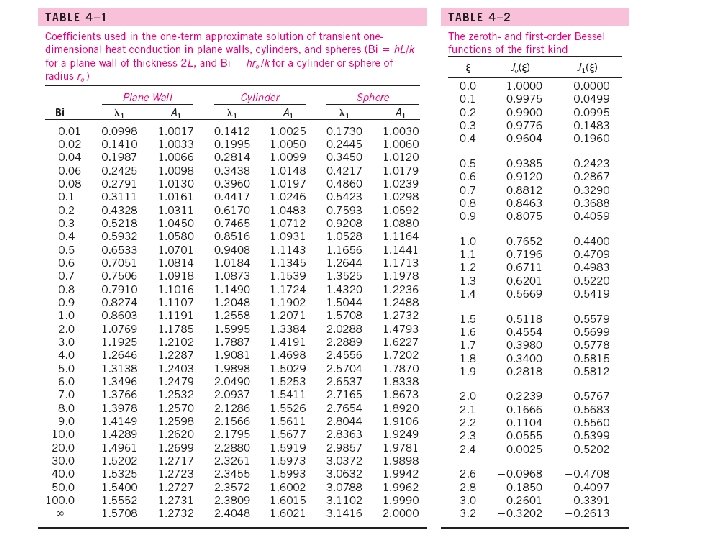
Plane Wall (cont. ) • Non-dimensionalization of Heat Equation and Initial/Boundary Conditions: The Biot Number: • Exact Solution: (5. 39 a) (5. 39 b, c) See Appendix for first four roots (eigenvalues ) of Eq. (5. 39 c)
Plane Wall (cont. ) Approximation Analytical and graphical solution • The One-Term Approximation :
Plane Wall (cont. ) Approximation Analytical and graphical solution Ø Variation of midplane temperature (X= 0) with time :
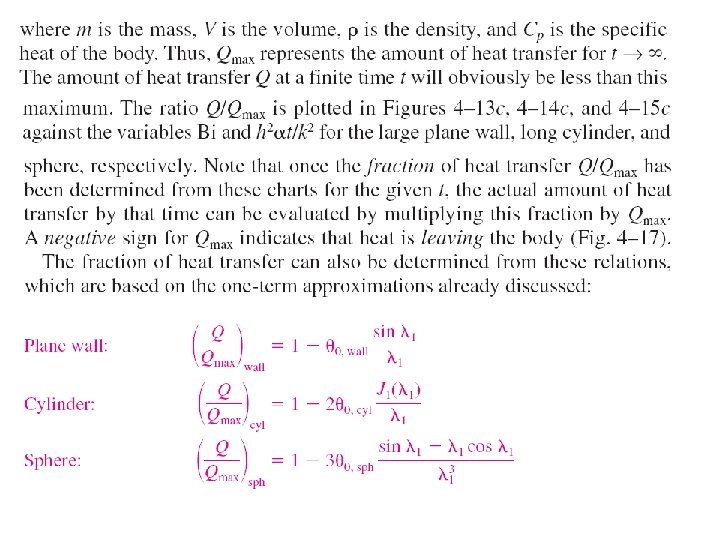
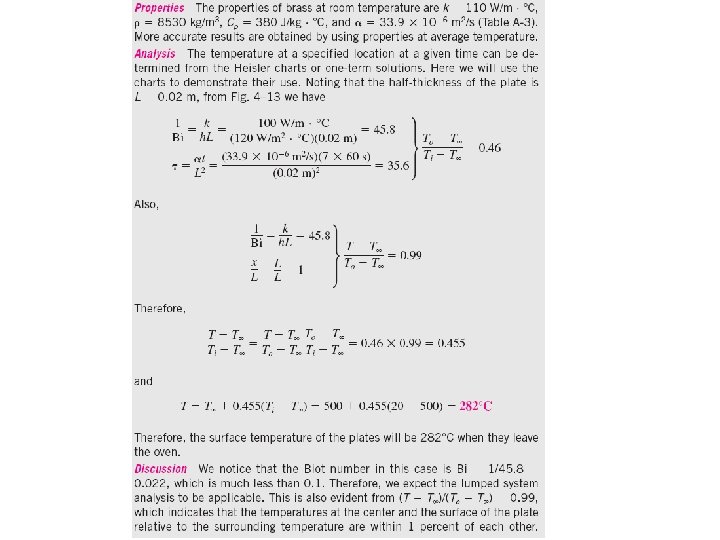
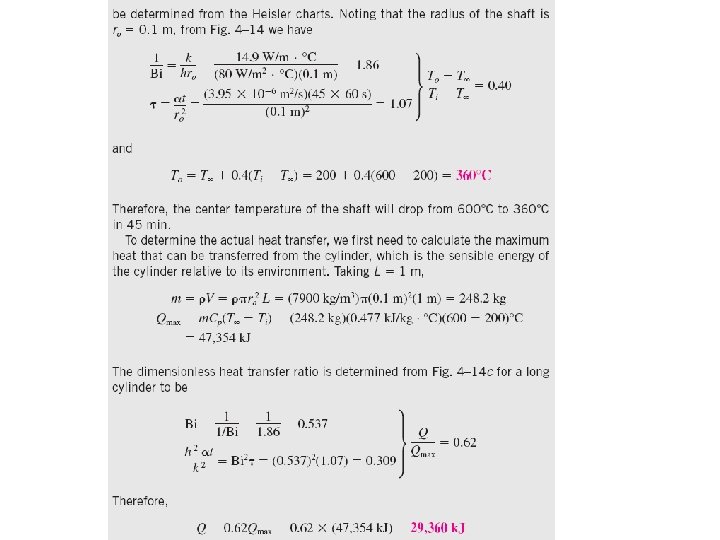
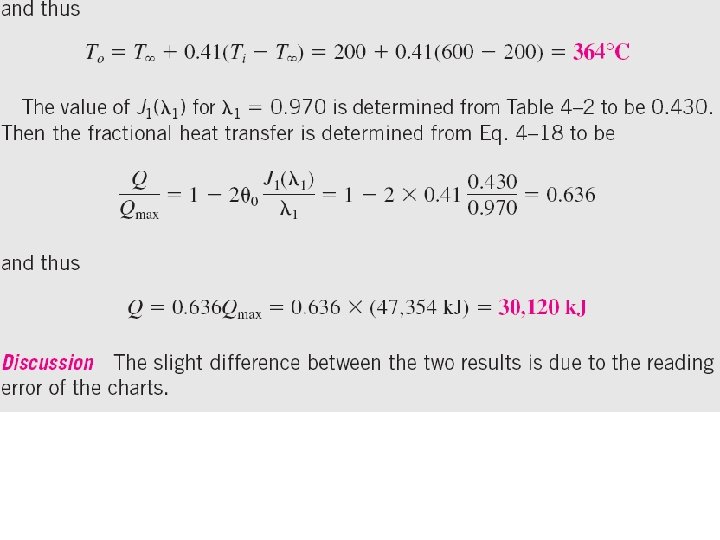
Heisler Charts Graphical Representation of the One-Term Approximation The Heisler Charts, The Maximum heat that a body can gain (Qmax)
Heisler Charts (cont. )
Heisler Charts (cont. )
Heisler Charts (cont. )
Heisler Charts (cont. )
Heisler Charts (cont. )
Heisler Charts (cont. )
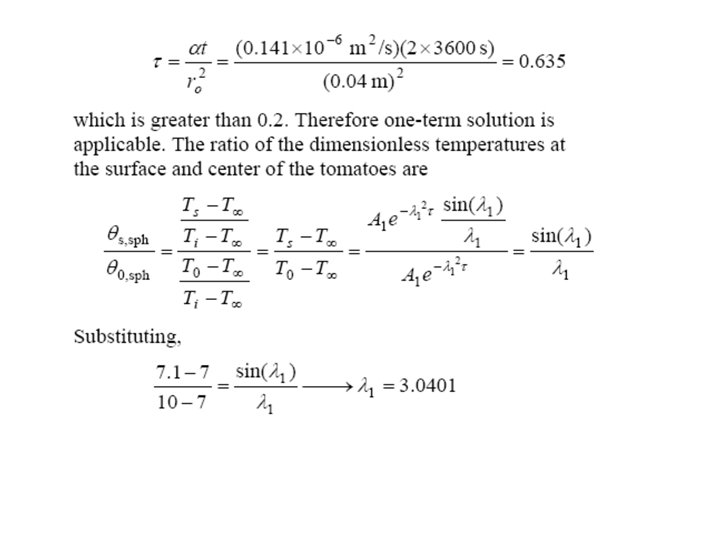
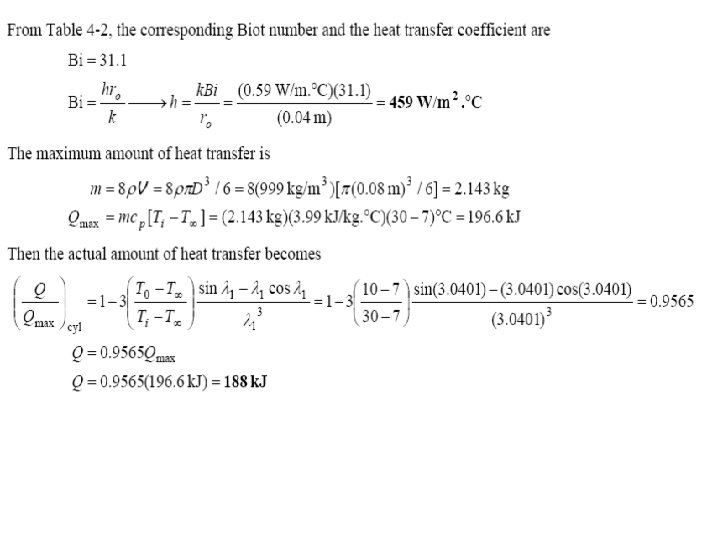
After 2 hours from starting cooling process the surface temperature recorded 7. 1 0 C and the temperature at centre found at 10 0 C r =0. 04 m 8 tomato are exposed this cooling process