
Transforming Retail Business U B Pravin Rao Infosys

Transforming Retail Business U. B. Pravin Rao © Infosys Technologies Limited 2003 -2004
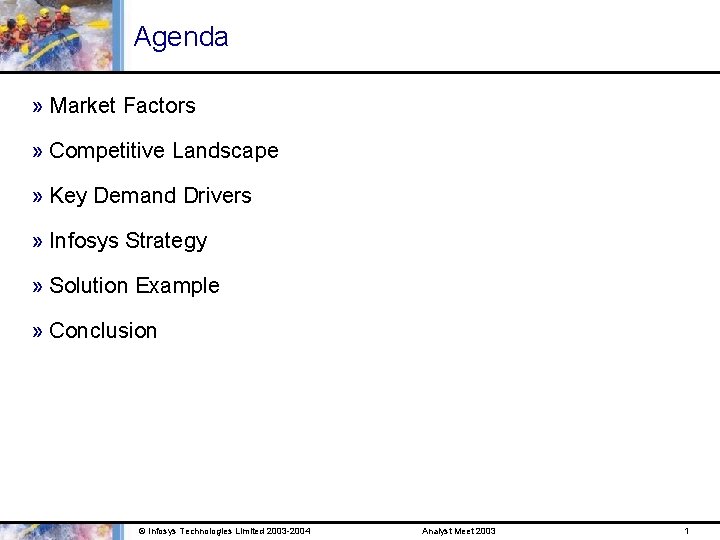
Agenda » Market Factors » Competitive Landscape » Key Demand Drivers » Infosys Strategy » Solution Example » Conclusion © Infosys Technologies Limited 2003 -2004 Analyst Meet 2003 1
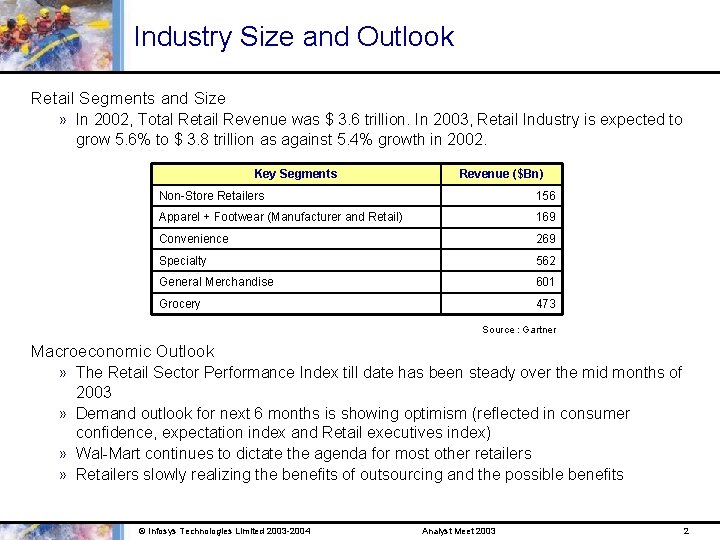
Industry Size and Outlook Retail Segments and Size » In 2002, Total Retail Revenue was $ 3. 6 trillion. In 2003, Retail Industry is expected to grow 5. 6% to $ 3. 8 trillion as against 5. 4% growth in 2002. Key Segments Revenue ($Bn) Non-Store Retailers 156 Apparel + Footwear (Manufacturer and Retail) 169 Convenience 269 Specialty 562 General Merchandise 601 Grocery 473 Source : Gartner Macroeconomic Outlook » The Retail Sector Performance Index till date has been steady over the mid months of 2003 » Demand outlook for next 6 months is showing optimism (reflected in consumer confidence, expectation index and Retail executives index) » Wal-Mart continues to dictate the agenda for most other retailers » Retailers slowly realizing the benefits of outsourcing and the possible benefits © Infosys Technologies Limited 2003 -2004 Analyst Meet 2003 2
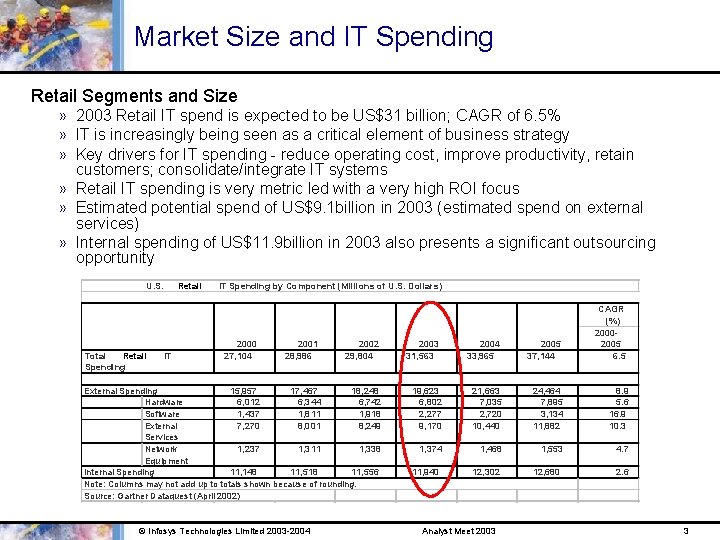
Market Size and IT Spending Retail Segments and Size » 2003 Retail IT spend is expected to be US$31 billion; CAGR of 6. 5% » IT is increasingly being seen as a critical element of business strategy » Key drivers for IT spending - reduce operating cost, improve productivity, retain customers; consolidate/integrate IT systems » Retail IT spending is very metric led with a very high ROI focus » Estimated potential spend of US$9. 1 billion in 2003 (estimated spend on external services) » Internal spending of US$11. 9 billion in 2003 also presents a significant outsourcing opportunity U. S. Retail IT Spending by Component (Millions of U. S. Dollars) 2002 29, 804 2003 31, 563 2004 33, 965 2005 37, 144 External Spending 15, 957 17, 467 18, 248 Hardware 6, 012 6, 344 6, 742 Software 1, 437 1, 811 1, 918 External 7, 270 8, 001 8, 249 Services Network 1, 237 1, 311 1, 338 Equipment Internal Spending 11, 148 11, 518 11, 556 Note: Columns may not add up to totals shown because of rounding. Source: Gartner Dataquest (April 2002) 19, 623 6, 802 2, 277 9, 170 21, 663 7, 035 2, 720 10, 440 24, 464 7, 895 3, 134 11, 882 8. 9 5. 6 16. 9 10. 3 1, 374 1, 468 1, 553 4. 7 11, 940 12, 302 12, 680 2. 6 Total Retail Spending IT 2000 27, 104 2001 28, 986 CAGR (%) 20002005 6. 5 © Infosys Technologies Limited 2003 -2004 Analyst Meet 2003 3
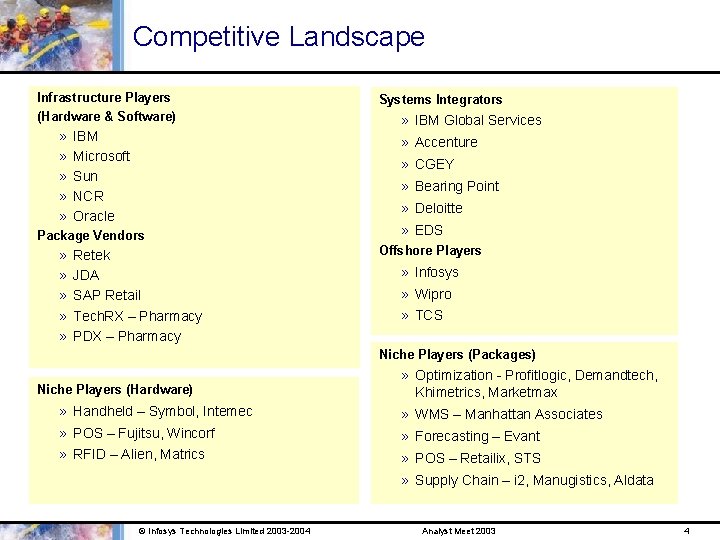
Competitive Landscape Infrastructure Players (Hardware & Software) » » » IBM Microsoft Sun NCR Oracle » IBM Global Services » Accenture » CGEY » Bearing Point » Deloitte Package Vendors » » » Systems Integrators Retek JDA SAP Retail Tech. RX – Pharmacy PDX – Pharmacy » EDS Offshore Players » Infosys » Wipro » TCS Niche Players (Packages) Niche Players (Hardware) » Optimization - Profitlogic, Demandtech, Khimetrics, Marketmax » Handheld – Symbol, Intemec » WMS – Manhattan Associates » POS – Fujitsu, Wincorf » Forecasting – Evant » RFID – Alien, Matrics » POS – Retailix, STS » Supply Chain – i 2, Manugistics, Aldata © Infosys Technologies Limited 2003 -2004 Analyst Meet 2003 4
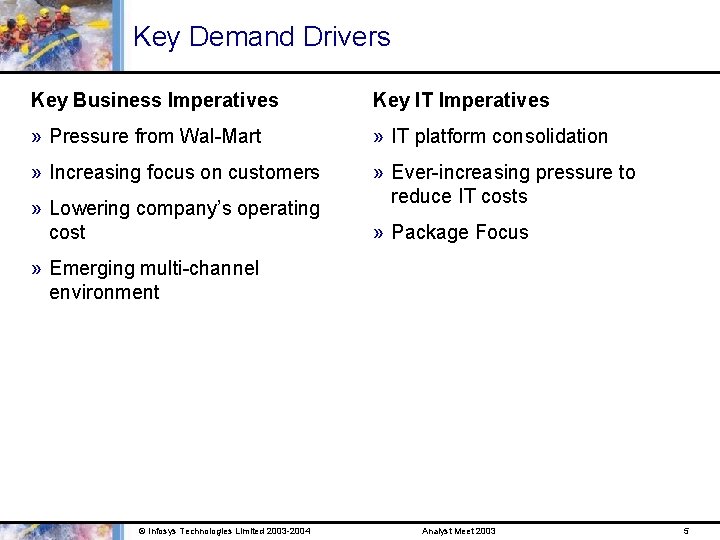
Key Demand Drivers Key Business Imperatives Key IT Imperatives » Pressure from Wal-Mart » IT platform consolidation » Increasing focus on customers » Ever-increasing pressure to reduce IT costs » Lowering company’s operating cost » Package Focus » Emerging multi-channel environment © Infosys Technologies Limited 2003 -2004 Analyst Meet 2003 5
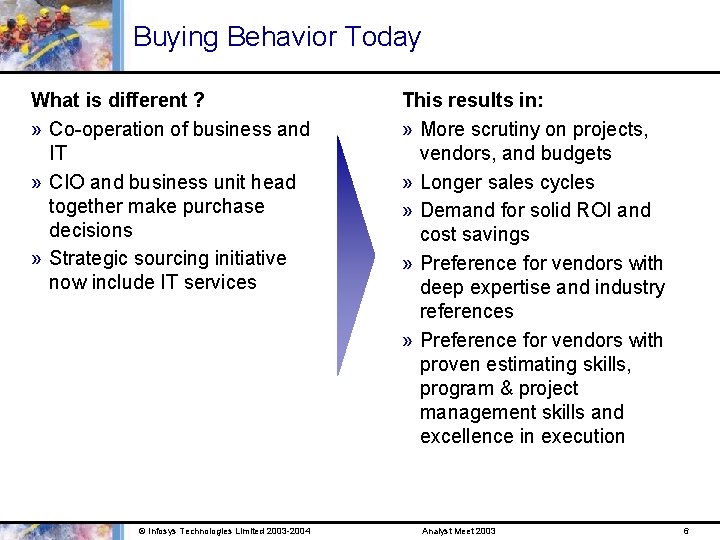
Buying Behavior Today What is different ? » Co-operation of business and IT » CIO and business unit head together make purchase decisions » Strategic sourcing initiative now include IT services © Infosys Technologies Limited 2003 -2004 This results in: » More scrutiny on projects, vendors, and budgets » Longer sales cycles » Demand for solid ROI and cost savings » Preference for vendors with deep expertise and industry references » Preference for vendors with proven estimating skills, program & project management skills and excellence in execution Analyst Meet 2003 6
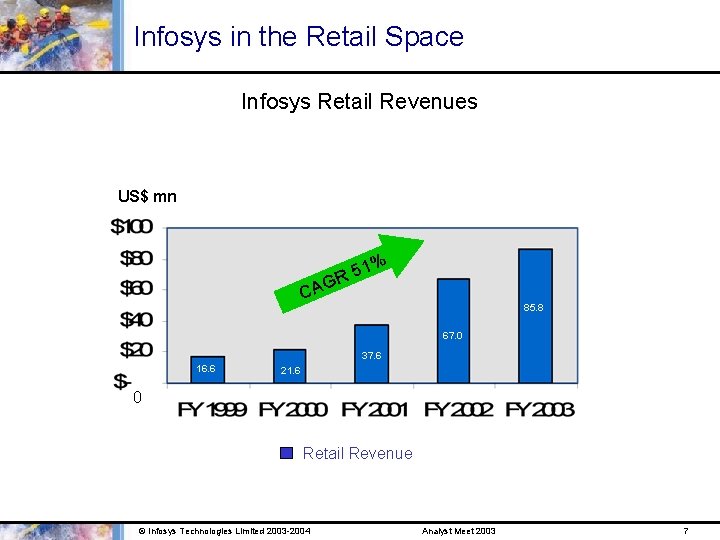
Infosys in the Retail Space Infosys Retail Revenues US$ mn 1% 5 R G CA 85. 8 67. 0 37. 6 16. 6 21. 6 0 Retail Revenue © Infosys Technologies Limited 2003 -2004 Analyst Meet 2003 7
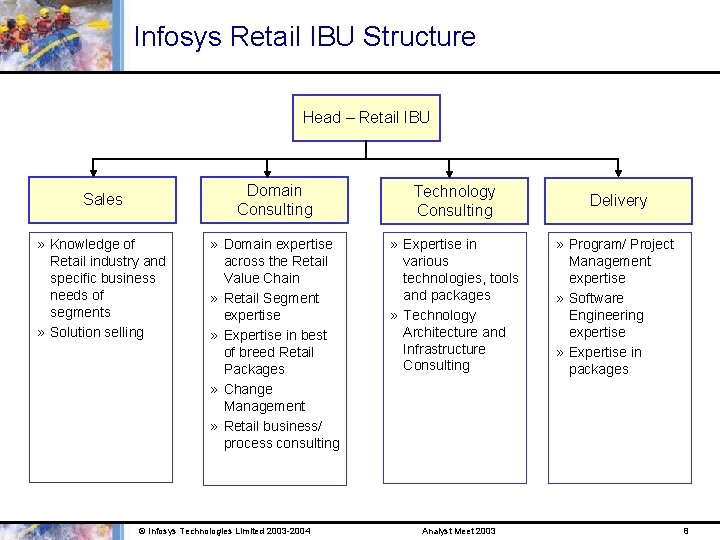
Infosys Retail IBU Structure Head – Retail IBU Sales » Knowledge of Retail industry and specific business needs of segments » Solution selling Domain Consulting Technology Consulting Delivery » Domain expertise across the Retail Value Chain » Retail Segment expertise » Expertise in best of breed Retail Packages » Change Management » Retail business/ process consulting » Expertise in various technologies, tools and packages » Technology Architecture and Infrastructure Consulting » Program/ Project Management expertise » Software Engineering expertise » Expertise in packages © Infosys Technologies Limited 2003 -2004 Analyst Meet 2003 8
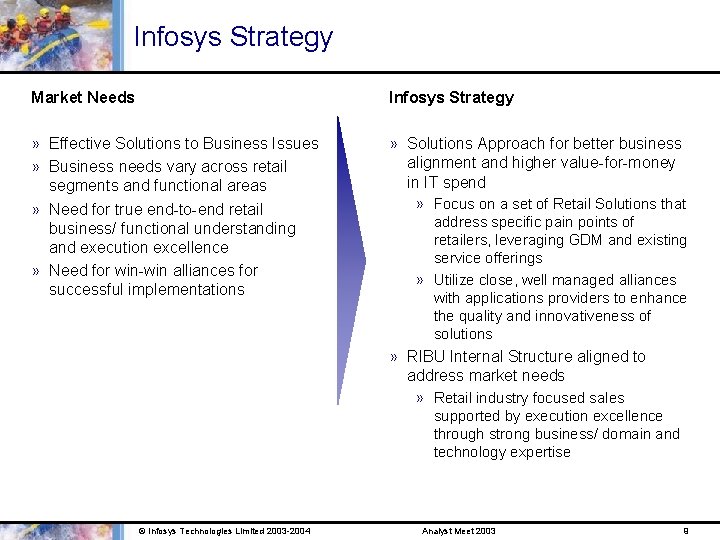
Infosys Strategy Market Needs Infosys Strategy » Effective Solutions to Business Issues » Business needs vary across retail segments and functional areas » Need for true end-to-end retail business/ functional understanding and execution excellence » Need for win-win alliances for successful implementations » Solutions Approach for better business alignment and higher value-for-money in IT spend © Infosys Technologies Limited 2003 -2004 » Focus on a set of Retail Solutions that address specific pain points of retailers, leveraging GDM and existing service offerings » Utilize close, well managed alliances with applications providers to enhance the quality and innovativeness of solutions » RIBU Internal Structure aligned to address market needs » Retail industry focused sales supported by execution excellence through strong business/ domain and technology expertise Analyst Meet 2003 9
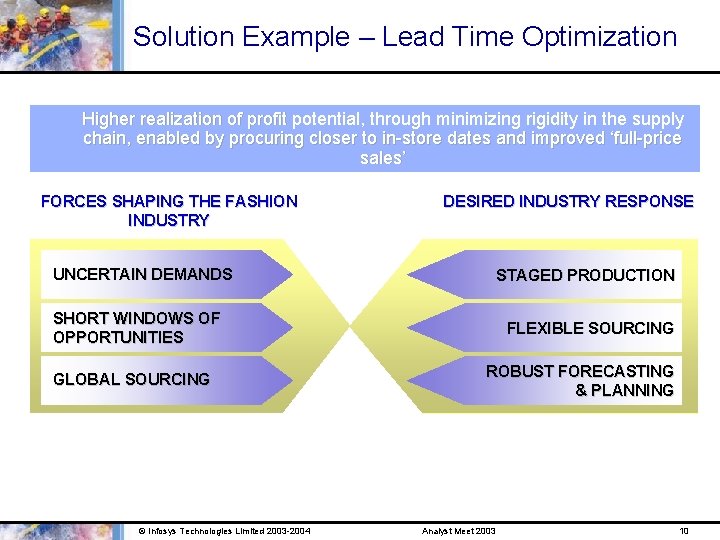
Solution Example – Lead Time Optimization Higher realization of profit potential, through minimizing rigidity in the supply chain, enabled by procuring closer to in-store dates and improved ‘full-price sales’ FORCES SHAPING THE FASHION INDUSTRY UNCERTAIN DEMANDS DESIRED INDUSTRY RESPONSE STAGED PRODUCTION SHORT WINDOWS OF OPPORTUNITIES GLOBAL SOURCING © Infosys Technologies Limited 2003 -2004 FLEXIBLE SOURCING ROBUST FORECASTING & PLANNING Analyst Meet 2003 10
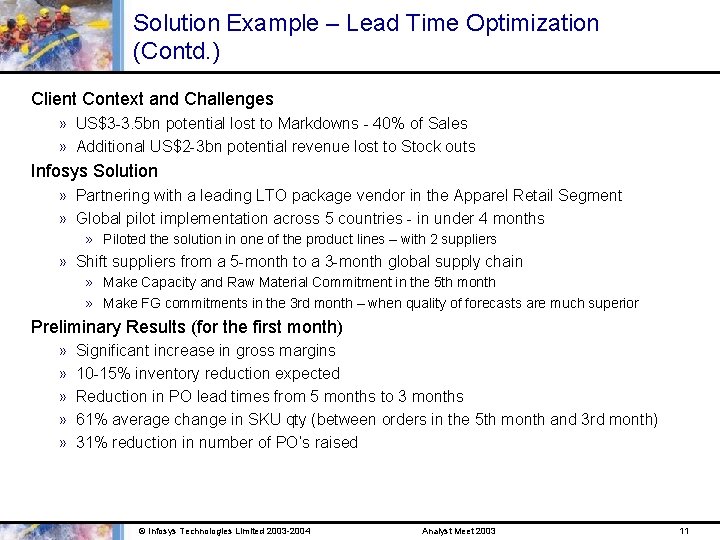
Solution Example – Lead Time Optimization (Contd. ) Client Context and Challenges » US$3 -3. 5 bn potential lost to Markdowns - 40% of Sales » Additional US$2 -3 bn potential revenue lost to Stock outs Infosys Solution » Partnering with a leading LTO package vendor in the Apparel Retail Segment » Global pilot implementation across 5 countries - in under 4 months » Piloted the solution in one of the product lines – with 2 suppliers » Shift suppliers from a 5 -month to a 3 -month global supply chain » Make Capacity and Raw Material Commitment in the 5 th month » Make FG commitments in the 3 rd month – when quality of forecasts are much superior Preliminary Results (for the first month) » » » Significant increase in gross margins 10 -15% inventory reduction expected Reduction in PO lead times from 5 months to 3 months 61% average change in SKU qty (between orders in the 5 th month and 3 rd month) 31% reduction in number of PO’s raised © Infosys Technologies Limited 2003 -2004 Analyst Meet 2003 11
Conclusion To ensure sustained and profitable growth we are: » Bringing solution focus to all that we do for our clients » Weaving together services, GDM, alliances, execution excellence and deep domain knowledge to create innovative new solutions » Enabled by a structure of Retail Industry focused Sales & Relationship Mgmt teams, Business / Domain Consultants and Technologists. © Infosys Technologies Limited 2003 -2004 Analyst Meet 2003 12

Thank You www. infosys. com © Infosys Technologies Limited 2003 -2004
- Slides: 14