Transformations of Trigonometric Functions Transformations Amplitude The amplitude


 is negative, there is")
- Slides: 16
Transformations of Trigonometric Functions
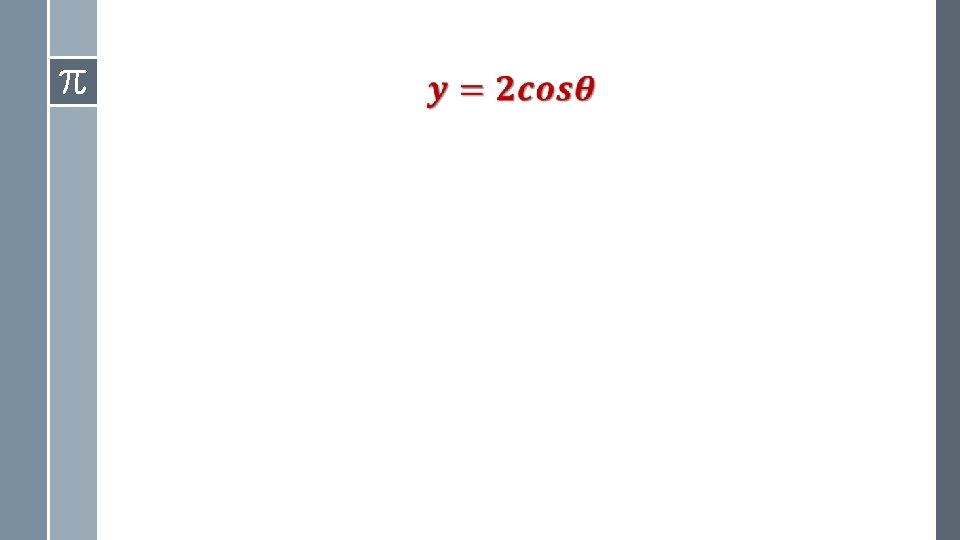
Transformations › Amplitude – The amplitude of a periodic wave function is its maximum displacement from the central line (sinusoidal axis) running through the middle of the wave.
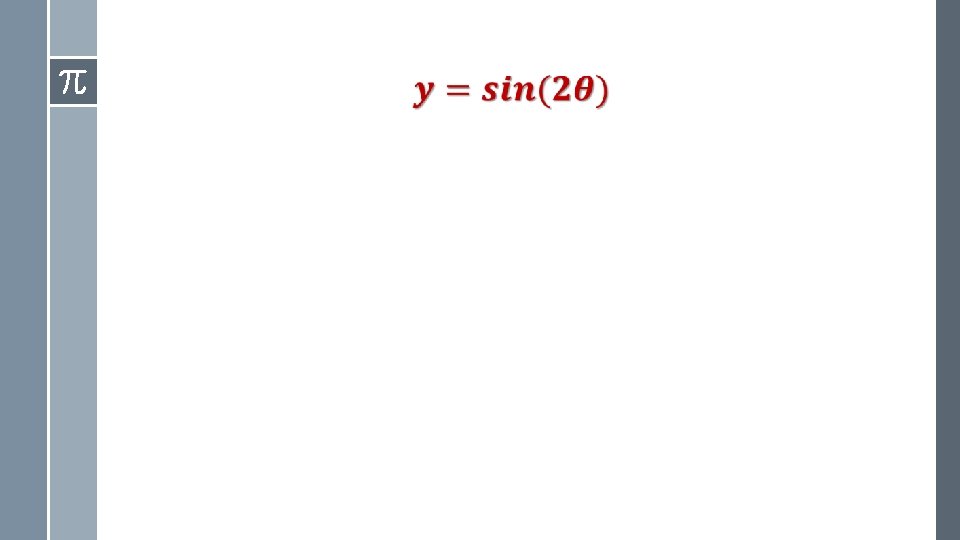
Transformations › Period – The PERIOD of a periodic function is “how long” the function takes to repeat itself. – The time it takes to go through one complete CYCLE. – For graphing, it is helpful to think of the period as the length of the primary wave. – For the basic Sine and Cosine functions, how long does it take until the values begin to repeat themselves (in order)?
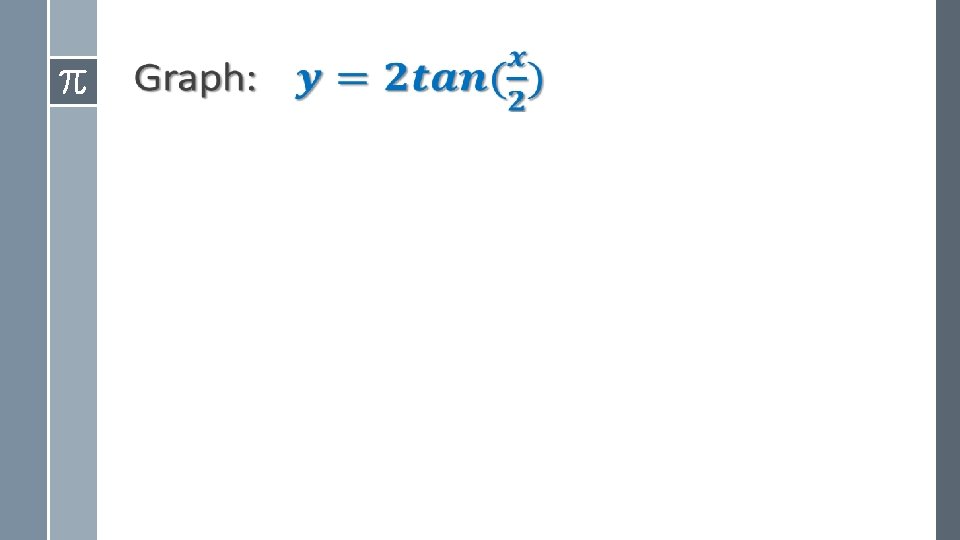
Transformations ›
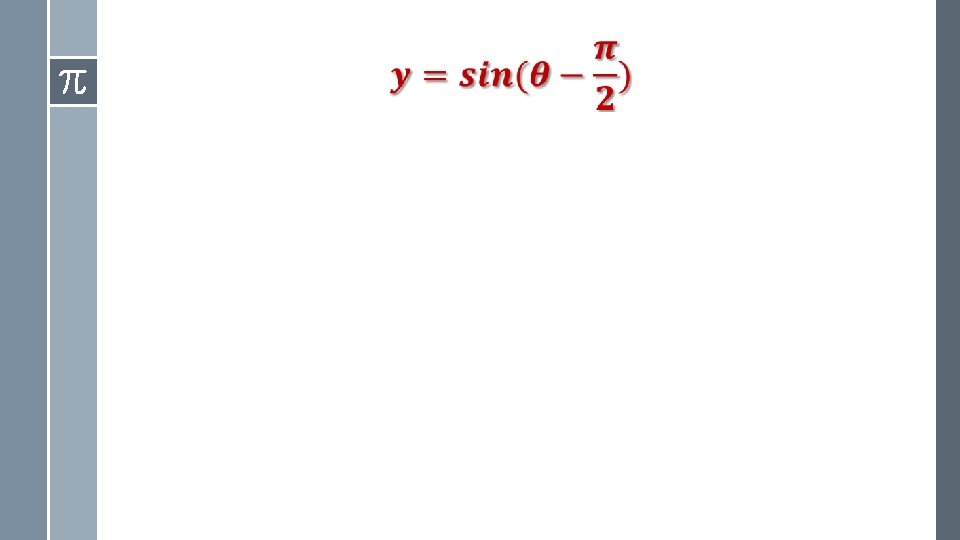
Transformations › The Phase Shift – The PHASE SHIFT of a periodic function is the horizontal (Left/Right) shift of the function. – For graphing, this tells us where the initial point has moved horizontally. – Remember that for horizontal shifts, the graph moves “the opposite direction from what you see. ”
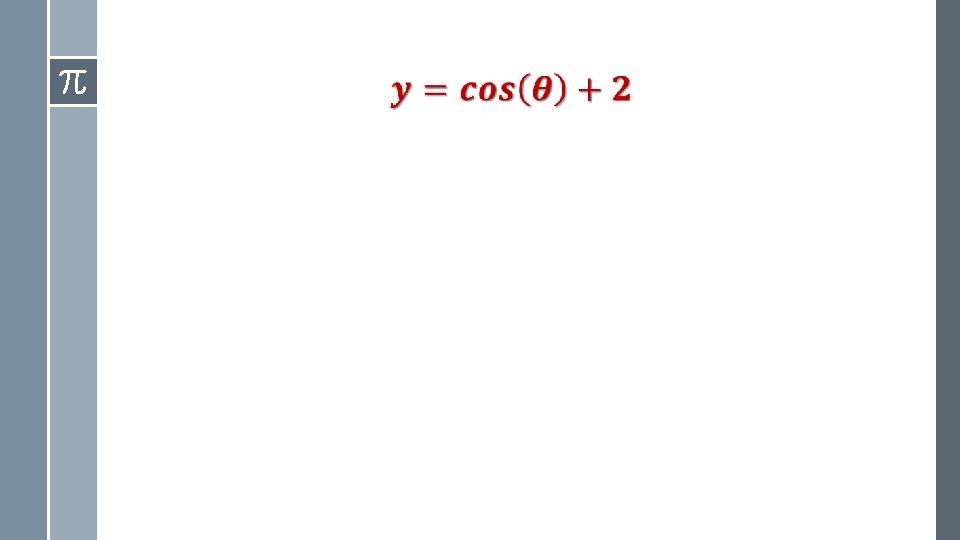
Transformations › The Vertical Shift – The VERTICAL SHIFT of a periodic function is how much the function is moved up or down. – For graphing, this tells us where the SINUSOIDAL AXIS is. – When shifting a function vertically, we “transfer” the x-axis to the location of the sinusoidal axis.
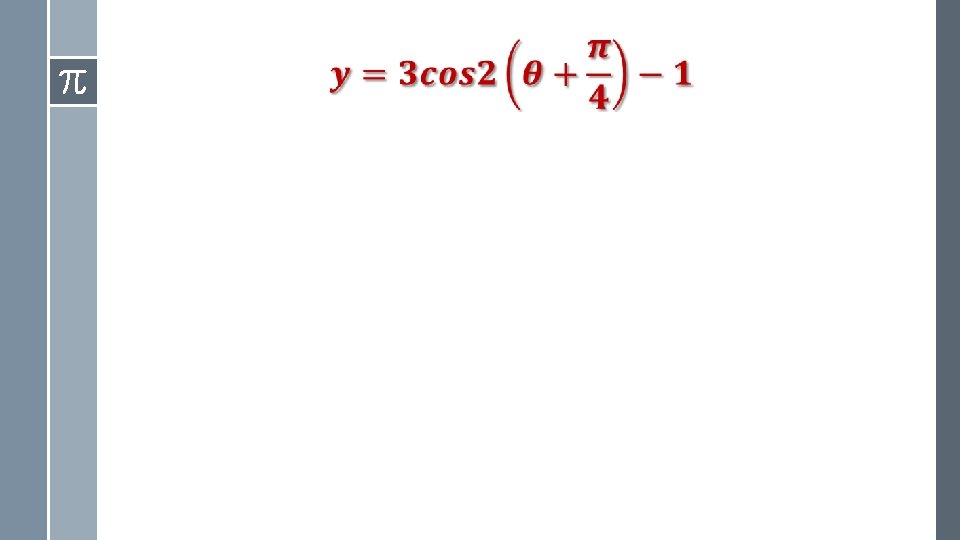
Compounded Transformations › When having multiple transformations for a graph follow this order: 1. Factor out the coefficient of the variable if there is one. 2. Apply the VERTICAL SHIFT and get your sinusoidal axis. 3. Apply the Amplitude (you can sketch two lines that show you the max and min values of your wave to help you. 4. Apply the PHASE SHIFT to get your starting point. 5. Find the period, and move that far out from your starting point to get your final point. 6. Now do “Half-Way In Between. ”
Compounded Transformations ›
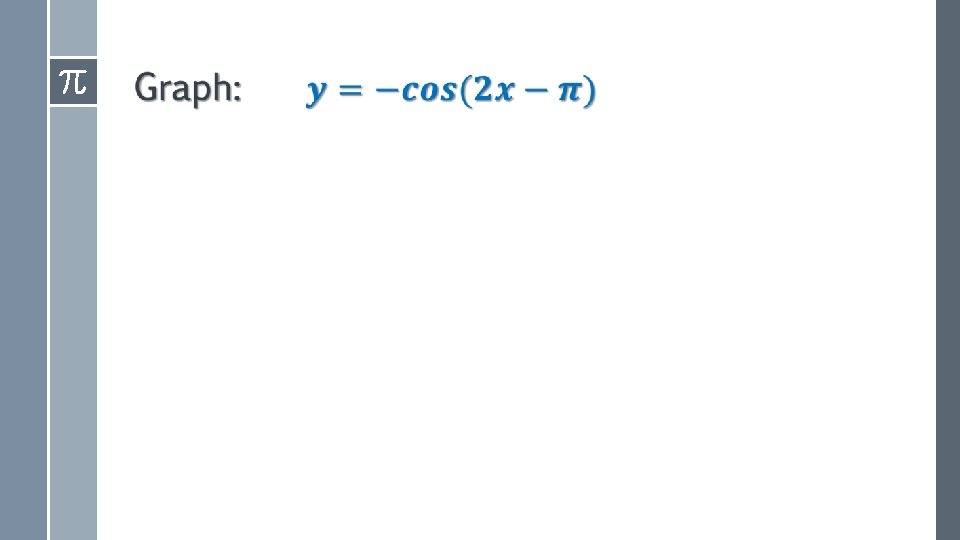
Last Things › If the leading coefficient (of the function) is negative, there is a vertical reflection (across the x-axis) just as there is in other functions. To graph, just flip the pattern you would normally use. › If the leading coefficient of the variable (x, theta) is negative, there is a horizontal reflection (across the yaxis). To graph these, just graph to the left instead of to the right.