
Transformation regression Many seemingly nonlinear relationships can be
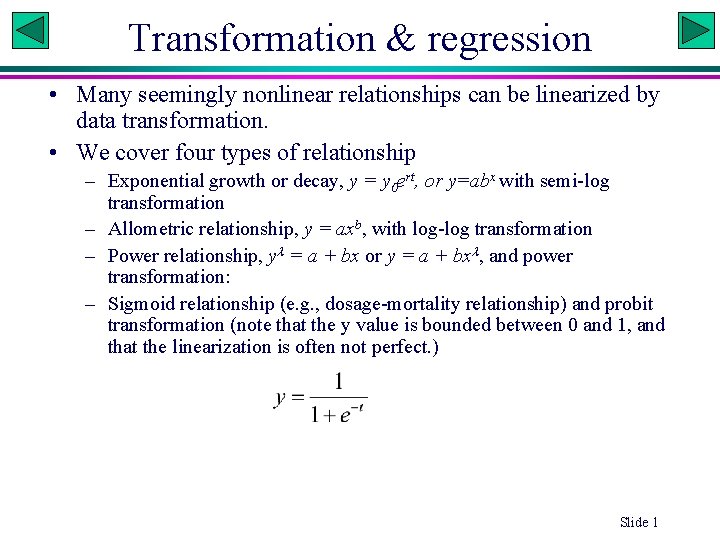
Transformation & regression • Many seemingly nonlinear relationships can be linearized by data transformation. • We cover four types of relationship – Exponential growth or decay, y = y 0 ert, or y=abx with semi-log transformation – Allometric relationship, y = axb, with log-log transformation – Power relationship, y = a + bx or y = a + bx , and power transformation: – Sigmoid relationship (e. g. , dosage-mortality relationship) and probit transformation (note that the y value is bounded between 0 and 1, and that the linearization is often not perfect. ) Slide 1
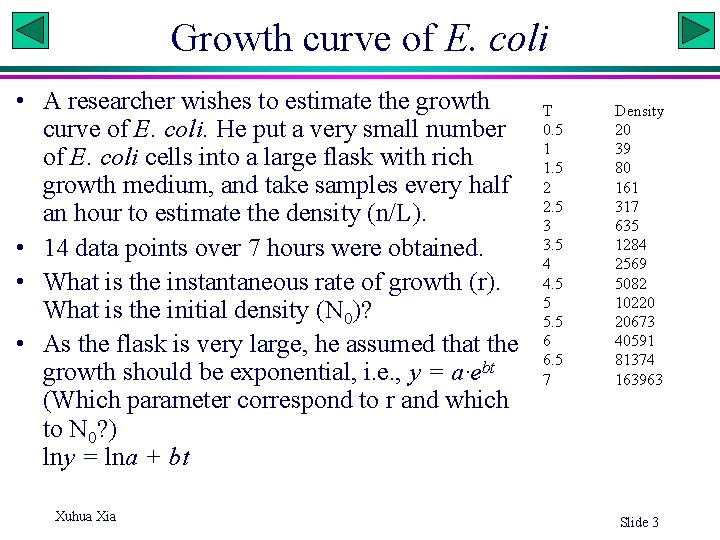
Growth curve of E. coli • A researcher wishes to estimate the growth curve of E. coli. He put a very small number of E. coli cells into a large flask with rich growth medium, and take samples every half an hour to estimate the density (n/L). • 14 data points over 7 hours were obtained. • What is the instantaneous rate of growth (r). What is the initial density (N 0)? • As the flask is very large, he assumed that the growth should be exponential, i. e. , y = a·ebt (Which parameter correspond to r and which to N 0? ) lny = lna + bt Xuhua Xia T 0. 5 1 1. 5 2 2. 5 3 3. 5 4 4. 5 5 5. 5 6 6. 5 7 Density 20 39 80 161 317 635 1284 2569 5082 10220 20673 40591 81374 163963 Slide 3
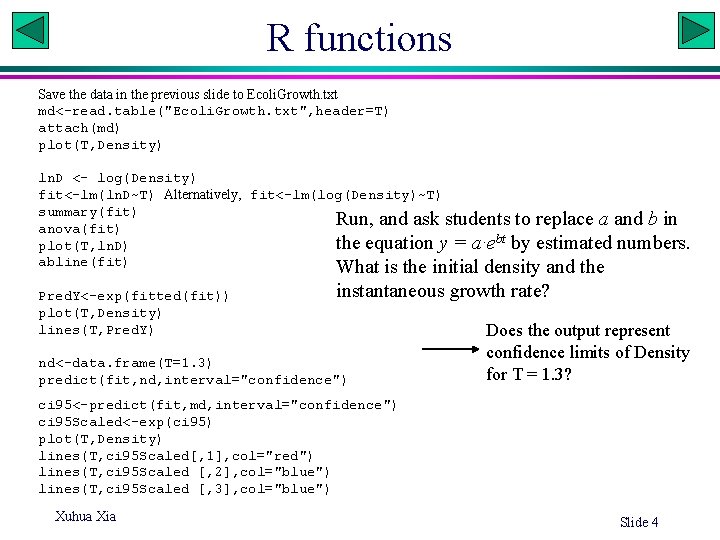
R functions Save the data in the previous slide to Ecoli. Growth. txt md<-read. table("Ecoli. Growth. txt", header=T) attach(md) plot(T, Density) ln. D <- log(Density) fit<-lm(ln. D~T) Alternatively, fit<-lm(log(Density)~T) summary(fit) Run, and ask students to replace a and b in anova(fit) the equation y = a·ebt by estimated numbers. plot(T, ln. D) abline(fit) What is the initial density and the Pred. Y<-exp(fitted(fit)) plot(T, Density) lines(T, Pred. Y) instantaneous growth rate? nd<-data. frame(T=1. 3) predict(fit, nd, interval="confidence") Does the output represent confidence limits of Density for T = 1. 3? ci 95<-predict(fit, md, interval="confidence") ci 95 Scaled<-exp(ci 95) plot(T, Density) lines(T, ci 95 Scaled[, 1], col="red") lines(T, ci 95 Scaled [, 2], col="blue") lines(T, ci 95 Scaled [, 3], col="blue") Xuhua Xia Slide 4
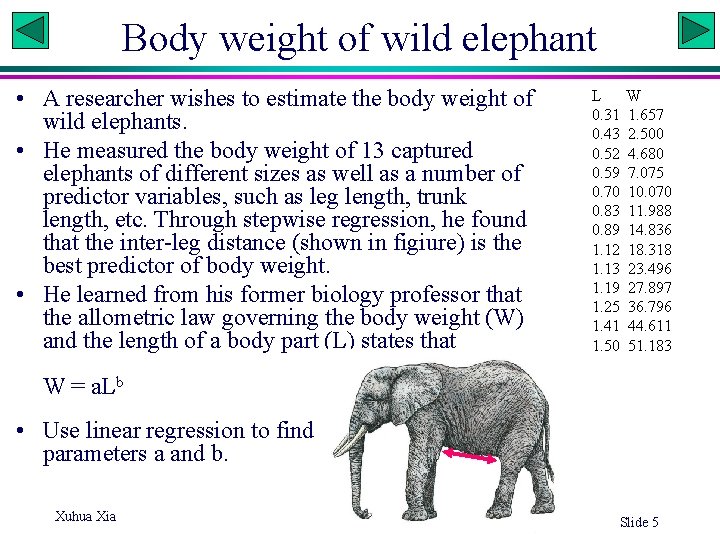
Body weight of wild elephant • A researcher wishes to estimate the body weight of wild elephants. • He measured the body weight of 13 captured elephants of different sizes as well as a number of predictor variables, such as leg length, trunk length, etc. Through stepwise regression, he found that the inter-leg distance (shown in figiure) is the best predictor of body weight. • He learned from his former biology professor that the allometric law governing the body weight (W) and the length of a body part (L) states that L 0. 31 0. 43 0. 52 0. 59 0. 70 0. 83 0. 89 1. 12 1. 13 1. 19 1. 25 1. 41 1. 50 W 1. 657 2. 500 4. 680 7. 075 10. 070 11. 988 14. 836 18. 318 23. 496 27. 897 36. 796 44. 611 51. 183 W = a. Lb • Use linear regression to find parameters a and b. Xuhua Xia Slide 5
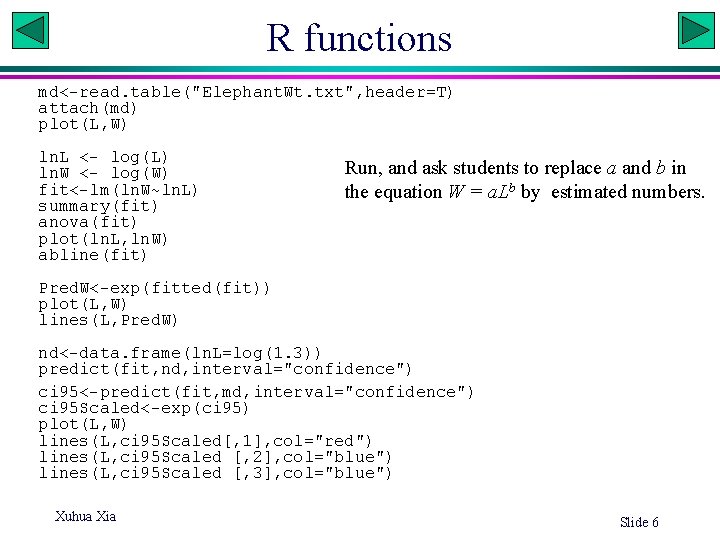
R functions md<-read. table("Elephant. Wt. txt", header=T) attach(md) plot(L, W) ln. L <- log(L) ln. W <- log(W) fit<-lm(ln. W~ln. L) summary(fit) anova(fit) plot(ln. L, ln. W) abline(fit) Run, and ask students to replace a and b in the equation W = a. Lb by estimated numbers. Pred. W<-exp(fitted(fit)) plot(L, W) lines(L, Pred. W) nd<-data. frame(ln. L=log(1. 3)) predict(fit, nd, interval="confidence") ci 95<-predict(fit, md, interval="confidence") ci 95 Scaled<-exp(ci 95) plot(L, W) lines(L, ci 95 Scaled[, 1], col="red") lines(L, ci 95 Scaled [, 2], col="blue") lines(L, ci 95 Scaled [, 3], col="blue") Xuhua Xia Slide 6
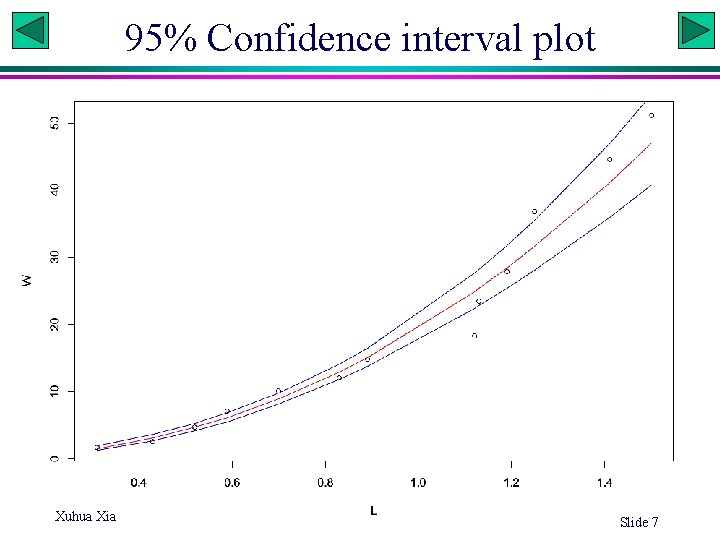
95% Confidence interval plot Xuhua Xia Slide 7
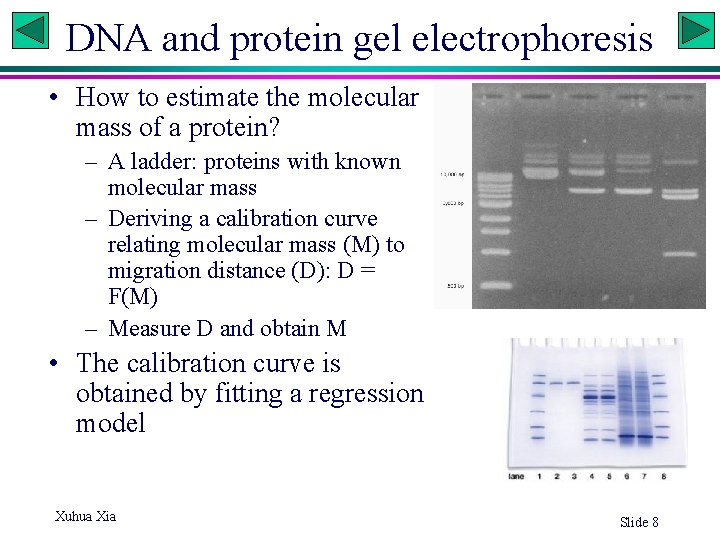
DNA and protein gel electrophoresis • How to estimate the molecular mass of a protein? – A ladder: proteins with known molecular mass – Deriving a calibration curve relating molecular mass (M) to migration distance (D): D = F(M) – Measure D and obtain M • The calibration curve is obtained by fitting a regression model Xuhua Xia Slide 8
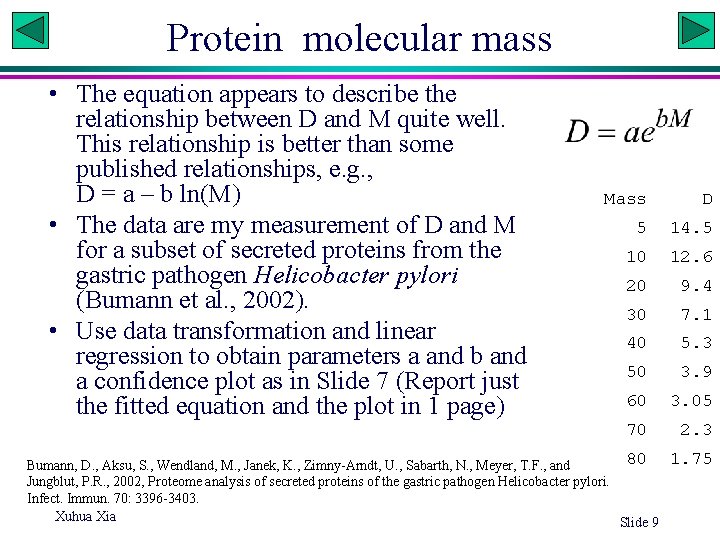
Protein molecular mass • The equation appears to describe the relationship between D and M quite well. This relationship is better than some published relationships, e. g. , D = a – b ln(M) • The data are my measurement of D and M for a subset of secreted proteins from the gastric pathogen Helicobacter pylori (Bumann et al. , 2002). • Use data transformation and linear regression to obtain parameters a and b and a confidence plot as in Slide 7 (Report just the fitted equation and the plot in 1 page) Mass D 5 14. 5 10 12. 6 20 9. 4 30 7. 1 40 5. 3 50 3. 9 60 3. 05 70 2. 3 80 Bumann, D. , Aksu, S. , Wendland, M. , Janek, K. , Zimny-Arndt, U. , Sabarth, N. , Meyer, T. F. , and Jungblut, P. R. , 2002, Proteome analysis of secreted proteins of the gastric pathogen Helicobacter pylori. Infect. Immun. 70: 3396 -3403. Xuhua Xia Slide 9 1. 75
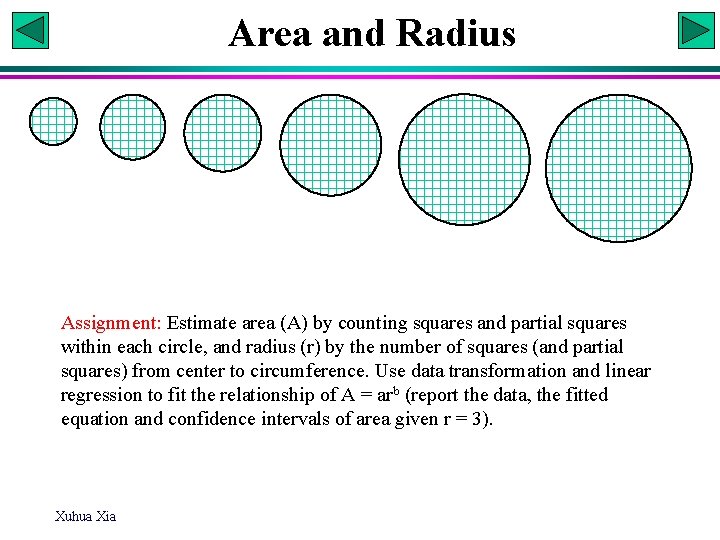
Area and Radius Assignment: Estimate area (A) by counting squares and partial squares within each circle, and radius (r) by the number of squares (and partial squares) from center to circumference. Use data transformation and linear regression to fit the relationship of A = arb (report the data, the fitted equation and confidence intervals of area given r = 3). Xuhua Xia
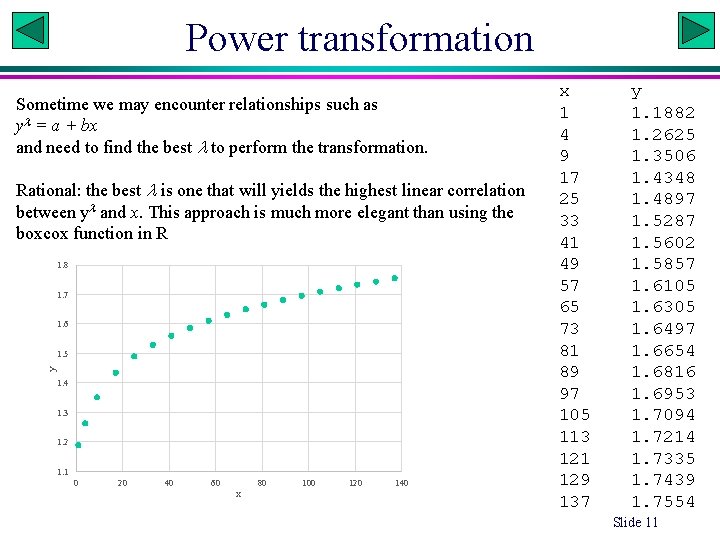
Power transformation Sometime we may encounter relationships such as y = a + bx and need to find the best to perform the transformation. Rational: the best is one that will yields the highest linear correlation between y and x. This approach is much more elegant than using the boxcox function in R 1. 8 1. 7 1. 6 y 1. 5 1. 4 1. 3 1. 2 1. 1 0 20 40 60 80 x 100 120 140 x 1 4 9 17 25 33 41 49 57 65 73 81 89 97 105 113 121 129 137 y 1. 1882 1. 2625 1. 3506 1. 4348 1. 4897 1. 5287 1. 5602 1. 5857 1. 6105 1. 6305 1. 6497 1. 6654 1. 6816 1. 6953 1. 7094 1. 7214 1. 7335 1. 7439 1. 7554 Slide 11
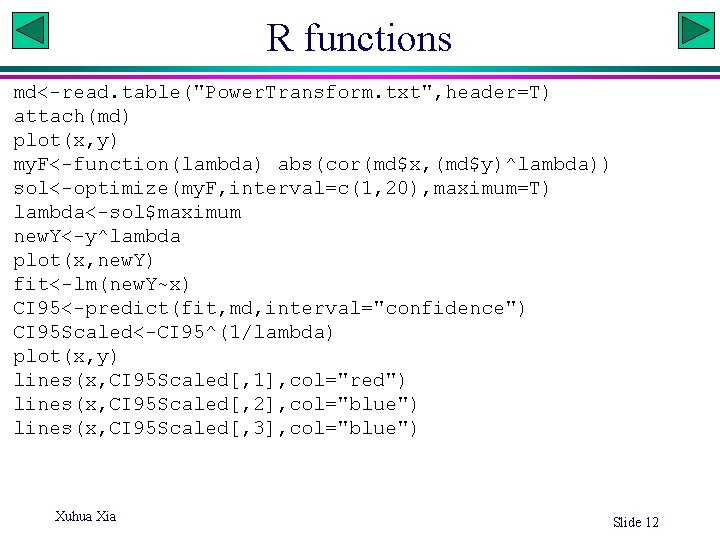
R functions md<-read. table("Power. Transform. txt", header=T) attach(md) plot(x, y) my. F<-function(lambda) abs(cor(md$x, (md$y)^lambda)) sol<-optimize(my. F, interval=c(1, 20), maximum=T) lambda<-sol$maximum new. Y<-y^lambda plot(x, new. Y) fit<-lm(new. Y~x) CI 95<-predict(fit, md, interval="confidence") CI 95 Scaled<-CI 95^(1/lambda) plot(x, y) lines(x, CI 95 Scaled[, 1], col="red") lines(x, CI 95 Scaled[, 2], col="blue") lines(x, CI 95 Scaled[, 3], col="blue") Xuhua Xia Slide 12
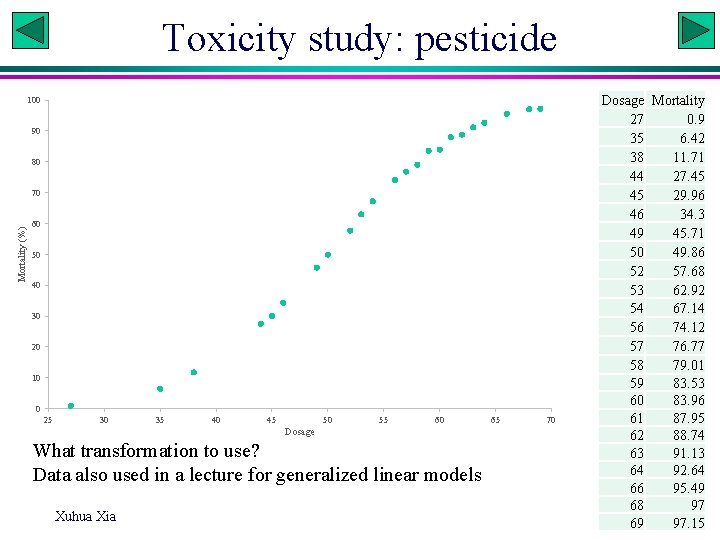
Toxicity study: pesticide 100 90 80 Mortality (%) 70 60 50 40 30 20 10 0 25 30 35 40 45 50 55 60 Dosage What transformation to use? Data also used in a lecture for generalized linear models Xuhua Xia 65 70 Dosage Mortality 27 0. 9 35 6. 42 38 11. 71 44 27. 45 45 29. 96 46 34. 3 49 45. 71 50 49. 86 52 57. 68 53 62. 92 54 67. 14 56 74. 12 57 76. 77 58 79. 01 59 83. 53 60 83. 96 61 87. 95 62 88. 74 63 91. 13 64 92. 64 66 95. 49 68 97 Slide 69 13 97. 15
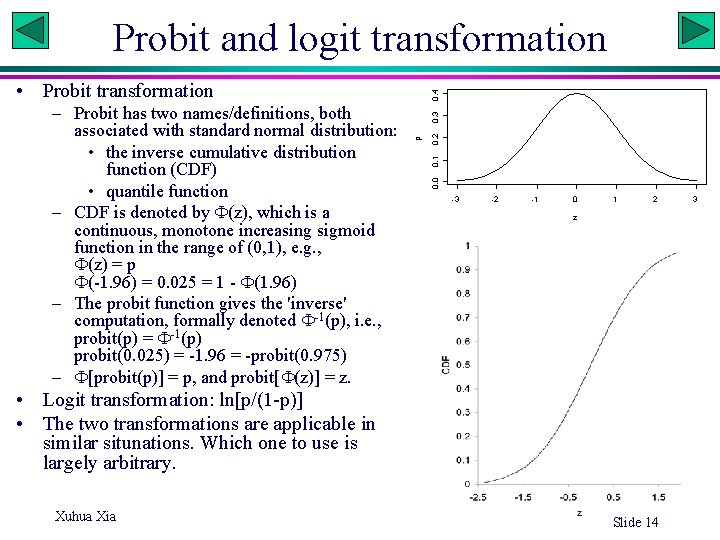
Probit and logit transformation 0. 3 0. 2 0. 1 0. 0 p – Probit has two names/definitions, both associated with standard normal distribution: • the inverse cumulative distribution function (CDF) • quantile function – CDF is denoted by (z), which is a continuous, monotone increasing sigmoid function in the range of (0, 1), e. g. , (z) = p (-1. 96) = 0. 025 = 1 - (1. 96) – The probit function gives the 'inverse' computation, formally denoted -1(p), i. e. , probit(p) = -1(p) probit(0. 025) = -1. 96 = -probit(0. 975) – [probit(p)] = p, and probit[ (z)] = z. 0. 4 • Probit transformation -3 -2 -1 0 1 2 z • Logit transformation: ln[p/(1 -p)] • The two transformations are applicable in similar situnations. Which one to use is largely arbitrary. Xuhua Xia Slide 14 3
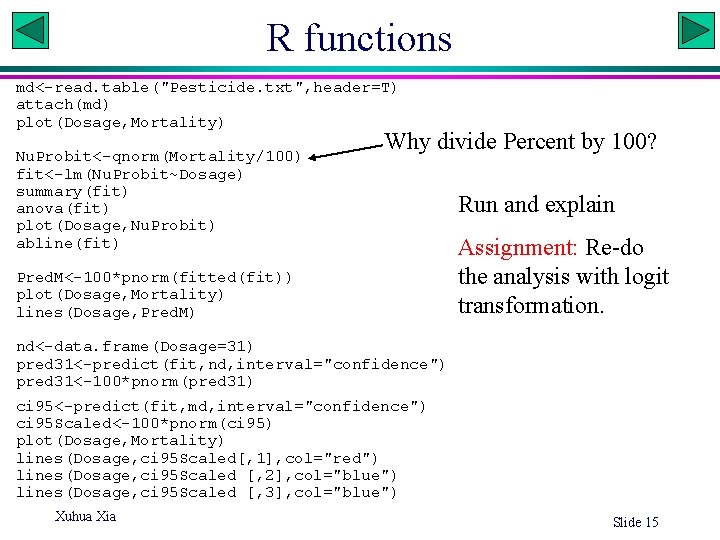
R functions md<-read. table("Pesticide. txt", header=T) attach(md) plot(Dosage, Mortality) Nu. Probit<-qnorm(Mortality/100) fit<-lm(Nu. Probit~Dosage) summary(fit) anova(fit) plot(Dosage, Nu. Probit) abline(fit) Why divide Percent by 100? Pred. M<-100*pnorm(fitted(fit)) plot(Dosage, Mortality) lines(Dosage, Pred. M) Run and explain Assignment: Re-do the analysis with logit transformation. nd<-data. frame(Dosage=31) pred 31<-predict(fit, nd, interval="confidence") pred 31<-100*pnorm(pred 31) ci 95<-predict(fit, md, interval="confidence") ci 95 Scaled<-100*pnorm(ci 95) plot(Dosage, Mortality) lines(Dosage, ci 95 Scaled[, 1], col="red") lines(Dosage, ci 95 Scaled [, 2], col="blue") lines(Dosage, ci 95 Scaled [, 3], col="blue") Xuhua Xia Slide 15
- Slides: 14