
Traffic and Revenue Forecasts for I95 Express Lanes


- Slides: 22
Traffic and Revenue Forecasts for I-95 Express Lanes in South Florida Phani Jammalamadaka, PE, PMP Ozge Cavusoglu, Ph. D, PTP Negaar Minaei June 4, 2019
Overview § Background § Travel Demand Toll Diversion Modeling § Results 2
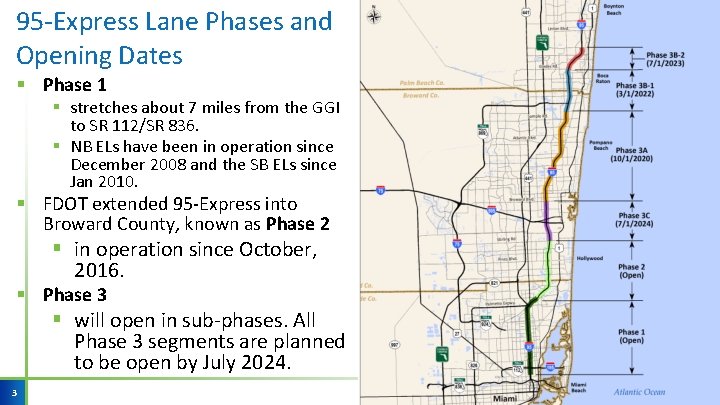
95 -Express Lane Phases and Opening Dates § Phase 1 § stretches about 7 miles from the GGI to SR 112/SR 836. § NB ELs have been in operation since December 2008 and the SB ELs since Jan 2010. § FDOT extended 95 -Express into Broward County, known as Phase 2 § in operation since October, 2016. § Phase 3 § will open in sub-phases. All Phase 3 segments are planned to be open by July 2024. 3
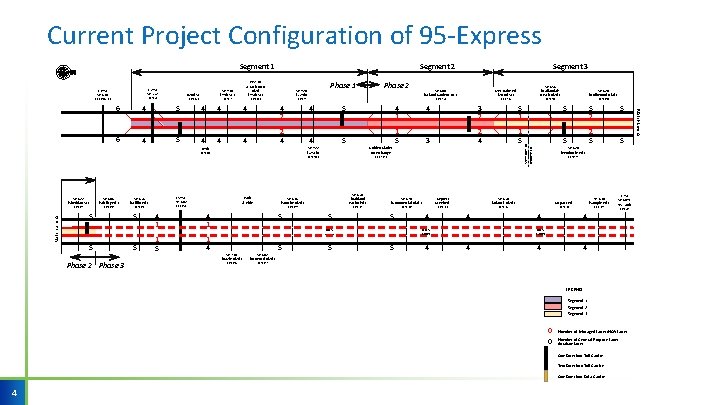
Current Project Configuration of 95 -Express Exit 2 D/3 A SR 934 (79 th St. ) 62 nd St. Exit 4 Exit 7 Exit 6 A 5 4 4 4 6 4 5 4 4 2 2 4 Match Line A Exit 21 SR 848 (Stirling Rd. ) Exit 22 5 5 Phase 2 Phase 3 5 5 Park & Ride Exit 24 Exit 23 5 4 1 1 5 1 4 1 5 SR 816 (Oakland Park Blvd. ) Exit 31 Exit 26 SR 842 (Broward Blvd. ) 5 3 5 SR 870 (Commercial Blvd. ) 5 Cypress Creek Rd. Exit 32 5 4 3 2 5 1 5 4 Exit 20 2 4 1 5 5 5 2 5 5 5 SR 824 (Pembroke Rd. ) Exit 19 SR 834 (Sample Rd. ) Copans Rd. Exit 36 4 SR 820 (Hollywood Blvd. ) Exit 18 SR 814 (Atlantic Blvd. ) Exit 33 HOV Lanes SR 736 (Davie Blvd. ) 4 Exit 12 A SR 838 (Sunrise Blvd. ) 5 Exit 16 Golden Glades Interchange Exit 29 4 1 Exit 10 A I-595/ SR 862 SR 818 (Griffin Rd. ) 4 SR 858 (Hallandale Beach Blvd. ) Ives Dairy Rd. (203 rd St. ) Exit 14 SR 922 (125 th) 69 th Exit 6 B SR 822 (Sheridan St. ) SR 860 (Miami Gardens Dr. ) Exit 39 Exit 38 4 I-75/ SR 869/ SW 10 th Exit 41 4 HOV Lanes 4 4 4 Exit 27 LEGEND Segment 1 Segment 2 Segment 3 0 0 Number of Managed Lanes/HOV Lanes Number of General Purpose Lanes Auxiliary lanes One Direction Toll Gantry Two Direction Toll Gantry One Direction Data Gantry 4 Match Line A 4 Phase 2 Exit 9 Exit 8 A 6 Phase 1 SR 924 (119 th) Segment 3 Broward Co. I-195/ SR 112 I-395/ SR 836 Segment 2 Rev. Dr. A. Jackson Jr. Blvd. (95 th St. ) Miami-Dade Co. Segment 1
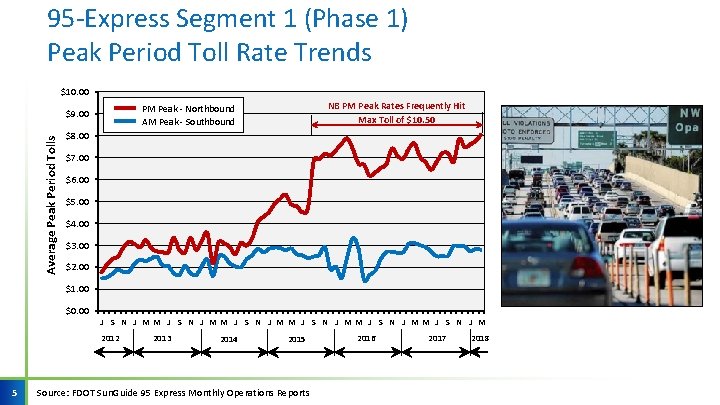
95 -Express Segment 1 (Phase 1) Peak Period Toll Rate Trends $10. 00 Average Peak Period Tolls NB PM Peak Rates Frequently Hit Max Toll of $10. 50 PM Peak - Northbound AM Peak - Southbound $9. 00 $8. 00 $7. 00 $6. 00 $5. 00 $4. 00 $3. 00 $2. 00 $1. 00 $0. 00 J S N J MM J S N J MM J S N J M 2012 5 2013 2014 2015 Source: FDOT Sun. Guide 95 Express Monthly Operations Reports 2016 2017 2018
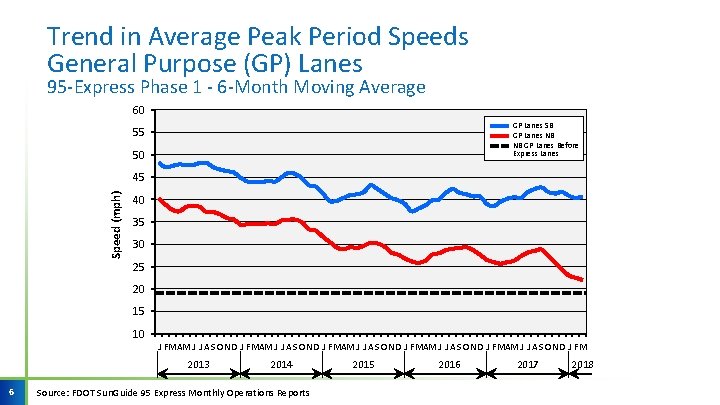
Trend in Average Peak Period Speeds General Purpose (GP) Lanes 95 -Express Phase 1 - 6 -Month Moving Average 60 GP Lanes SB GP Lanes NB NB GP Lanes Before Express Lanes 55 50 Speed (mph) 45 40 35 30 25 20 15 10 J FMAM J J A S OND J FMAM J J A S OND J FM 2013 6 2014 Source: FDOT Sun. Guide 95 Express Monthly Operations Reports 2015 2016 2017 2018
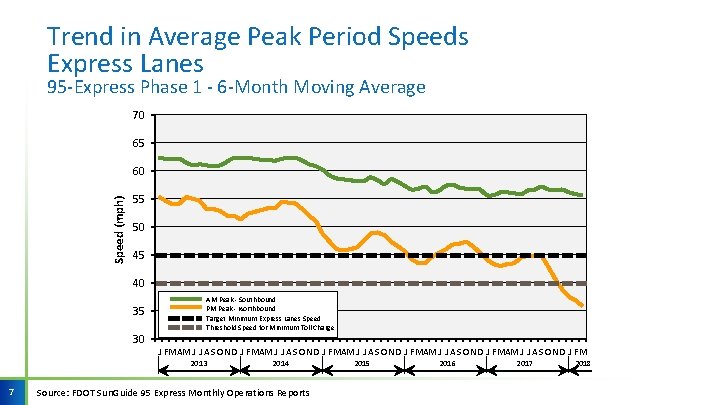
Trend in Average Peak Period Speeds Express Lanes 95 -Express Phase 1 - 6 -Month Moving Average 70 65 Speed (mph) 60 55 50 45 40 35 30 AM Peak - Southbound PM Peak - Northbound Target Minimum Express Lanes Speed Threshold Speed for Minimum Toll Charge J FMAM J J A S OND J FMAM J J A S OND J FM 2013 7 2014 Source: FDOT Sun. Guide 95 Express Monthly Operations Reports 2015 2016 2017 2018
Travel Demand Toll Diversion Modeling
Express Lanes Time of Day (ELTo. D) Model Version 4 § ELTo. D Model is a forecasting tool developed by the Florida’s Turnpike Enterprise (FTE) in collaboration with AECOM, RSG, and HNTB § Incorporates a Dynamic Traffic Assignment (DTA) Model § Predicts the share of express lanes traffic by utilizing a binary logit choice model, which includes value of time and value of reliability § Estimates the associated dynamic toll rates for the express lanes based on the defined toll pricing policy curves 9
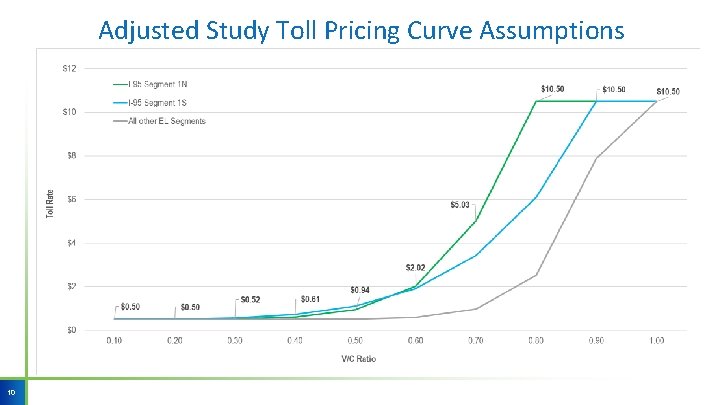
Adjusted Study Toll Pricing Curve Assumptions 10
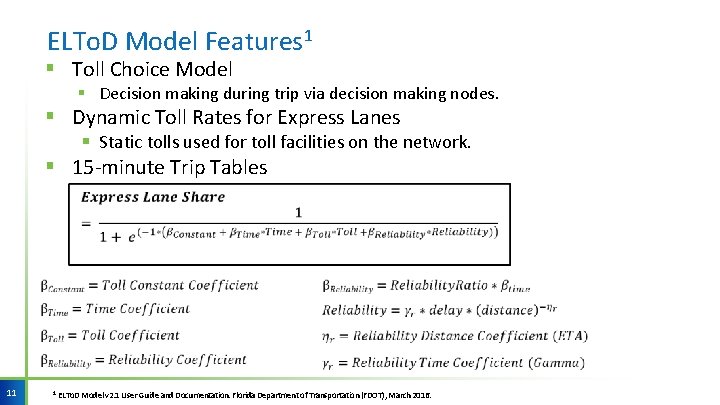
ELTo. D Model Features 1 § Toll Choice Model § Decision making during trip via decision making nodes. § Dynamic Toll Rates for Express Lanes § Static tolls used for toll facilities on the network. § 15 -minute Trip Tables 11 1 ELTo. D Model v 2. 1 User Guide and Documentation. Florida Department of Transportation (FDOT), March 2016.
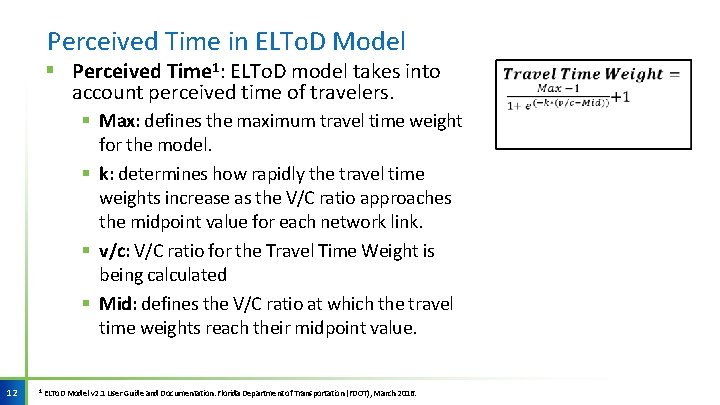
Perceived Time in ELTo. D Model § Perceived Time 1: ELTo. D model takes into account perceived time of travelers. § Max: defines the maximum travel time weight for the model. § k: determines how rapidly the travel time weights increase as the V/C ratio approaches the midpoint value for each network link. § v/c: V/C ratio for the Travel Time Weight is being calculated § Mid: defines the V/C ratio at which the travel time weights reach their midpoint value. 12 1 ELTo. D Model v 2. 1 User Guide and Documentation. Florida Department of Transportation (FDOT), March 2016.
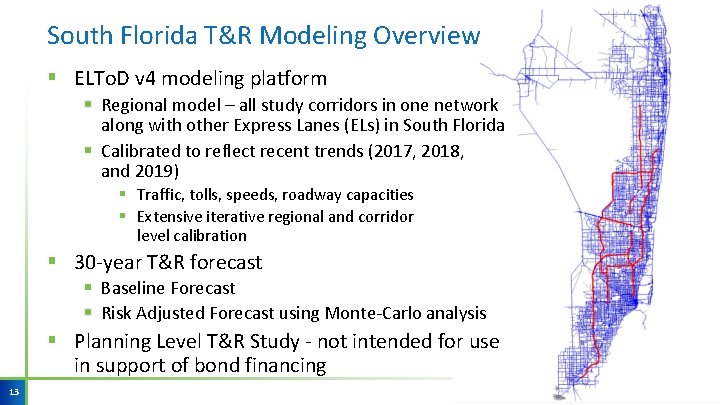
South Florida T&R Modeling Overview § ELTo. D v 4 modeling platform § Regional model – all study corridors in one network along with other Express Lanes (ELs) in South Florida § Calibrated to reflect recent trends (2017, 2018, and 2019) § Traffic, tolls, speeds, roadway capacities § Extensive iterative regional and corridor level calibration § 30 -year T&R forecast § Baseline Forecast § Risk Adjusted Forecast using Monte-Carlo analysis § Planning Level T&R Study - not intended for use in support of bond financing 13
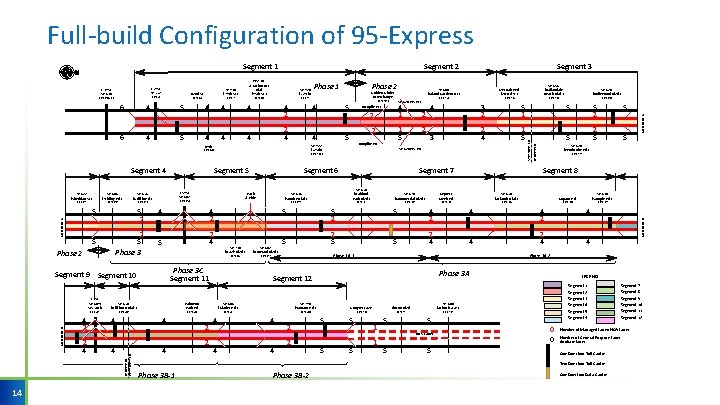
Full-build Configuration of 95 -Express SR 924 (119 th) 6 4 5 4 4 2 6 4 5 4 4 4 2 4 Exit 6 B SR 822 (Sheridan St. ) Exit 21 SR 848 (Stirling Rd. ) Match Line A 5 5 Phase 2 I-595/ SR 862 5 2 4 2 5 Phase 3 5 Match Line B Exit 41 14 4 2 2 4 4 4 SR 736 (Davie Blvd. ) Exit 26 Phase 3 C Segment 11 4 2 2 2 1 5 2 Turnpike ELs 3 2 5 1 5 5 2 5 3 2 4 1 5 5 2 5 5 SR 842 (Broward Blvd. ) Segment 7 SR 870 (Commercial Blvd. ) Exit 31 4 4 SR 814 (Atlantic Blvd. ) Exit 33 SR 834 (Sample Rd. ) Copans Rd. Exit 36 Exit 39 Exit 38 4 2 4 5 2 5 5 2 4 4 Phase 3 A-1 Phase 3 A-2 Phase 3 A SR 794 (Yamato Rd. ) Congress Ave. Exit 48 4 Exit 19 Segment 8 Cypress Creek Rd. Exit 32 SR 824 (Pembroke Rd. ) 5 Exit 27 4 Exit 20 4 SR 826 EW ELs SR 816 (Oakland Park Blvd. ) SR 820 (Hollywood Blvd. ) Exit 18 5 2 Exit 45 2 2 Exit 16 5 SR 808 (Glades Rd. ) Exit 44 4 4 1 Turnpike ELs Segment 12 Palmetto Park Rd. Exit 42 5 Exit 29 2 4 SR 810 (Hillsboro Blvd. ) Broward Co. Palm Beach Co. I-75/ SR 869/ SW 10 th 4 SR 838 (Sunrise Blvd. ) 4 2 Segment 9 Segment 10 5 SR 858 (Hallandale Beach Blvd. ) Ives Dairy Rd. (203 rd St. ) Exit 14 SR 826 EW ELs Segment 6 Park & Ride Exit 24 Exit 23 4 Exit 12 A SR 860 (Miami Gardens Dr. ) Exit 10 A Segment 5 SR 818 (Griffin Rd. ) Exit 22 Phase 2 Golden Glades Interchange SR 922 (125 th) 69 th Segment 4 Phase 1 Exit 9 Exit 8 A 2 2 5 5 5 Exit 52 Exit 51 1 1 5 5 HOV Lanes 5 LEGEND Segment 1 Segment 2 Segment 3 Segment 4 Segment 5 Segment 6 SR 806 (Atlantic Ave. ) Linton Blvd. Exit 50 5 5 0 0 Phase 3 B-2 Segment 7 Segment 8 Segment 9 Segment 10 Segment 11 Segment 12 Number of Managed Lanes/HOV Lanes Number of General Purpose Lanes Auxiliary lanes One Direction Toll Gantry Two Direction Toll Gantry Phase 3 B-1 Match Line A Exit 7 Exit 6 A Match Line B SR 934 (79 th St. ) 62 nd St. Exit 4 Segment 3 Broward Co. I-195/ SR 112 I-395/ SR 836 Exit 2 D/3 A Segment 2 Rev. Dr. A. Jackson Jr. Blvd. (95 th St. ) Miami-Dade Co. Segment 1 One Direction Data Gantry
2018 Study Methodology § Base year (2017) ELTo. D model calibration § Reviewed hourly traffic counts on ramp and mainline locations from FDOT’s website; screenline counts were added § Developed updated detailed count profile for 95 -Express/595 -Express (including detailed count patterns at GGI), and profile along I-75/SR 826 § Several iterations of Origin/Destination Matrix Estimation (ODME) and model calibration performed § ODME included 8 network wide screenlines 15
2018 Study Methodology (Cont'd) § 24 different ELTo. D calibration runs § Toll Constants at each Decision Making Node were updated for every 15 -min for all model years. § Toll Pricing Curves updated § Speeds/capacities on arterials updated § Capacities on general purpose lanes and express lanes updated § PCE factor updated for trucks § Dynamic Traffic Assignment (DTA) module update § Reviewed 95 -Express, 595 -Express and 75 -Express trends in terms of traffic, toll, revenue, and operations through April/May 2018 16
2018 Study Methodology (Cont'd) § Future Year models § 2018, 2019, 2021, 2023, 2024, 2028, 2030, 2035, and 2045 § 2028 Model Year run with and without GGI improvements, including TPKE/SR 826 EW ELs § 2030 Model Year run with and without Sawgrass Express 10 th St extension § Base year trip table adjustments carried to future years § Network updates to reflect latest phasing on 95 -Express and 75 -Express, and other ELs on the network (Turnpike, HEFT, Sawgrass) § Post-processing adjustments were applied after performing reasonableness checks 17
Results
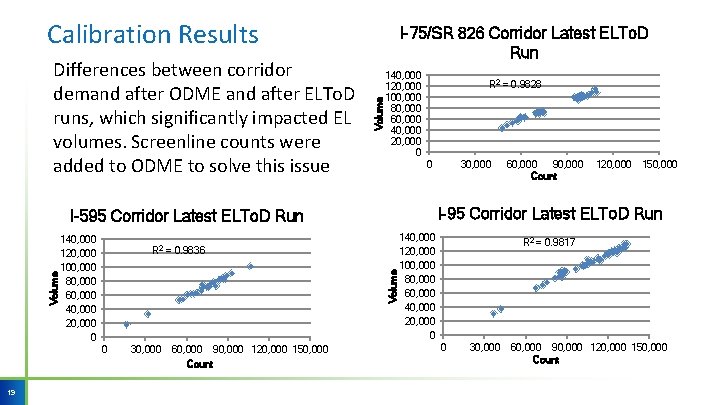
Calibration Results Volume Differences between corridor demand after ODME and after ELTo. D runs, which significantly impacted EL volumes. Screenline counts were added to ODME to solve this issue I-75/SR 826 Corridor Latest ELTo. D Run 140, 000 120, 000 100, 000 80, 000 60, 000 40, 000 20, 000 0 R 2 = 0. 9828 0 Volume R 2 = 0. 9836 0 19 30, 000 60, 000 90, 000 120, 000 150, 000 Count 60, 000 90, 000 Count 120, 000 150, 000 I-95 Corridor Latest ELTo. D Run I-595 Corridor Latest ELTo. D Run 140, 000 120, 000 100, 000 80, 000 60, 000 40, 000 20, 000 0 30, 000 140, 000 120, 000 100, 000 80, 000 60, 000 40, 000 20, 000 0 R 2 = 0. 9817 0 30, 000 60, 000 90, 000 120, 000 150, 000 Count
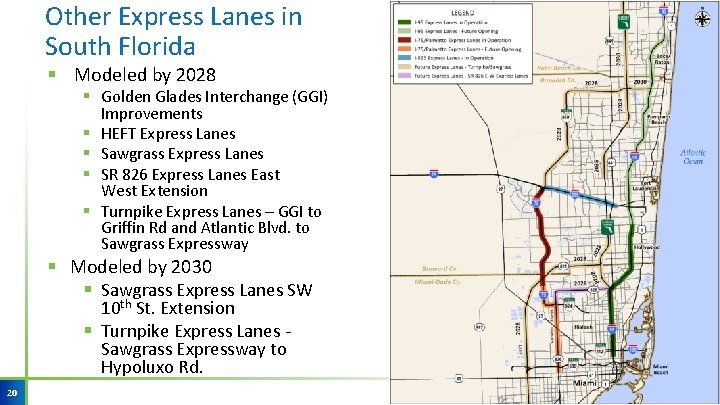
Other Express Lanes in South Florida § Modeled by 2028 § Golden Glades Interchange (GGI) Improvements § HEFT Express Lanes § Sawgrass Express Lanes § SR 826 Express Lanes East West Extension § Turnpike Express Lanes – GGI to Griffin Rd and Atlantic Blvd. to Sawgrass Expressway § Modeled by 2030 § Sawgrass Express Lanes SW 10 th St. Extension § Turnpike Express Lanes - Sawgrass Expressway to Hypoluxo Rd. 20
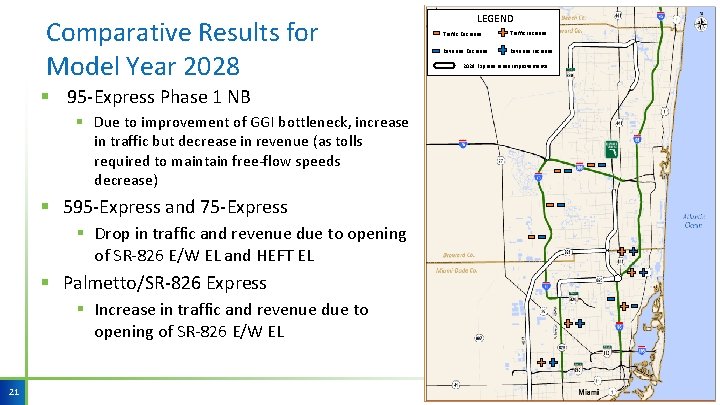
Comparative Results for Model Year 2028 § 95 -Express Phase 1 NB § Due to improvement of GGI bottleneck, increase in traffic but decrease in revenue (as tolls required to maintain free-flow speeds decrease) § 595 -Express and 75 -Express § Drop in traffic and revenue due to opening of SR-826 E/W EL and HEFT EL § Palmetto/SR-826 Express § Increase in traffic and revenue due to opening of SR-826 E/W EL 21 LEGEND Traffic Decrease Traffic Increase Revenue Decrease Revenue Increase 2028 Express Lanes Improvements
Thank you!