Traditional Flows of Commodities and Finished Products Flows


 changes are an important part of globalisation. • Demography has")


Transport: • In the 1960’s the Boeing 747 made international")
 Transnational corporations (TNC’s): These are firms with operations spread through out the world,")
: • Computer aided design (CAD) and manufacturing (CAM)")
, which")

- Slides: 33
Traditional Flows of Commodities and Finished Products Flows South – North of primary goods, raw material and food products Flows North – South of manufactured processed goods and services A wealthy core and periphery emerged. These trade patterns largely survive even now.
Background: Theory of Core and Periphery Geographers use core and periphery theory to explain the process by which some countries become wealthy and others poor. • • The Core is where most wealth is produced. Global cores include North America, Europe and Japan. This core: Owns and consumes 80% of global goods and services. Earns the highest incomes. Makes most decisions about the global economy e. g. What goods are produced Provides most global investment. The Periphery Meanwhile the poorer periphery is usually distant from the core markets. These countries: • Own and consume 20% of global goods and services despite having 75% of global population. • Earns lower income – 2. 5 billion people live on US$2 a day • Make few decisions about the global economy and provides little investment
Owns and consumes 80% of global goods and services Today, new global connections add flows of finished and semi finished products from these countries to the traditional flows of commodities and raw materials Owns and consumes 20% of global goods and services. Makes most decisions about the global economy e. g. what goods are produced We have 75% of the world’s population Core or Periphery? Earn low incomes – 2. 5 billion people live on less than $2 per day Makes very few decisions about the global economy Manufacturing has risen here because we offer cheaper labour Earns the highest incomes Manufacturing has fallen here but we profit because we dictate to the new production lines C = Core P = Periphery Provides very little global investment Provides most global investment
• A large proportion of production, trade and investment is concentrated in 3 regions. • Europe. (EU) • North America (NAFTA) • East Asia (APEC) • These are known as the Global Triad
Globalisation, Population Change and Migration
Know – what the DTM is Understand – how globalisation has affected population & migration Skills – exam practice, revision strategies LEARNING OBJECTIVES & OUTCOMES A* - A Evaluate the use of models to B show trends in population and Explain the factors and migration and C-D how suggest how globalisation Describe globalisation affects the stages of population may have an the DTM and influence in reasons for migration the future migration
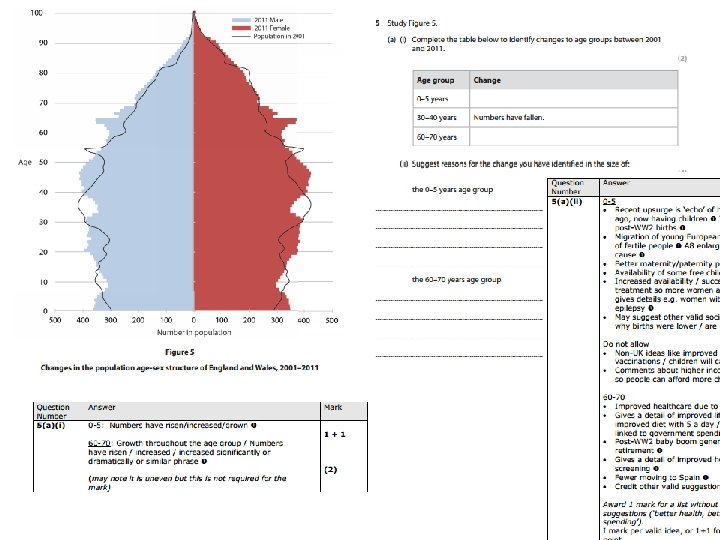
Countries Population
Net immigration Net emigration
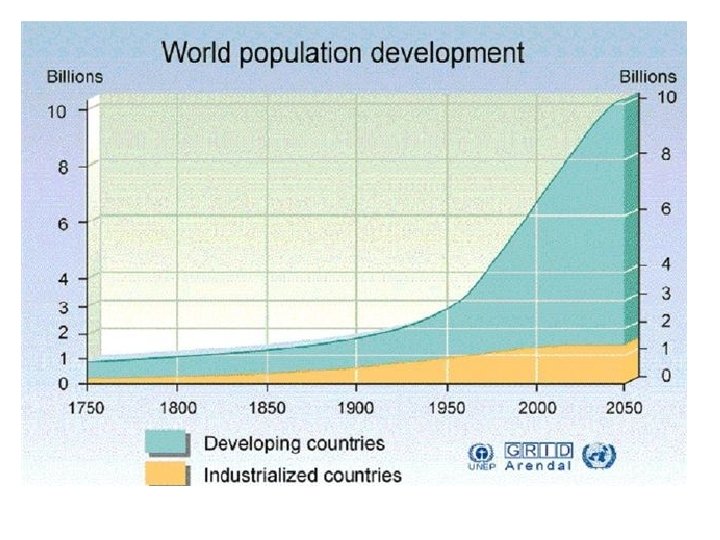
Demography/Population • Demographic (population) changes are an important part of globalisation. • Demography has changed massively over the last 50 years and is predicted to change even more in the next 50 years – both in terms of population size and distribution.
Places that experience economic growth usually trigger an increase in the number of people living in region due to changes in the: a)Birth rate b)Death rate c)Migration – natural increase
Population Growth Over Time • The Industrial Revolution lead to fall in death rate and the birth rate – due to benefits of modern healthcare, sanitation, nutrition and education • Economic growth is normally coupled by population growth e. g. the UK went from 5 million in 1750 to 40 million in 1900 • Similarly, India has boomed from 300 million to over a billion today • However, population growths remain high when a countries birth rate does not drop due to cultural preferences for more children not changing – this is the case in large parts of Africa
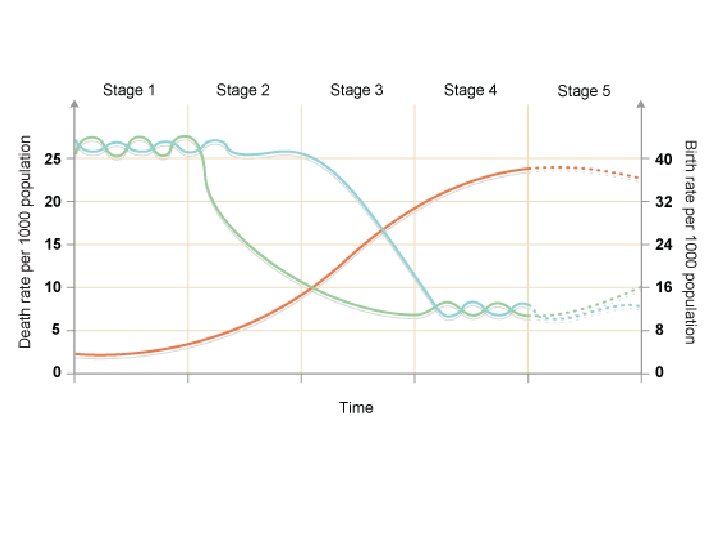
The Demographic Transition Model
Strengths of the model • It shows changes through time • It describes what has happened in the UK • Many other countries in Europe and North America went through similar stages as they industrialised • Some NICs such as Singapore and South Korea went through similar stages, though faster • It helps explain what has happened and why it has happened in that particular sequence
Limitations of the model • It is based on the experience of industrialised countries and is not relevant to non industrialised countries • It assumes stage 3 follows industrialisation. Not always the case. Factors causing DR to fall have been imported from developed countries so have occurred much more quickly • It assumes Stage 4 follows decades after Stage 3. Not the case. In some countries is held back and in others occurs more quickly e. g. China • Original model has been adapted to include a 5 th stage • Does not predict the future
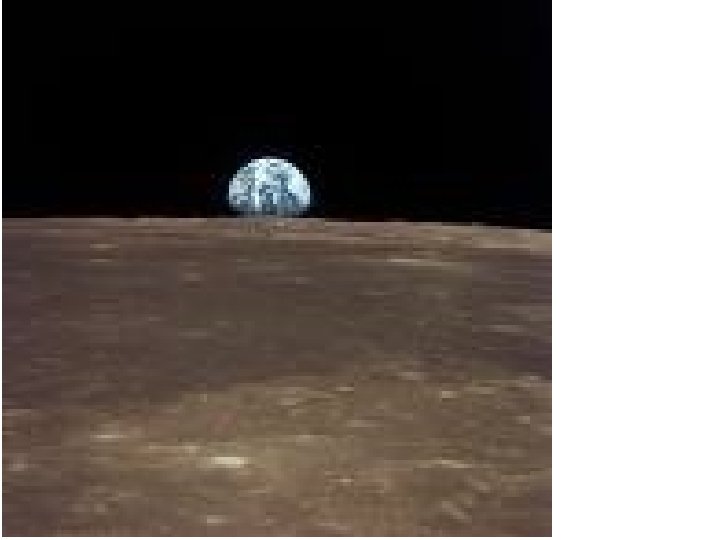
The Borderless World This is the first photo ever taken of the Earth from Apollo 11 in 1969. People had never seen the Earth like this. From this point onwards people began to view themselves as global citizens, visiting and often relocating to distant places This is especially true of the international elite
So what affects why and how people move around? • You should hopefully remember that refer to these reasons as push and pull factors Things that encourage people to leave the place they live in Things that draw/attract people to an area Push and pull factors
Push Factors Pull Factors
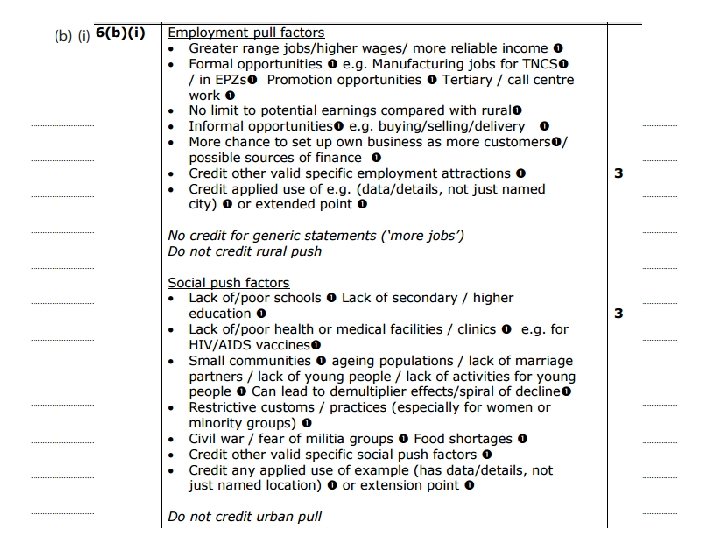
Push factors Pull factors • Unemployment • Employment/jobs available • Lack of services/amenities • Better services (schools, hospitals etc) • Poor safety and security • Safer area • High crime rates • Low crime rate • Crop failure • Fertile land for growing crops • Drought • Good food supplies • Harsh climate (too hot or too cold) • Less risk of natural hazards (drought, hurricanes etc) • Flooding • More wealth • Poverty • Stable political group • War • Attractive climate (not too harsh) • Better quality of life
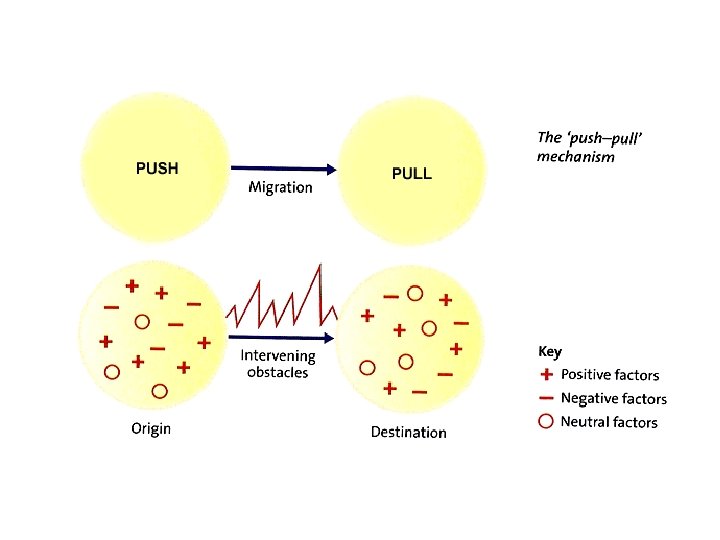
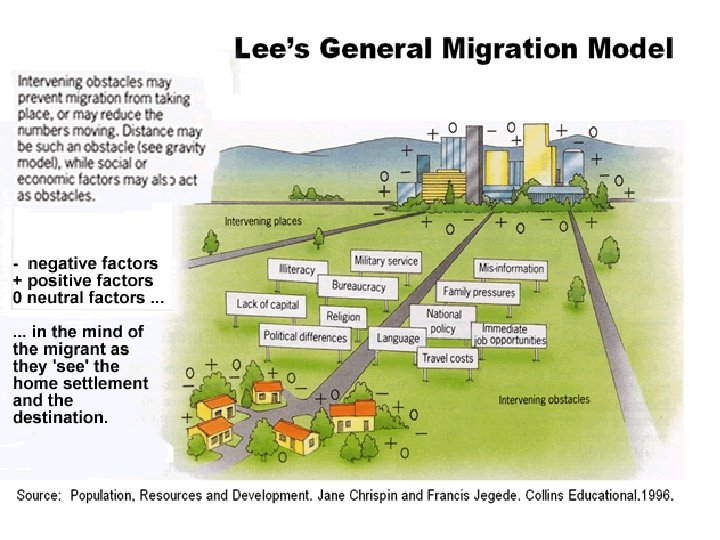
Migrational change can lead to either a fall or rise in population • A Net Migration gain occurs when more people immigrate than emigrate. • A Net Migration loss occurs when more people emigrate than immigrate. The movement of people has led to a globalisation of population with diverse populations made up of many different beliefs, cultures and mixed societies. Migration is largely dependent on a combination of push and pull factors. However it is also largely dependent on the barriers facing a migrant known as ‘intervening obstacles. ’ Examples include: • Social obstacles e. g. family ties back home. • Economic obstacles e. g. The cost of setting up a new home. • Lack of information about destination e. g. Where to stay upon arrival.
Lee’s migration model
Intervening opportunity? • An alternative migration destination that exists between the migrant’s place of origin and their destination • E. G. Poles migrating to Ireland pass through London on route and instead settle there.
Why is globalisation increasing? 1)Transport: • In the 1960’s the Boeing 747 made international travel more common, and more recently, the expansion of cheap flight sectors has increased air travel e. g. Easyjet and Ryanair. • Secondly containerisation (shipping goods) since the 1940’s has increased globalisation
2) Transnational corporations (TNC’s): These are firms with operations spread through out the world, operating in many nations as both makers and sellers of goods and services. Eg. Coca-Cola and Mc. Donalds. The BBC is one too (interestingly part funded by the government of the UK). They have caused massive economic and cultural changes.
3. Computer & internet (and media): • Computer aided design (CAD) and manufacturing (CAM) have made manufacturing less human reliant allowing firms to become more footloose. • And ICT has allowed video conferencing and emails, allowing TNC’s to expand worldwide. • Social networking eg Facebook, Skype and Twitter • Home internet shopping • Online education eg Open University • Even on-line dating!!!
4. International organisations: • • • Such as the International Monetary Fund (IMF), which channels loans from worlds richest nations to countries which seek economic help. In return, the requesting country has to agree to free-market economies, which means TNC’s can enter, promoting globalisation. The World Trade Organisation (WTO) and World Bank also work along side the IMF. Non-governmental organisations (NGO’S) such as Oxfam, also have had major influence, working to connect places through aid and debt relief. •
5. Markets: More people are resident in urban areas and are significant consumers of goods and services. In 2007 China already had 30 million affluent consumers and by 2015 it is expected to be the world’s largest market for consumer goods. The growth of major stock markets has been an important influence New stock markets have emerged eg Shanghai