Trade Choices You have 1 000 to spend


 Current Account -706. 0 Merchandise trade")


 Country Exports")
 Current Account Goods & Services exports")
 Sources of Foreign Direct Investment")
 Population (millions) GDP")
 Labor Costs")
- Slides: 24
Trade Choices You have $1, 000 to spend and your alternatives are to: Purchase one U. S. made television and one U. S. made bicycle. or Purchase one Chinese made television, one Korean made bicycle and two cases of French wine. or Use the $1, 000 for investment in the stock of a Canadian company. Which do you choose to do?
Apples and Oranges Apple price $. 70/lb Orange Price $. 70/lb Washington Rancher 20 acres yields Apples 50 bu/acre Oranges 1 bu/acre Florida Rancher 20 acres yields Apples 2 bu/acre Oranges 40 bu/acre
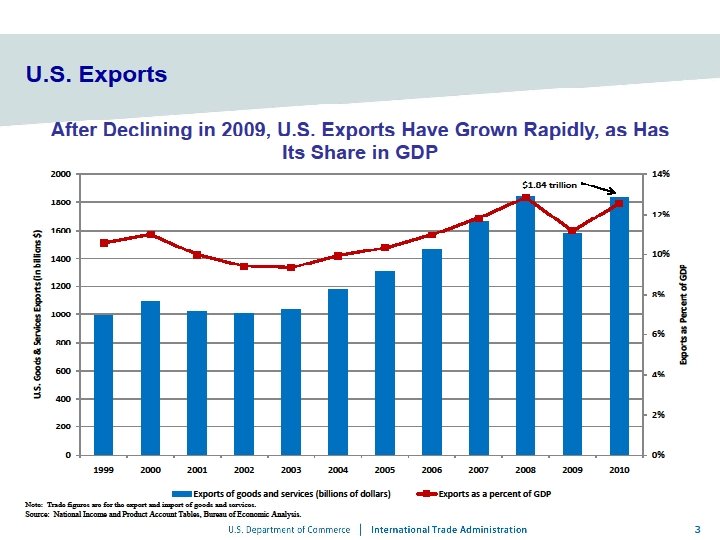
U. S. GDP and Trade Nominal $$ billions Year GDP Total Exports Total Imports 1995 7, 415 794 891 2000 9, 952 1, 073 1, 450 2005 12, 623 1, 287 1, 996 2006 13, 377 1, 459 2, 213 2007 14, 028 1, 655 2, 351 2008 14, 291 1, 843 2, 541 2009 13, 939 1, 575 1, 956 2010 14, 526 1, 837 2, 337 2011 15, 075 2, 103 2, 663 www. bea. gov
Top U. S. Trade Partners Total Trade: Exports Plus Imports Rank by Exports( US $--billions) 2000 2001 2002 2003 2004 2005 2006 2007 2008 2009 2010 2011 Canada 410 381 371 394 445 499 533 566 600 431 527 596 Mexico 247 233 232 236 267 290 332 347 367 306 393 461 China 116 122 147 181 231 285 343 384 408 366 457 503 Japan 211 184 173 170 184 193 207 206 204 147 181 195 Germany 88 89 89 97 109 119 130 143 152 114 130 148 UK 85 82 74 77 82 90 98 107 172 93 98 107 S Korea 65 51 51 49 56 57 78 82 33 68 88 100 France 50 50 47 46 53 56 61 68 73 60 65 68 http: //www. census. gov/foreign-trade/balance
Trade with Canada, 2011 in billions of dollars 1 -Digit SITC Commodity Exports Imports 19. 7 17. 4 1 Beverages and Tobacco 1. 4 0. 85 2 Crude Materials, Inedible, except Fuels 8. 2 11. 8 18. 3 101. 9 0. 6 1. 2 5 Chemicals and Related Products, N. E. S. 32. 4 28. 1 6 Manufactured Goods Classified Chiefly by Material 38. 7 40. 4 7 Machinery and Transport Equipment 124. 6 83. 3 8 Miscellaneous Manufactured Articles 29. 2 13. 2 9 Commodities and Transactions, N. E. S. 7. 7 16. 3 280. 8 314. 5 0 Food and Live Animals 3 Mineral Fuels, Lubricants and Related Materials 4 Animal and Vegetable Oils, Fats and Waxes * TOTAL * tse. export. gov
Trade with Mexico, 2011 1 -Digit SITC Commodityin billions of dollars Exports Imports 0 Food and Live Animals 13. 7 14. 0 1 Beverages and Tobacco 0. 6 2. 8 2 Crude Materials, Inedible, except Fuels 7. 3 1. 9 3 Mineral Fuels, Lubricants and Related Materials 23. 6 44. 0 4 Animal and Vegetable Oils, Fats and Waxes 0. 9 0. 07 5 Chemicals and Related Products, N. E. S. 23. 5 4. 8 6 Manufactured Goods Classified Chiefly by Material 25. 0 19. 0 7 Machinery and Transport Equipment 84. 0 139. 5 8 Miscellaneous Manufactured Articles 13. 8 24. 5 9 Commodities and Transactions, N. E. S. 6. 2 12. 4 198. 6 263. 0 * TOTAL * tse. export. gov
1 -Digit SITC Commodity Trade with China, 2011 in billions of dollars Exports Imports 0 Food and Live Animals 4. 9 5. 6 1 Beverages and Tobacco 0. 2 0. 04 2 Crude Materials, Inedible, except Fuels 32. 3 1. 9 3 Mineral Fuels, Lubricants and Related Materials 2. 0 0. 5 4 Animal and Vegetable Oils, Fats and Waxes 0. 2 0. 04 5 Chemicals and Related Products, N. E. S. 14. 4 13. 9 6 Manufactured Goods Classified Chiefly by Material 5. 4 42. 4 7 Machinery and Transport Equipment 36. 4 202. 0 8 Miscellaneous Manufactured Articles 7. 1 128. 9 9 Commodities and Transactions, N. E. S. 1. 0 4. 2 103. 9 399. 5 * TOTAL * tse. export. gov
Imports of Goods by Principal End-Use Category 2011 Other Goods, 3% Consumer Goods, 27% Foods, Feeds, & Beverages, 4% Industrial Supplies, 24% Automotive Vehicles, etc. , 13% Capital Goods, 29%
Exports of Goods by Principal End-Use Category 2011 Consumer Goods, 13% Other Goods, 3% Foods, Feeds, & Beverages, 6% Industrial Supplies, 27% Automotive Vehicles, etc. , 10% Capital Goods, 41%
U. S. Services Imports 2011 Direct Defense Expenditures, 7% Travel, 19% Passenger Fares, 7% Other Private Services, 45% Other Transportation, 13% Royalties & License Fees, 9%
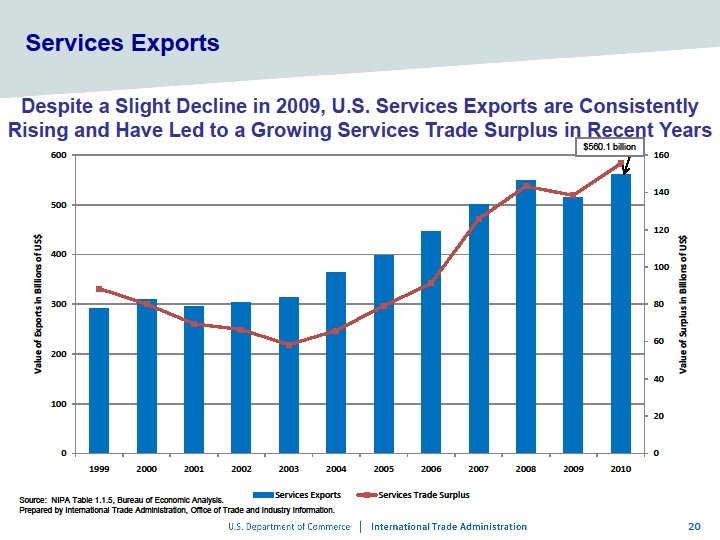
U. S. Services Exports 2011 Transfers Under U. S. Military Sales Contracts, 3% Travel, 19% Passenger Fares, 6% Other Private Services, 45% Other Transportation 7% Royalties & License Fees, 20%
U. S. Balance of Payments 2008 ($ billions) Current Account -706. 0 Merchandise trade balance -695. 9 Goods & Services exports 1, 826. 6 Goods & Services imports -2, 522. 5 Net Transfers -128. 3 Net Income Payments 118. 2 Capital Account Increase in U. S. holdings of foreign assets Increase in Foreign holdings of U. S. assets Statistical Discrepancy http: bea. gov +706. 0 -106 505, 166 +200
Sources of U. S. Imports 2011 Africa, 1% South and Central America, 8% All Others, 3% Pacific Rim, 9% OPEC, 9% Japan, 6% EU, 17% China, 18% Other Europe, 4% Canada, 14% Mexico, 12%
Destinations of U. S. Exports 2011 Africa, 2% South and Central America, 11% All Others, 4% Pacific Rim, 13% OPEC, 4% Japan, 4% China, 7% EU, 18% Other Europe, 4% Mexico, 13% Canada, 19%
U. S. Goods Trade Balance With Other Nations, 2011 ($US - billions) Country Exports Imports Trade Balance Canada 281 315 -34 Mexico 198 263 -65 China 104 399 -295 Japan 66 129 -63 Germany 49 99 -50 EU 268 368 -100 Taiwan 26 41 -15 South Korea 43 57 -14 France 28 40 -12 http: //www. census. gov/foreign-trade/balance/
U. S. Balance of Payments 2011 ($ millions) Current Account Goods & Services exports Goods 1, 497, 406; -465, 926 2, 103, 367 Services 605, 961 Goods & Services imports -2, 663, 247 Goods -2, 235, 819; Services -427, 428 Net Transfers Net Income Payments Capital Account U. S. Owned Assets Abroad Foreign Owned Assets in the U. S. Capital Transactions Statistical Discrepancy http: bea. gov -133, 053 227, 007 +465, 926 -483, 653 1, 009, 900 -1, 212 -89, 208
Destinations of U. S. Foreign Direct Investment 2011 (percent) Sources of Foreign Direct Investment in the United States 2011 (percent) United Kingdom 13 United Kingdom 17 Canada 8 Japan* 11 Netherlands 14 Netherlands 9 Japan 3 Germany 8 Germany 3 France 8 Australia 3 Canada 8 Switzerland 3 Switzerland 8 Bermuda 8 Luxembourg 7 France 2 http: //bea. gov **2008
Statistical Comparison of NAFTA Countries, 1997 (In current U. S. $$) Population (millions) GDP (billions U. S. $) GDP per capita Exports (billions $) Imports (billions $) Canada 29. 9 637. 5 21, 260 250. 6 238. 5 Mexico 95. 4 401. 4 4, 207 121. 6 122. 4 U. S. 272. 6 8, 265. 0 30, 282 934. 8 1, 042. 7 Statistical Comparison of NAFTA Countries, 2011 (In current U. S. $$) Population (millions) GDP (billions U. S. $) GDP per capita Exports (billions $) Imports (billion $) Canada 34. 5 1, 736. 0 50, 345 539. 1 561. 9 Mexico 114. 8 1, 153. 3 10, 047 365. 2 380. 6 U. S. 311. 6 14, 991. 3 48, 112 2, 105 2, 665. 0 http: //web. worldbank. org
Hourly Compensation Costs for Workers in Manufacturing, Selected Countries, 2011 (current dollars) Labor Costs (in $ U. S. ) United States Canada France Germany Italy Japan United Kingdom Korea Mexico Singapore Philippines 35. 53 36. 56 42. 12 47. 38 36. 17 35. 71 30. 77 18. 91 6. 48 22. 60 2. 01 v www. bls. gov