Tracing water sources and greenhouse gases using fieldbased

Tracing water sources and greenhouse gases using field-based stable isotope techniques Niels Crosley Munksgaard

Overview: 1. Stable isotopes What are they? How do we measure them? 2. Oxygen and Hydrogen isotopes in water Tracing the hydrological cycle Agricultural water use 3. Carbon isotopes in Carbon Dioxide and Methane Tracing greenhouse gas emissions

Stable isotopes • Physical and chemical properties vary slightly between isotopes • Example: H 218 O has lower vapour pressure than H 216 O • Isotopes ‘fractionate’ between different compounds or physical forms • Example: water vapour has a lower 18 O/16 O ratio than liquid water • Example: CO 2 respired from grasses and trees have different 13 C/12 C ratios • H 2 O and CO 2 carry isotopic ‘fingerprints’ and can be traced from their source

Isotope analysis The future: The past: Laboratory bound mass spectrometry Specialist staff required Discrete samples only Laser spectroscopy Mobile, field capable Simple operation Continuous analysis Advantage: Greater temporal and spatial resolution at reduced cost

Field-based isotope measurements

Overview: 1. Stable isotopes What are they? How do we measure them? 2. Oxygen and Hydrogen isotopes in water Tracing the hydrological cycle Agricultural water use 3. Carbon isotopes in Carbon Dioxide and Methane Tracing greenhouse gas emissions

Tracing water sources Moisture Source Rainfall Soil water Groundwater Rivers Vegetation

O- and H-isotopes in the water cycle

Annual O-isotope composition of precipitation Meteo cycle

…but event-based and seasonal variations in O- and H-isotope composition of rainfall are large discrete events can be traced in the hydrological cycle !
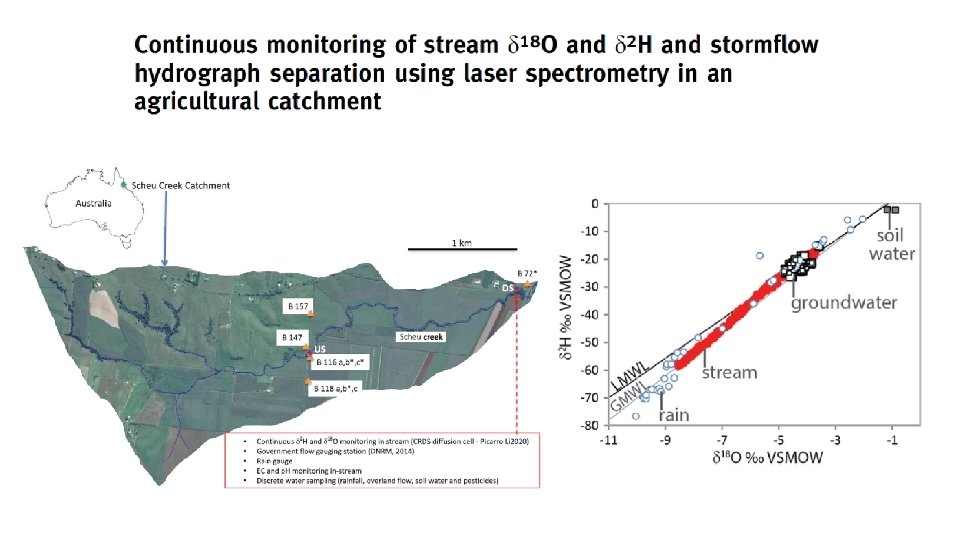

Hydrograph separation of storm flow

Plant transpired H 2 O has δ 18 O ≈ δ 18 O soil H 2 O Air inlet tower Isotope analyser Soil evaporated H 2 O has δ 18 O < δ 18 O soil H 2 O (liquid-vapour fractionation)

Overview: 1. Stable isotopes What are they? How do we measure them? 2. Oxygen and Hydrogen isotopes in water Tracing the hydrological cycle Agricultural water use 3. Carbon isotopes in Carbon Dioxide and Methane Tracing greenhouse gas emissions
")
Mobile detection of methane using an isotope spectrometer Greenhouse gasses Gas Concentration Warming (ppm) factor (100 yr) Warming contribution CO 2 ≈400 1 ≈9 -26% CH 4 ≈2 25 ≈4 -9% N 2 O ≈0. 3 298 ?

Measurement of 13 C/12 C in CH 4 helps distinguish coal seam and microbial (farming) gas sources
 Soil respiration Leaf respiration")
Accounting for natural emissions: soil and plant respiration (CO 2) Soil respiration Leaf respiration

CO 2 emissions from two forest systems measured using a mobile isotope spectrometer interfaced with GPS CO 2 ppm Eucalypt d 13 C CO 2 Eucalypt Rainforest / Eucalyptus transition, 40 km forest track (2 hours), continuous measurement integrated at 2 min intervals

Conclusions - relevance to remote area monitoring: • Laser spectroscopy allows field-based isotope analysis of water and greenhouse gasses • High temporal and spatial resolution - reactive sampling/analysis - low cost • Highly versatile instruments – can interface with project-specific sampling modules CDU’s present capabilities in field-based stable isotope analyses: 1. Continuous analysis of 2 H/1 H and 18 O/16 O in water vapour, rainfall, river water, seawater… 2. Continuous analysis of 13 C/12 C isotope ratio in CO 2 – including analysis of CO 2 and CH 4 concentration
- Slides: 19