Tracing Network Packets in the Linux Kernel using
![Example [root@rch tracing]# cat trace_pipe <idle>-0 [004]. . s 1 39090. 808233: 0: ----PACKET Example [root@rch tracing]# cat trace_pipe <idle>-0 [004]. . s 1 39090. 808233: 0: ----PACKET](https://slidetodoc.com/presentation_image_h2/da2226c1e4cca957819a57d2c5c41bf0/image-9.jpg)
- Slides: 16

Tracing Network Packets in the Linux Kernel using e. BPF Mark Kovalev Software Engineering Department Saint Petersburg State University SYRCo. SE 2020

Problem • • Modern networking systems troubleshooting is a complex process Problems arise even within individual nodes Exclusion method debugging => high cost of the troubleshooting Kernel code analysis as a last resort • How a certain traffic is processed by the network stack? • What part of the network stack could posses a source of the malfunction? 2/13

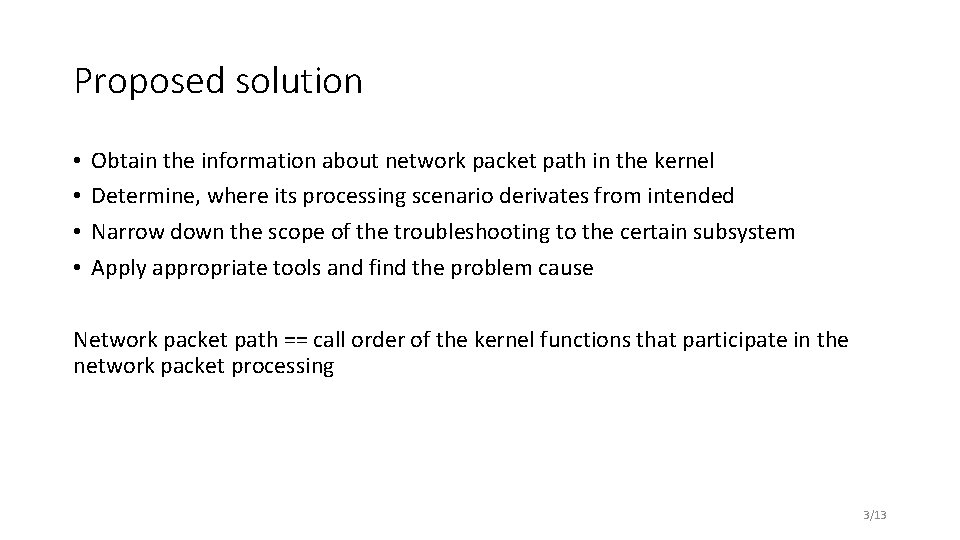
Proposed solution • • Obtain the information about network packet path in the kernel Determine, where its processing scenario derivates from intended Narrow down the scope of the troubleshooting to the certain subsystem Apply appropriate tools and find the problem cause Network packet path == call order of the kernel functions that participate in the network packet processing 3/13

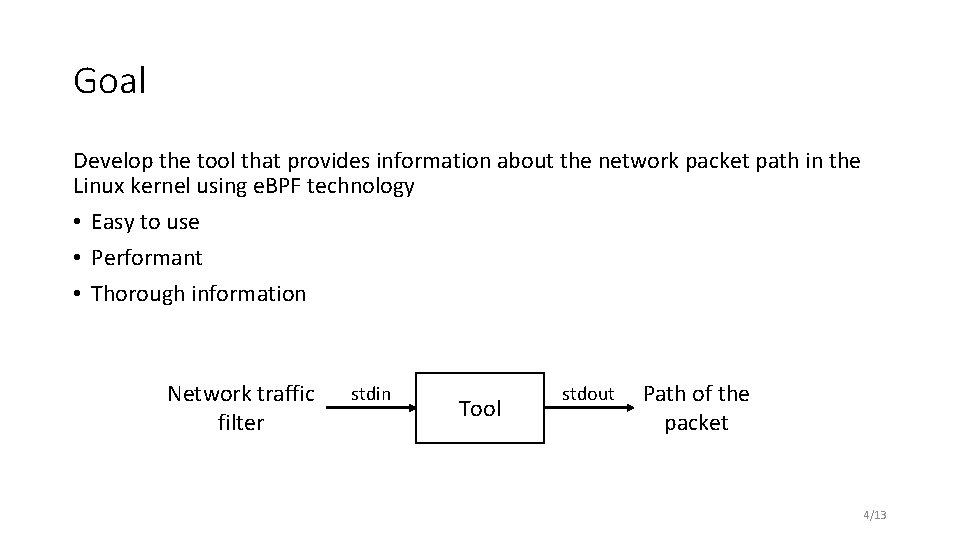
Goal Develop the tool that provides information about the network packet path in the Linux kernel using e. BPF technology • Easy to use • Performant • Thorough information Network traffic filter stdin Tool stdout Path of the packet 4/13

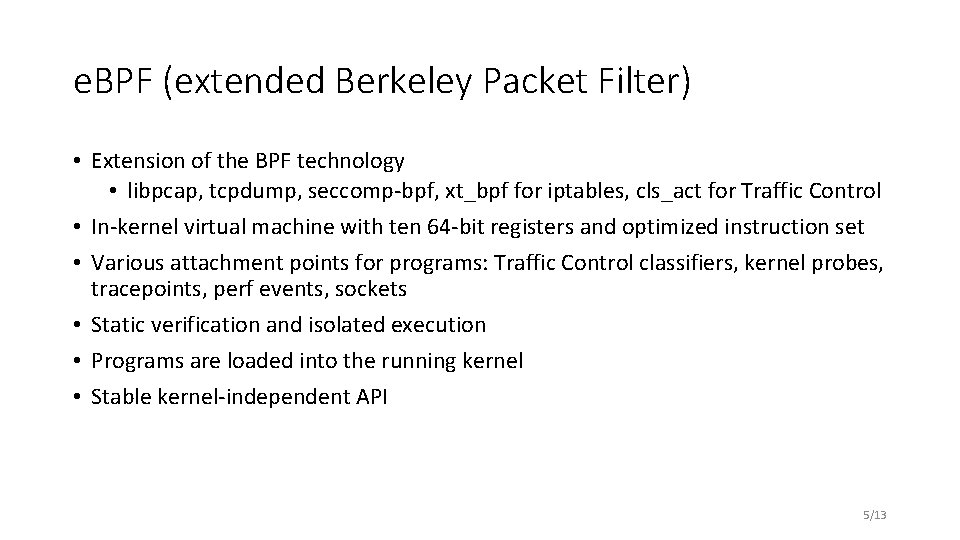
e. BPF (extended Berkeley Packet Filter) • Extension of the BPF technology • libpcap, tcpdump, seccomp-bpf, xt_bpf for iptables, cls_act for Traffic Control • In-kernel virtual machine with ten 64 -bit registers and optimized instruction set • Various attachment points for programs: Traffic Control classifiers, kernel probes, tracepoints, perf events, sockets • Static verification and isolated execution • Programs are loaded into the running kernel • Stable kernel-independent API 5/13

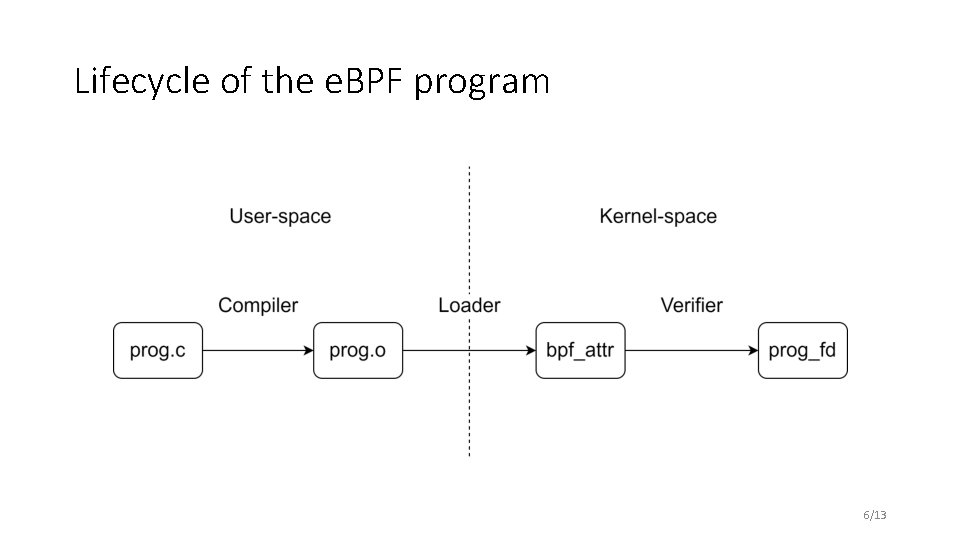
Lifecycle of the e. BPF program 6/13

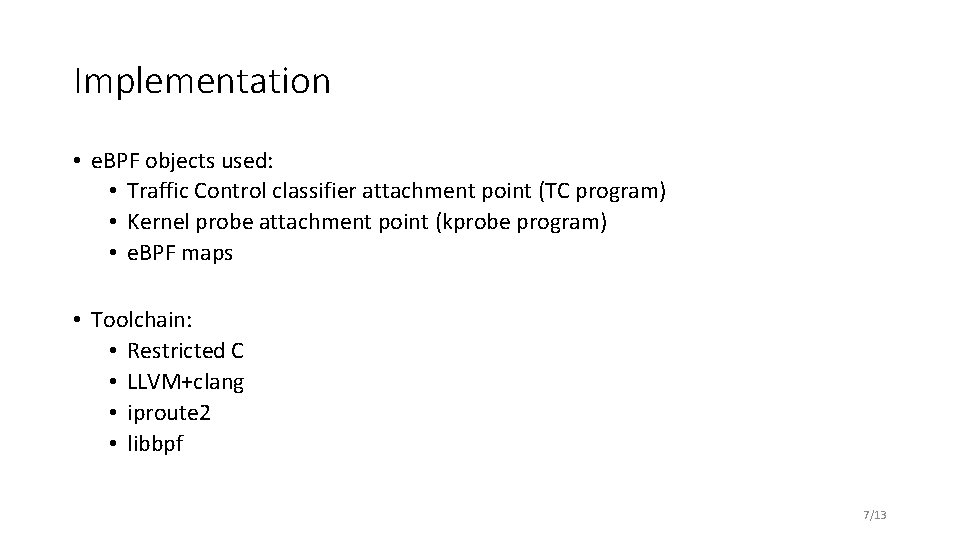
Implementation • e. BPF objects used: • Traffic Control classifier attachment point (TC program) • Kernel probe attachment point (kprobe program) • e. BPF maps • Toolchain: • Restricted C • LLVM+clang • iproute 2 • libbpf 7/13

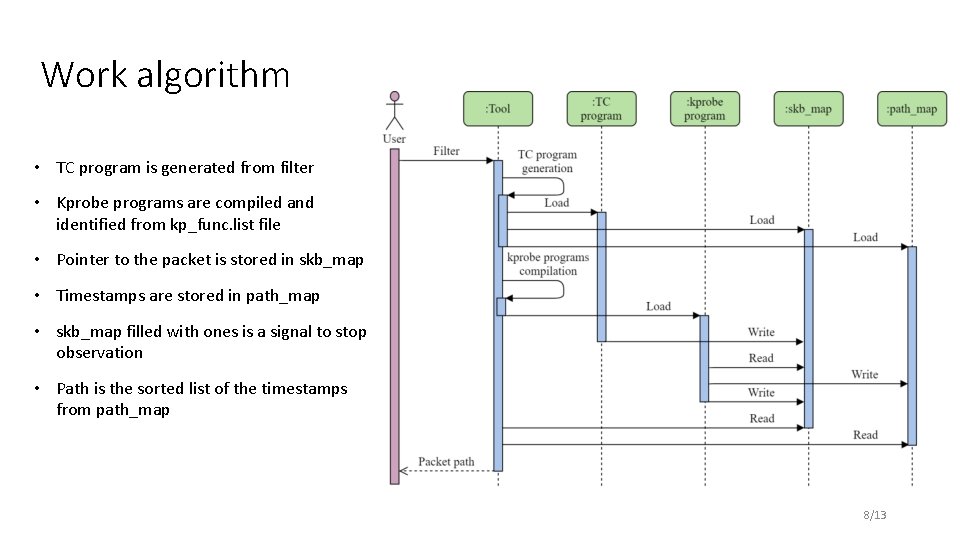
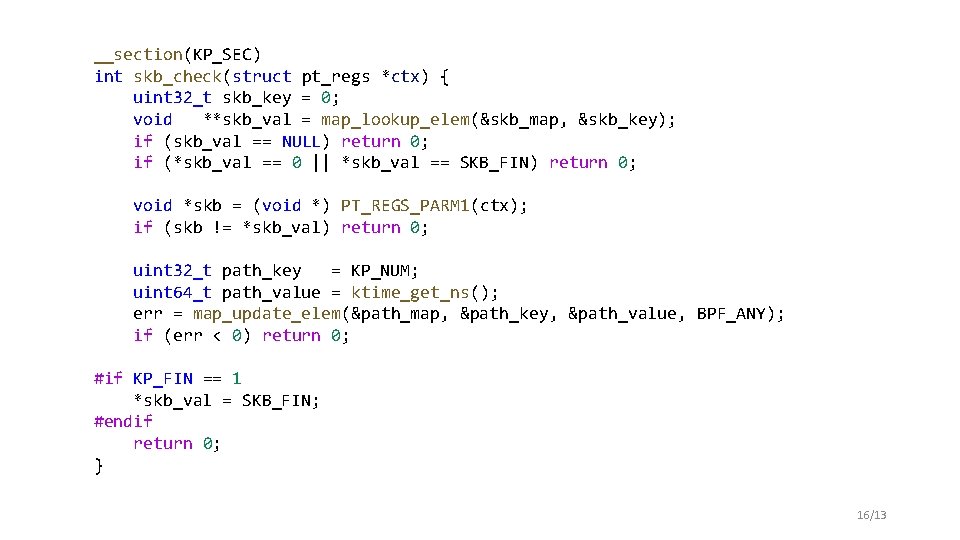
Work algorithm • TC program is generated from filter • Kprobe programs are compiled and identified from kp_func. list file • Pointer to the packet is stored in skb_map • Timestamps are stored in path_map • skb_map filled with ones is a signal to stop observation • Path is the sorted list of the timestamps from path_map 8/13
![Example rootrch tracing cat tracepipe idle0 004 s 1 39090 808233 0 PACKET Example [root@rch tracing]# cat trace_pipe <idle>-0 [004]. . s 1 39090. 808233: 0: ----PACKET](https://slidetodoc.com/presentation_image_h2/da2226c1e4cca957819a57d2c5c41bf0/image-9.jpg)
Example [root@rch tracing]# cat trace_pipe <idle>-0 [004]. . s 1 39090. 808233: 0: ----PACKET MATCH-------<idle>-0 [004]. . s 1 39090. 808255: 0: __netif_receive_skb_core: 39090666105243 <idle>-0 [004]. . s 4 39090. 808262: 0: nf_ip_checksum: 39090666113535 <idle>-0 [004]. . s 4 39090. 808264: 0: nf_ct_get_tuple: 39090666115546 <idle>-0 [004]. . s 4 39090. 808270: 0: ipt_do_table: 39090666121667 <idle>-0 [004]. . s 4 39090. 808279: 0: ip_local_deliver: 39090666130170 <idle>-0 [004]. . s 4 39090. 808280: 0: ipt_do_table: 39090666130862 <idle>-0 [004]. . s 4 39090. 808281: 0: ipt_do_table: 39090666132058 <idle>-0 [004]. . s 4 39090. 808289: 0: nf_confirm: 39090666139780 <idle>-0 [004]. . s 4 39090. 808294: 0: icmp_rcv: 39090666144997 <idle>-0 [004]. . s 4 39090. 808345: 0: consume_skb: 39090666195327 9/13

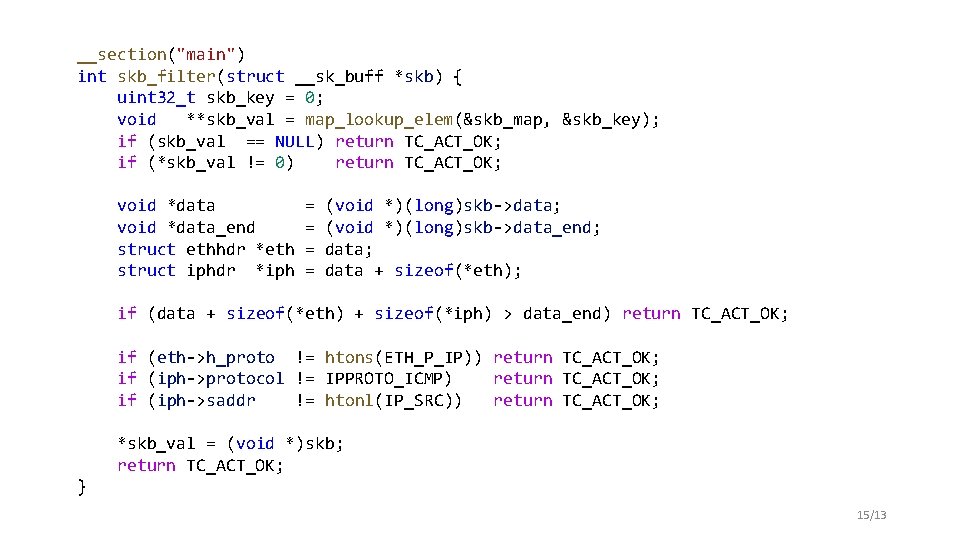
Implementation details • Packet filtration happens only once • TC program filters packet • kprobe programs compare pointers • Programs have different contexts • __sk_buff for TC • pt_regs for kprobe • BCC (BPF Compiler Collection) is not used • full implementation control • low footprint • List of probed functions could be easily changed • portability • ability to add custom functions 10/13

Similar functionality • VMware Traceflow • Part of the VMware NSX Data Center for v. Sphere platform • High-level observation of the whole network • ftrace • Can trace packet path if traffic is isolated • tcpdrop • Part of the BCC • Shows stack trace of the functions that led to the packet drop 11/13

Current state and future work 1. The TC program is static and can trace incoming ICMP, TCP, or UDP. 2. The kprobe programs are compiled manually. 3. Packet path is observed via /sys/kernel/debug/tracing/trace_pipe file. To reach an MVP state for the tool, the following things are to be implemented: 1. TC program generation. 2. Kprobe programs compilation automatization. 3. Bash-based tool that links all components and provides user interface. 12/13

Points of consideration • Amount of the kprobe programs. • Troubleshooting comparison with and without the tool. • Use of the tracepoints as a more stable kernel API. 13/13

14/13

__section("main") int skb_filter(struct __sk_buff *skb) { uint 32_t skb_key = 0; void **skb_val = map_lookup_elem(&skb_map, &skb_key); if (skb_val == NULL) return TC_ACT_OK; if (*skb_val != 0) return TC_ACT_OK; void *data_end struct ethhdr *eth struct iphdr *iph = = (void *)(long)skb->data; (void *)(long)skb->data_end; data + sizeof(*eth); if (data + sizeof(*eth) + sizeof(*iph) > data_end) return TC_ACT_OK; if (eth->h_proto != htons(ETH_P_IP)) return TC_ACT_OK; if (iph->protocol != IPPROTO_ICMP) return TC_ACT_OK; if (iph->saddr != htonl(IP_SRC)) return TC_ACT_OK; *skb_val = (void *)skb; return TC_ACT_OK; } 15/13

__section(KP_SEC) int skb_check(struct pt_regs *ctx) { uint 32_t skb_key = 0; void **skb_val = map_lookup_elem(&skb_map, &skb_key); if (skb_val == NULL) return 0; if (*skb_val == 0 || *skb_val == SKB_FIN) return 0; void *skb = (void *) PT_REGS_PARM 1(ctx); if (skb != *skb_val) return 0; uint 32_t path_key = KP_NUM; uint 64_t path_value = ktime_get_ns(); err = map_update_elem(&path_map, &path_key, &path_value, BPF_ANY); if (err < 0) return 0; #if KP_FIN == 1 *skb_val = SKB_FIN; #endif return 0; } 16/13