
Trace Gas Retrievals from the Geo TASO Aircraft

- Slides: 15
Trace Gas Retrievals from the Geo. TASO Aircraft Instrument during DISCOVER-AQ Caroline Nowlan, Xiong Liu, Cheng Liu, Gonzalo Gonzalez Abad, Kelly Chance Harvard-Smithsonian Center for Astrophysics, Cambridge, MA James Leitch, Joshua Cole, Tom Delker, Bill Good, Frank Murcray, Lyle Ruppert, Dan Soo Ball Aerospace, Boulder, CO Chris Loughner, Melanie Follette-Cook, Scott Janz, Matt Kowalewski, Ken Pickering NASA GSFC, Greenbelt, MD
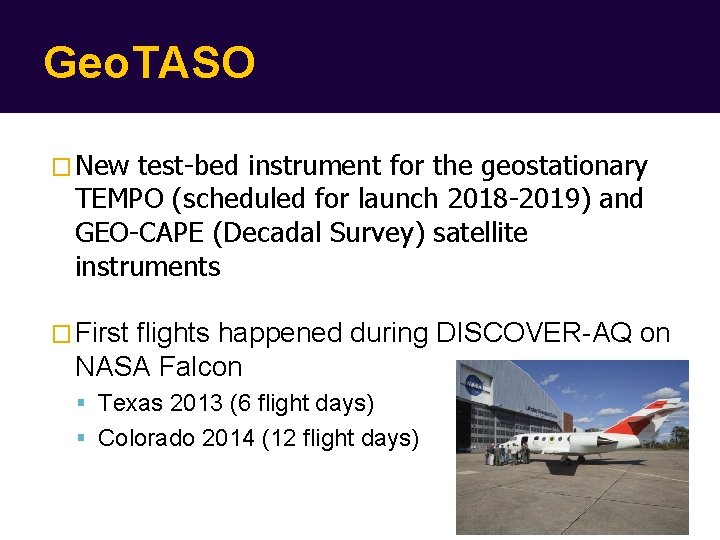
Geo. TASO � New test-bed instrument for the geostationary TEMPO (scheduled for launch 2018 -2019) and GEO-CAPE (Decadal Survey) satellite instruments � First flights happened during DISCOVER-AQ on NASA Falcon Texas 2013 (6 flight days) Colorado 2014 (12 flight days)
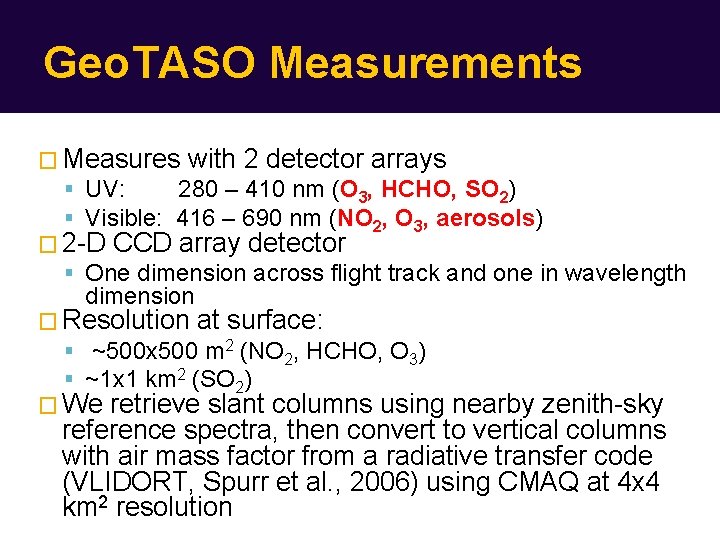
Geo. TASO Measurements � Measures with 2 detector arrays UV: 280 – 410 nm (O 3, HCHO, SO 2) Visible: 416 – 690 nm (NO 2, O 3, aerosols) � 2 -D CCD array detector One dimension across flight track and one in wavelength dimension � Resolution at surface: ~500 x 500 m 2 (NO 2, HCHO, O 3) ~1 x 1 km 2 (SO 2) � We retrieve slant columns using nearby zenith-sky reference spectra, then convert to vertical columns with air mass factor from a radiative transfer code (VLIDORT, Spurr et al. , 2006) using CMAQ at 4 x 4 km 2 resolution
Current Status � Texas campaign: NO 2 vertical columns available UV radiance calibration needs refinement � Colorado campaign: NO 2 and SO 2 slant columns available for 4 of 12 days To come: Ozone profiles, NO 2 vertical columns, HCHO, more flights to process � First Houston data should be up on DISCOVERAQ data archive by the end of May. � Contact: cnowlan@cfa. harvard. edu
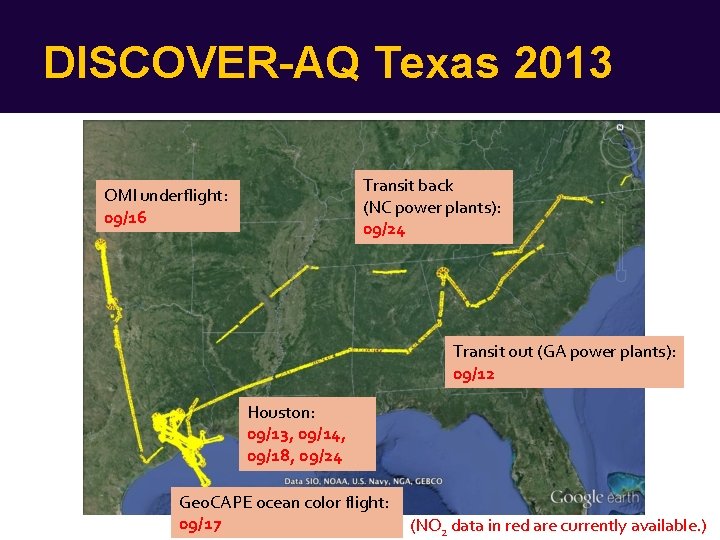
DISCOVER-AQ Texas 2013 Transit back (NC power plants): 09/24 OMI underflight: 09/16 Transit out (GA power plants): 09/12 Houston: 09/13, 09/14, 09/18, 09/24 Geo. CAPE ocean color flight: 09/17 (NO 2 data in red are currently available. )
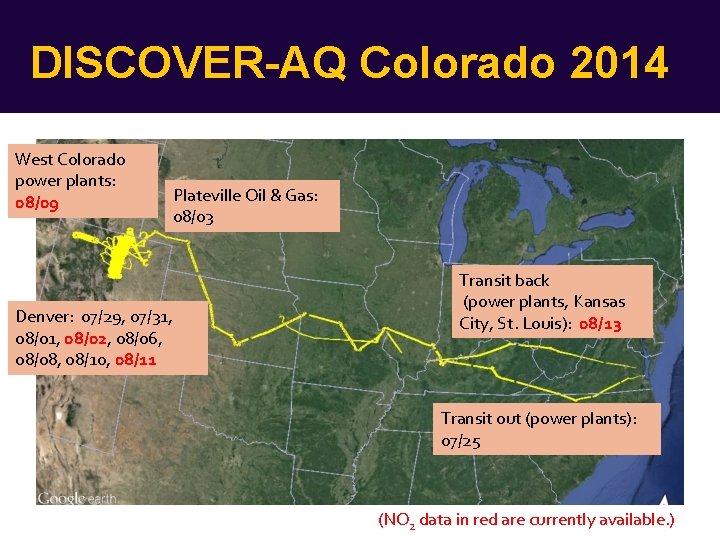
DISCOVER-AQ Colorado 2014 West Colorado power plants: 08/09 Denver: 07/29, 07/31, 08/02, 08/06, 08/08, 08/10, 08/11 Plateville Oil & Gas: 08/03 Transit back (power plants, Kansas City, St. Louis): 08/13 Transit out (power plants): 07/25 (NO 2 data in red are currently available. )
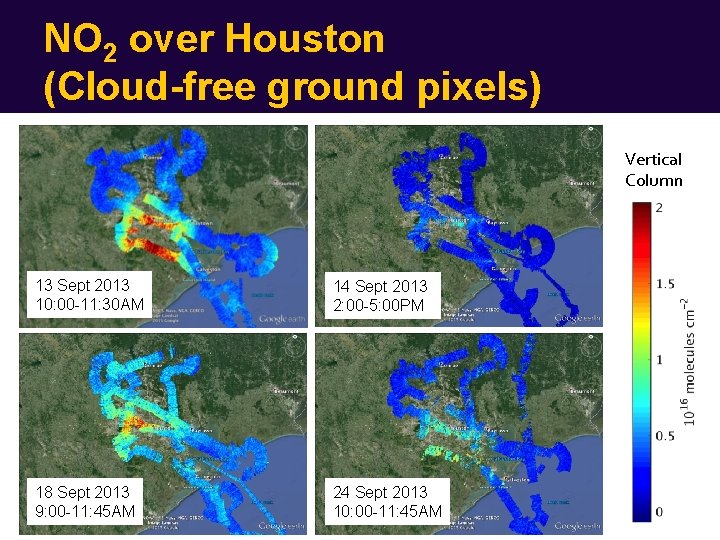
NO 2 over Houston (Cloud-free ground pixels) Vertical Column 13 Sept 2013 10: 00 -11: 30 AM 14 Sept 2013 2: 00 -5: 00 PM 18 Sept 2013 9: 00 -11: 45 AM 24 Sept 2013 10: 00 -11: 45 AM
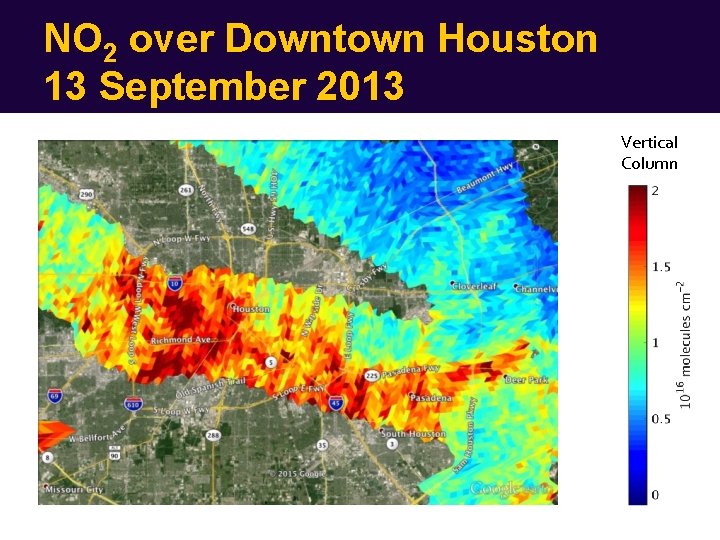
NO 2 over Downtown Houston 13 September 2013 Vertical Column
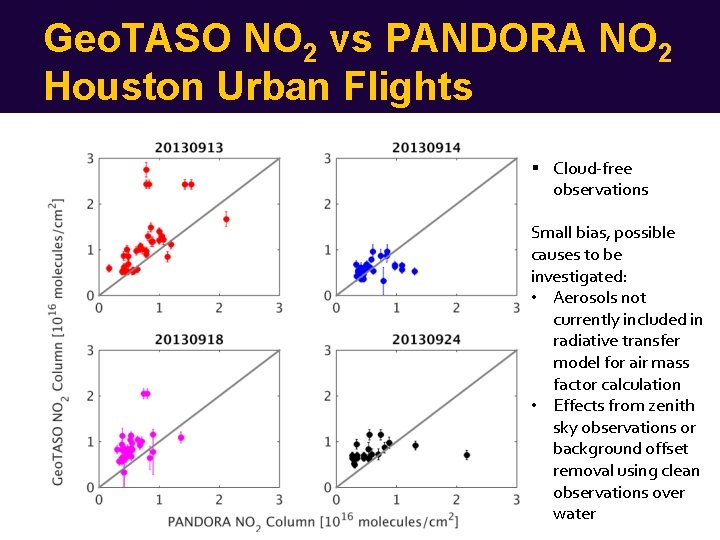
Geo. TASO NO 2 vs PANDORA NO 2 Houston Urban Flights Cloud-free observations Small bias, possible causes to be investigated: • Aerosols not currently included in radiative transfer model for air mass factor calculation • Effects from zenith sky observations or background offset removal using clean observations over water
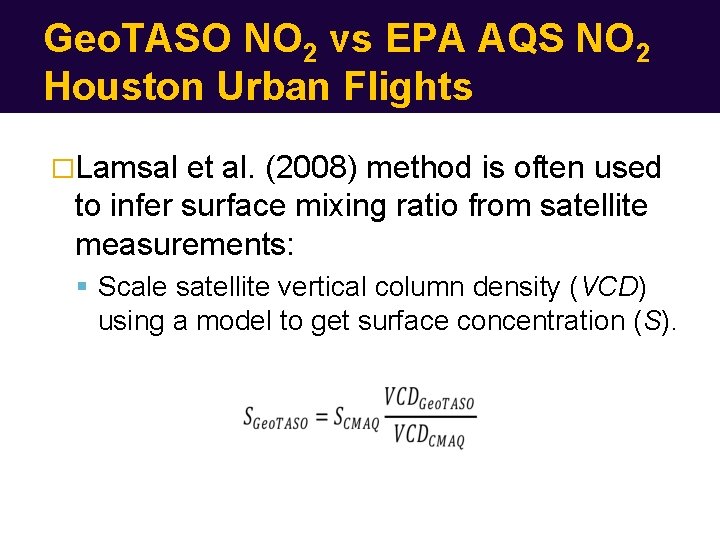
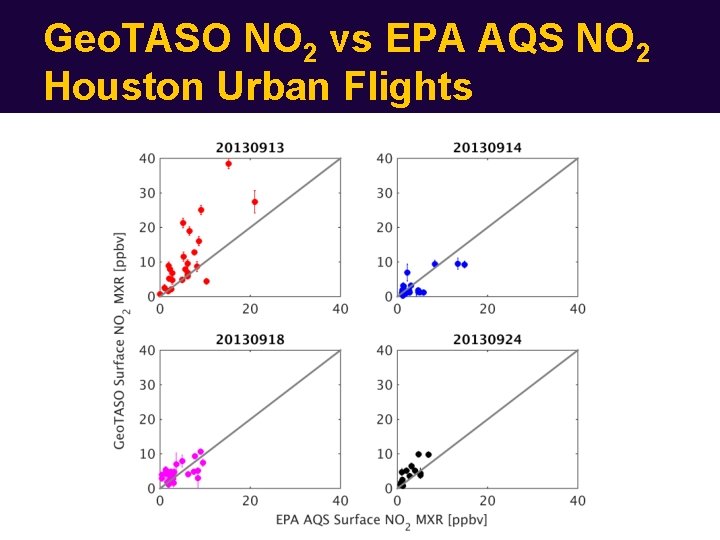
Geo. TASO NO 2 vs EPA AQS NO 2 Houston Urban Flights �Lamsal et al. (2008) method is often used to infer surface mixing ratio from satellite measurements: Scale satellite vertical column density (VCD) using a model to get surface concentration (S).
Geo. TASO NO 2 vs EPA AQS NO 2 Houston Urban Flights
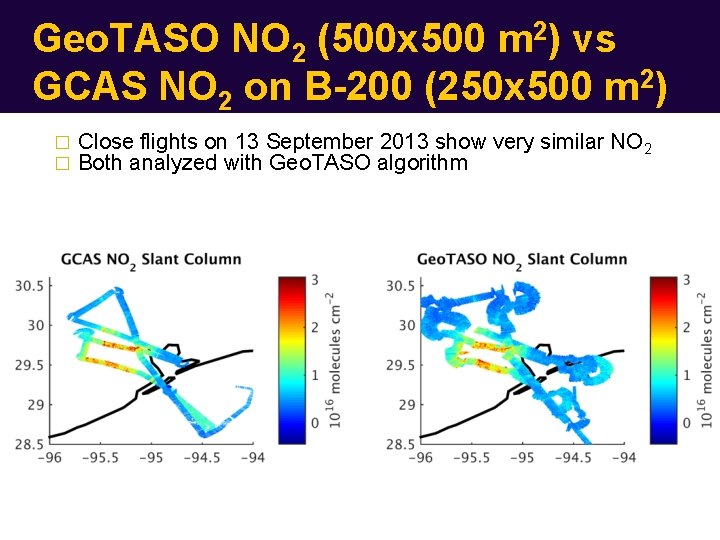
Geo. TASO NO 2 (500 x 500 m 2) vs GCAS NO 2 on B-200 (250 x 500 m 2) � � Close flights on 13 September 2013 show very similar NO 2 Both analyzed with Geo. TASO algorithm
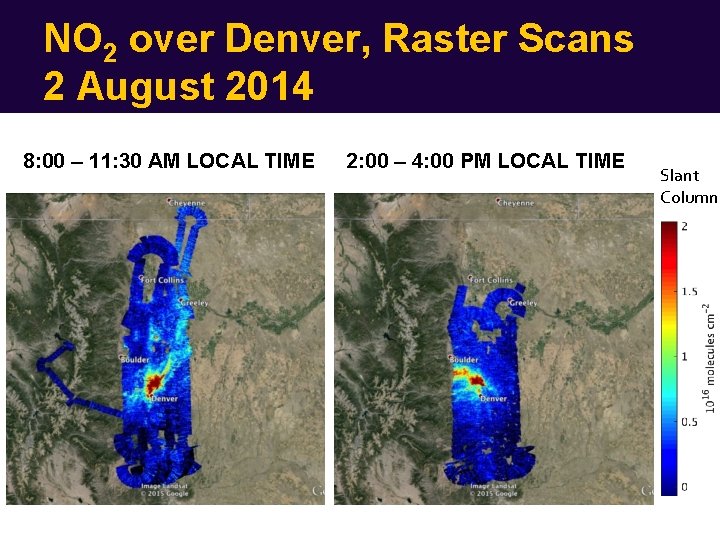
NO 2 over Denver, Raster Scans 2 August 2014 8: 00 – 11: 30 AM LOCAL TIME 2: 00 – 4: 00 PM LOCAL TIME Slant Column
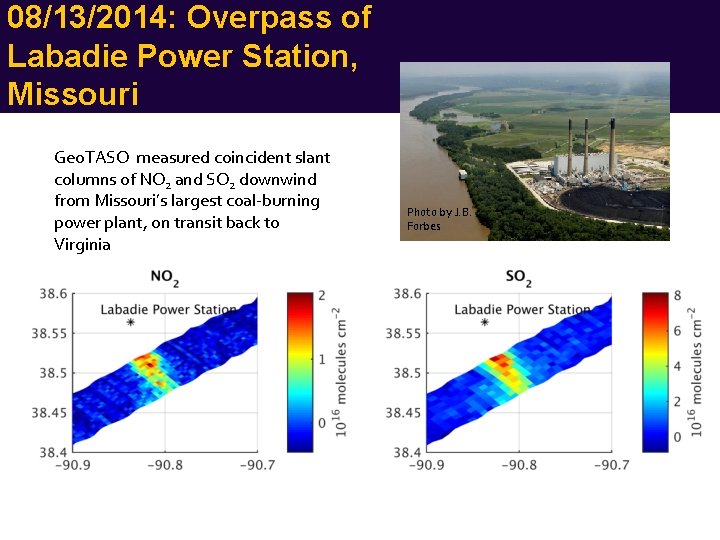
08/13/2014: Overpass of Labadie Power Station, Missouri Geo. TASO measured coincident slant columns of NO 2 and SO 2 downwind from Missouri’s largest coal-burning power plant, on transit back to Virginia Photo by J. B. Forbes
Future Work � O 3 profile work in preparation for TEMPO mission � Formaldehyde retrieval optimization � Aerosol sensitivities in air mass factor � Process rest of Colorado data � Improvements to UV calibration for Houston campaign � Comparisons with GCAS, P-3 B and satellites � Responsibility for Geo. TASO transferring this year from Ball Aerospace to NASA Goddard (Scott Janz)