
Trace and Logs analysis Elastic Search Kibana Plotly
Trace and Logs analysis Elastic Search, Kibana, Plotly, … Anurag Prakash, Cyrus Sadeghi, Alex Young and Peter Pieda Dec 2018 Copyright © Ciena Corporation 2018. All rights reserved.
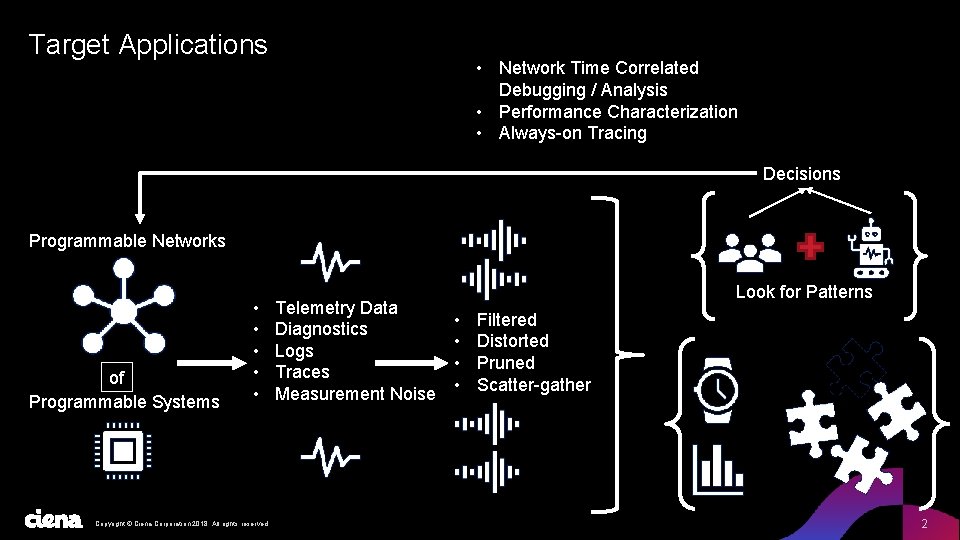
Target Applications • Network Time Correlated Debugging / Analysis • Performance Characterization • Always-on Tracing Decisions Programmable Networks of Programmable Systems • • • Copyright © Ciena Corporation 2018. All rights reserved. Telemetry Data Diagnostics Logs Traces Measurement Noise Look for Patterns • • Filtered Distorted Pruned Scatter-gather 2
Key Solution Requirements Logging Ø Easily added to large pre-existing on-box code base Ø Conversion of existing logging to any new logging system must be largely an automated operation Ø Off-box tools scalable to large networks with 100’s of Network Elements Ø Simple and fast enough to be practical for debugging on very small development systems Ø Support seek and filter Copyright © Ciena Corporation 2018. All rights reserved. 3
Performance analysis Ø Ø Does not require a special load build (resident in a disabled state in all loads) Minimal impact when enabled Bottleneck analysis Benchmark & Comparative analysis Copyright © Ciena Corporation 2018. All rights reserved. 4
Always-on Tracing Ø Analysis/Playback of field issues without needing to reproduce them Ø Several hours of trace buffer (time between issues occurrence and data collection) Ø Strict constraints on performance and size Ø always-on without sacrificing system performance Ø Capability to render a message or state sequence from a running system Copyright © Ciena Corporation 2018. All rights reserved. 5
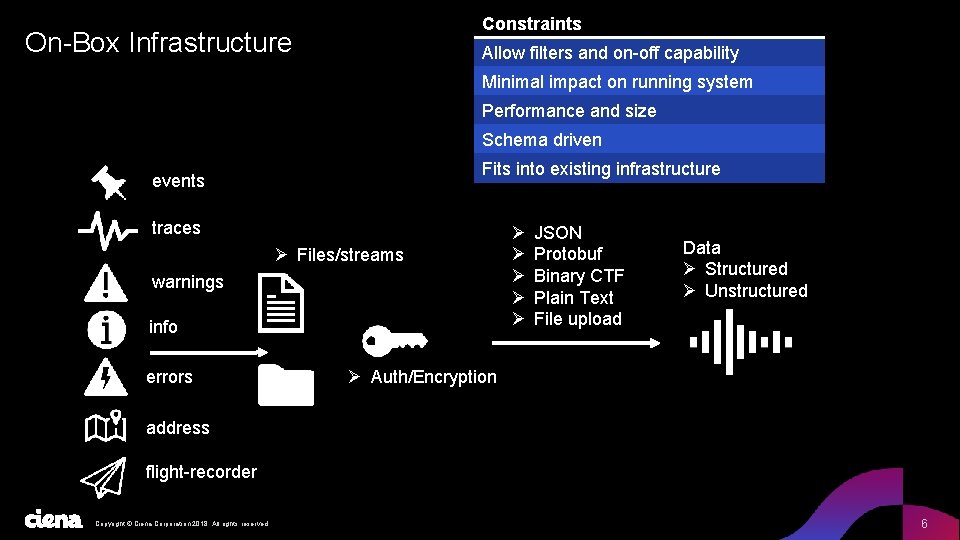
Constraints On-Box Infrastructure Allow filters and on-off capability Minimal impact on running system Performance and size Schema driven Fits into existing infrastructure events traces Ø Files/streams warnings info errors Ø Ø Ø JSON Protobuf Binary CTF Plain Text File upload Data Ø Structured Ø Unstructured Ø Auth/Encryption address flight-recorder Copyright © Ciena Corporation 2018. All rights reserved. 6
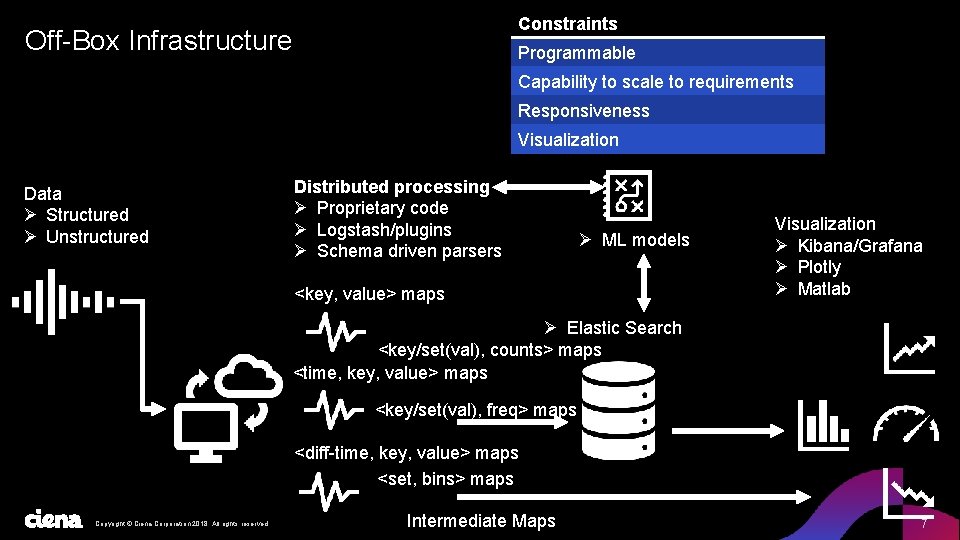
Constraints Off-Box Infrastructure Programmable Capability to scale to requirements Responsiveness Visualization Data Ø Structured Ø Unstructured Distributed processing Ø Proprietary code Ø Logstash/plugins Ø Schema driven parsers Ø ML models <key, value> maps Visualization Ø Kibana/Grafana Ø Plotly Ø Matlab Ø Elastic Search <key/set(val), counts> maps <time, key, value> maps <key/set(val), freq> maps <diff-time, key, value> maps <set, bins> maps Copyright © Ciena Corporation 2018. All rights reserved. Intermediate Maps 7

X-axis: Time Y-axis: utilization (ms) Traces: threads or unique trace-backs Trace data Ø Performance characterization with scale Threads utilization(ms) over time x 4 cpu Function calls(ms) cpu: 0 Function calls(ms) cpu: 1 Copyright © Ciena Corporation 2018. All rights reserved. 8
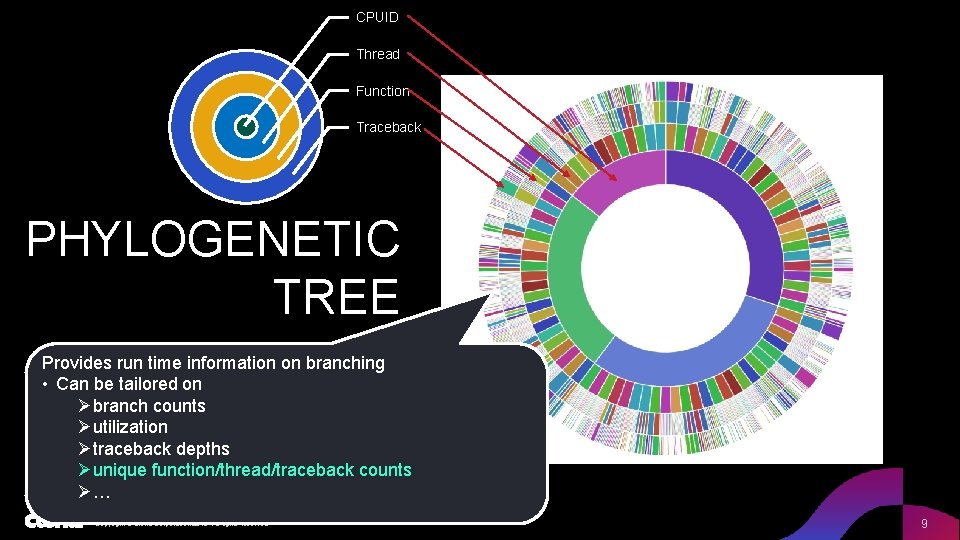
CPUID Thread Function Traceback PHYLOGENETIC TREE Provides run time information on branching • Can be tailored on Øbranch counts Øutilization Øtraceback depths Øunique function/thread/traceback counts Ø… Copyright © Ciena Corporation 2018. All rights reserved. 9
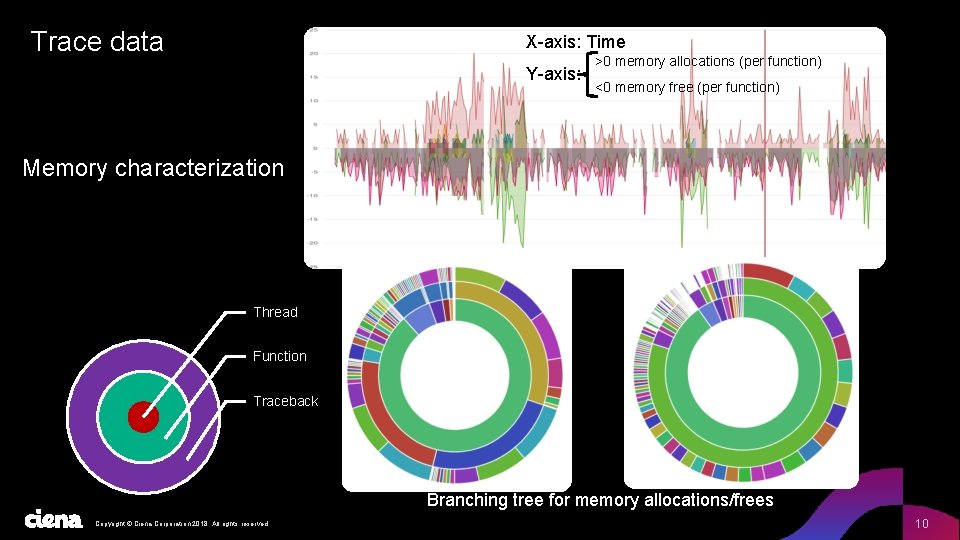
Trace data X-axis: Time Y-axis: >0 memory allocations (per function) <0 memory free (per function) Memory characterization Thread Function Traceback Branching tree for memory allocations/frees Copyright © Ciena Corporation 2018. All rights reserved. 10
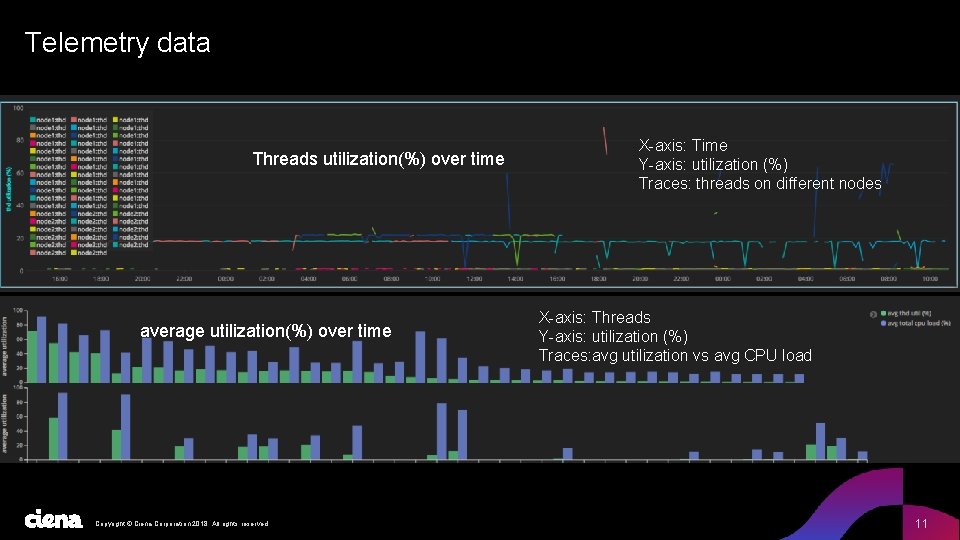
Telemetry data Threads utilization(%) over time average utilization(%) over time Copyright © Ciena Corporation 2018. All rights reserved. X-axis: Time Y-axis: utilization (%) Traces: threads on different nodes X-axis: Threads Y-axis: utilization (%) Traces: avg utilization vs avg CPU load 11
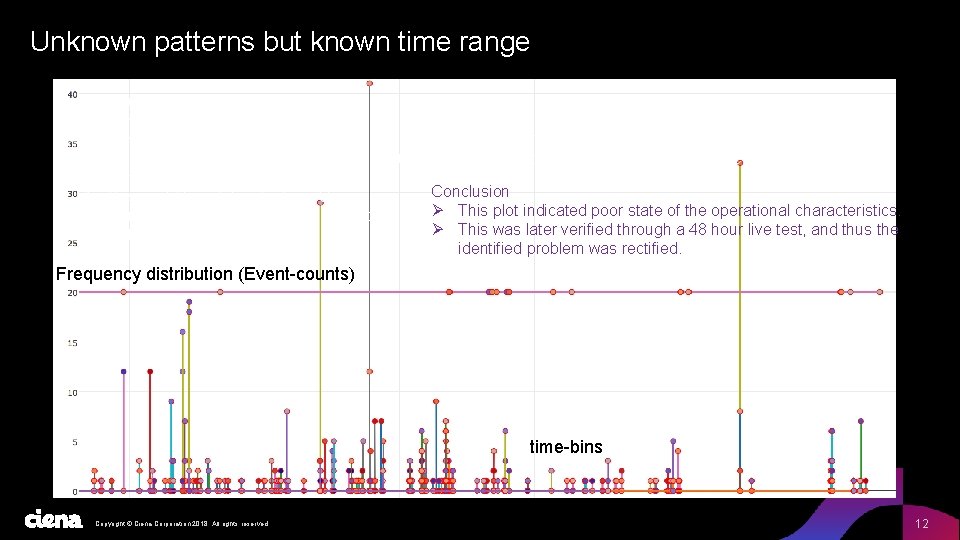
Unknown patterns but known time range Ø Data to be used from the network Ø Data is analyzed in following schemas Ø local node Ø Time domain <time, key, value> Ø multiple nodes Ø Frequency domain <diff-time, key, value, counts> Ø Usually try to take unknown patterns to find a Ø Topology constraints < filter, key, value> common or related threads Conclusion Ø This could translate into Time Series Ø This plot indicated poor state of the operational characteristics. correlation followed by “g/re/p” for known Ø This was later verified through a 48 hour live test, and thus the patterns. identified problem was rectified. Frequency distribution (Event-counts) time-bins Copyright © Ciena Corporation 2018. All rights reserved. 12
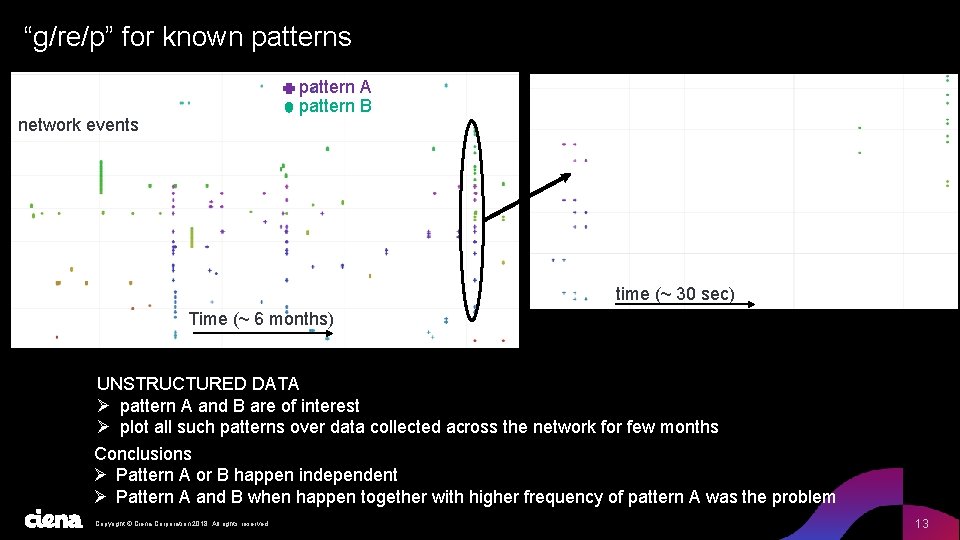
“g/re/p” for known patterns pattern A pattern B network events time (~ 30 sec) Time (~ 6 months) UNSTRUCTURED DATA Ø pattern A and B are of interest Ø plot all such patterns over data collected across the network for few months Conclusions Ø Pattern A or B happen independent Ø Pattern A and B when happen together with higher frequency of pattern A was the problem Copyright © Ciena Corporation 2018. All rights reserved. 13
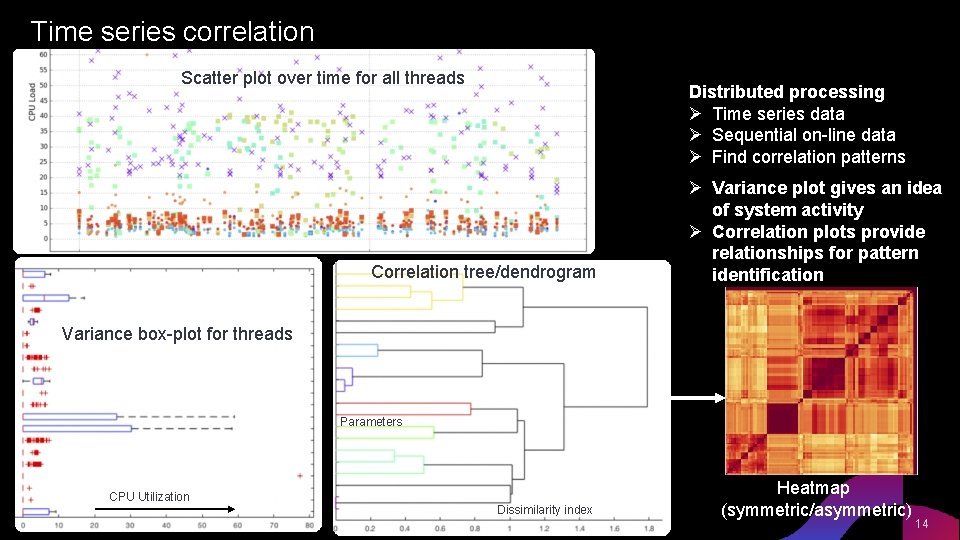
Time series correlation Scatter plot over time for all threads Distributed processing Ø Time series data Ø Sequential on-line data Ø Find correlation patterns Correlation tree/dendrogram Ø Variance plot gives an idea of system activity Ø Correlation plots provide relationships for pattern identification Variance box-plot for threads Parameters CPU Utilization Copyright © Ciena Corporation 2018. All rights reserved. Dissimilarity index Heatmap (symmetric/asymmetric) 14
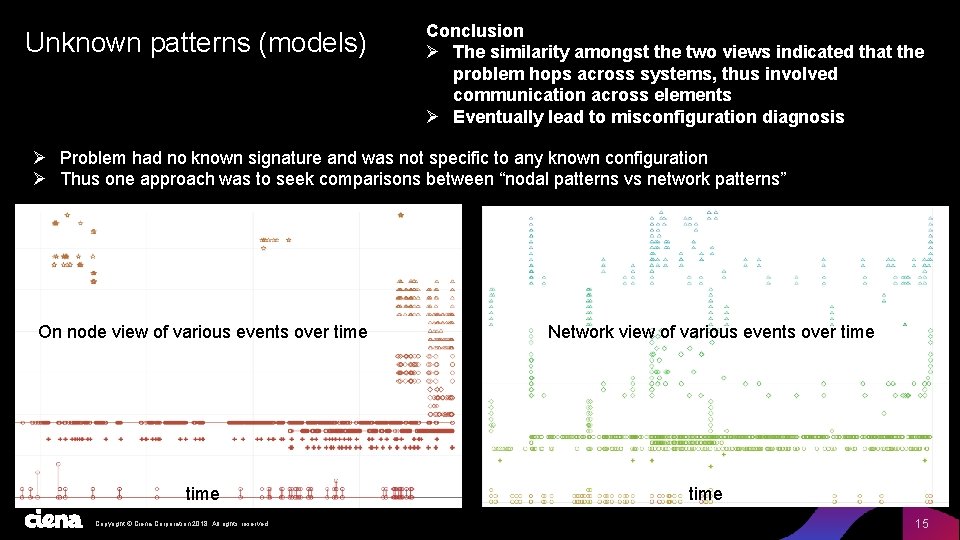
Unknown patterns (models) Conclusion Ø The similarity amongst the two views indicated that the problem hops across systems, thus involved communication across elements Ø Eventually lead to misconfiguration diagnosis Ø Problem had no known signature and was not specific to any known configuration Ø Thus one approach was to seek comparisons between “nodal patterns vs network patterns” On node view of various events over time Copyright © Ciena Corporation 2018. All rights reserved. Network view of various events over time 15
Future Ø Make existing infrastructure user friendly and faster for routine jobs Ø Keep gathering and benchmarking the always-on tracing data Ø Build and test new ML models on existing infrastructure Copyright © Ciena Corporation 2018. All rights reserved. 16
Questions ? Copyright © Ciena Corporation 2018. All rights reserved. 17
Thank You Copyright © Ciena Corporation 2018. All rights reserved. 18
- Slides: 18