Tower Flux Measurement and Analysis Landscapelevel Eddy Covariance
 Measurement of CO 2 and Other")


 Plant")


 Mead, Nebraska")

 and Gross Primary Productivity (GPP) Reday = NEEnight * Q 10")
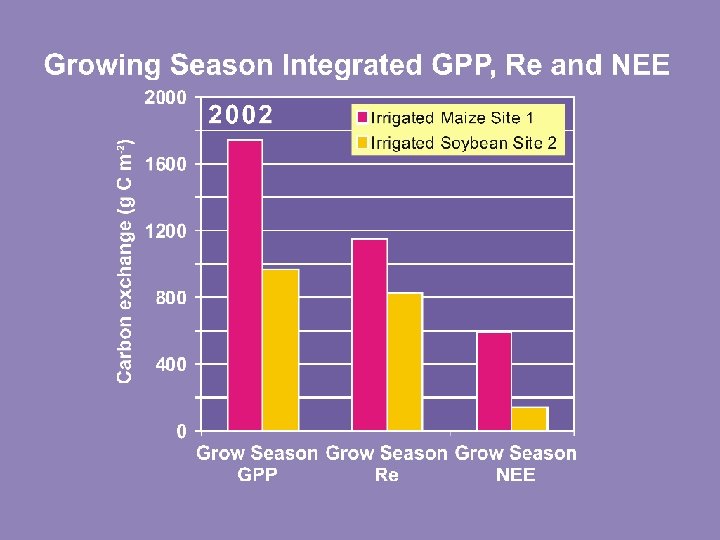
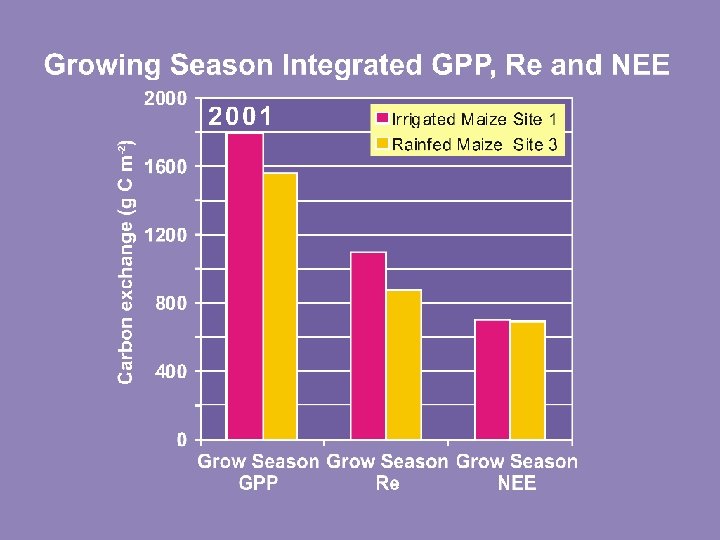
 Maize, NE 300 to 500 (Verma et")


 • Soil surface CO 2 flux measurements (Fs) – Two")


- Slides: 31
Tower Flux Measurement and Analysis Landscape-level (Eddy Covariance) Measurement of CO 2 and Other Fluxes Close-up of Eddy Covariance Flux Sensors Measuring Components of Solar Radiation Verma/Indo. Flux_July 2006
Outline • Background information/ methodology • Flux magnitudes: seasonal/ interannual variations • Controlling variables • Comments
Objectives • Quantify CO 2 exchange in major ecosystems: seasonal and interannual variability • Improve our basic understanding of biophysical processes that govern CO 2 exchange in these ecosystems • Test and improve terrestrial biosphere models of CO 2, water, and energy exchange
Partitioning of Carbon in Agroecosystems Landscape Level Carbon Dioxide Flux (uptake and release) Plant photosynthesis Plant respiration Above ground productivity Soil respiration Root productivity Root and rhizosphere respiration Organic matter decomposition Microbial respiration Root exudates
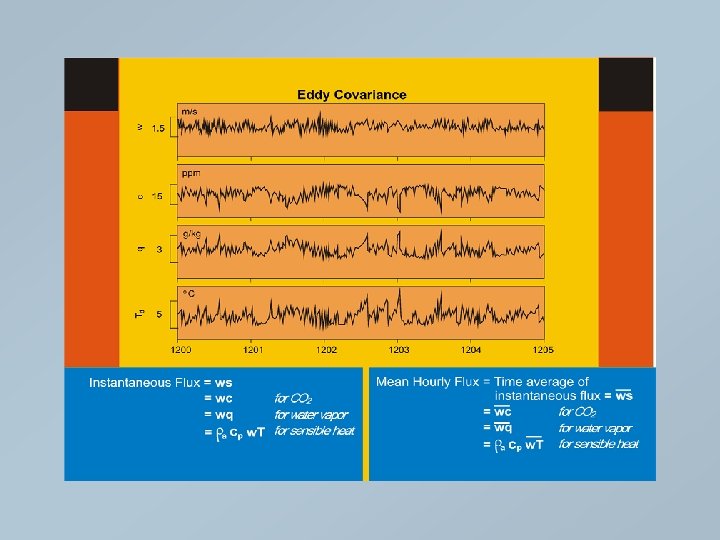
Methodology: Eddy Covariance Fluxes of CO 2, Water Vapor, and Energy: • Continuous Measurements • Long-term • Ecosystem scale/landscape level
Mead, Nebraska
Measurements • • Primary Measurements - Fluxes of CO 2, water vapor, sensible heat & momentum - Mean wind speed, air temperature, humidity and CO 2 concentration - Wind direction - Soil heat flux & soil temperature - Radiation: v Net radiation v Short wave radiation (incoming & reflected) v PAR (incoming & reflected) - Light interception - Atmospheric pressure - Precipitation Supporting Measurements - Soil moisture - Leaf area index, canopy height, biomass - Leaf nitrogen content Data Submission
Tower Eddy Covariance CO 2 Flux Measurements: Net Ecosystem Exchange (NEE) Mead, Nebraska
Daytime CO 2 Uptake and Night Emissions Peak daytime CO 2 uptake (mg m-2 s-1) Peak night CO 2 emission (mg m-2 s-1) Leaf Area Index (LAI) Irrigated maize 2. 8 – 3. 0 0. 6 – 0. 7 5. 6 – 6. 0 Rainfed maize 2. 6 0. 4 – 0. 5 4. 0 Irrigated soybean 1. 7 0. 7 5. 7 Rainfed soybean 1. 5 0. 4 3. 0 Grassland (tallgrass prairie) 1. 2 0. 4 – 0. 5 3. 0 Temperate forest 0. 9 0. 2 – 0. 3 4. 9 Ecosystem
Ecosystem Respiration (Re) and Gross Primary Productivity (GPP) Reday = NEEnight * Q 10 (Ta, day - Ta, night)/10 GPP = NEE - Re
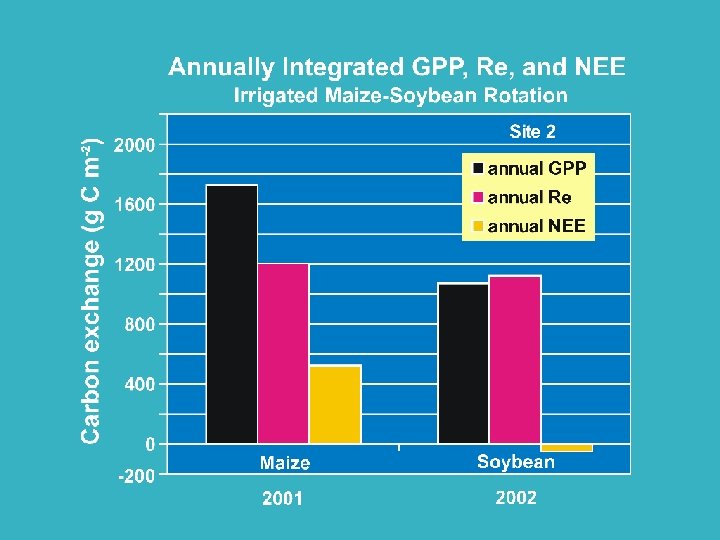
Annually Integrated NEE (g C m-2 y-1) Maize, NE 300 to 500 (Verma et al. , 2005) Harvard Forest, MA 200 (Barford et al. , 2003) Howland Forest, ME 174 (Hollinger et al. , 2004) Univ. of Michigan Biological St 80 to 170 (Schmid et al. , 2003) Wind River, WA -50 to 200 (Pers. Comm. ) Douglas Fir, B. C. 270 to 420 (Morgenstern et al. , 2004) Tallgrass Prairie, OK 50 to 275 (Suyker et al. , 2003) Northern Temperate Grassland, Alberta -18 to 20 (Flanagan et al. , 2002) Mediterranean, Annual Grassland, CA -30 to 130 (Xu and Baldocchi, 2003) Soybean, NE -10 to -75 (Verma et al. , 2005)
Daytime CO 2 Flux Irrigated Maize 4. 0 June 13 -19: July 4 -10: July 18 -24: -2 -1 NEE (mg m s ) 3. 0 V 6 -V 7: 0. 4<LAI<1. 3 V 11 -V 12: 4. 4<LAI<5. 6 V 19 -VT: 6. 2<LAI<6. 3 Aug 29 -Sept 4: 2. 0 R 5: 3. 7<LAI<4. 3 1. 0 0. 0 -1. 0 0 500 1000 1500 -2 -1 Incoming PAR (mmol m s ) 2000
Night CO 2 Flux
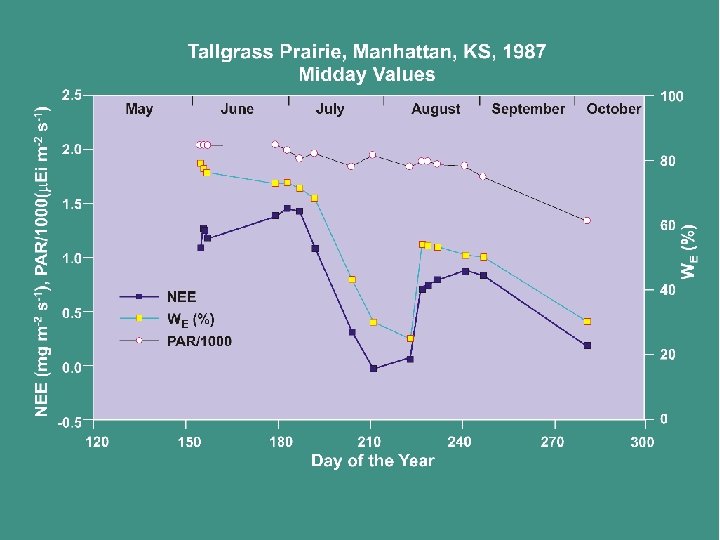
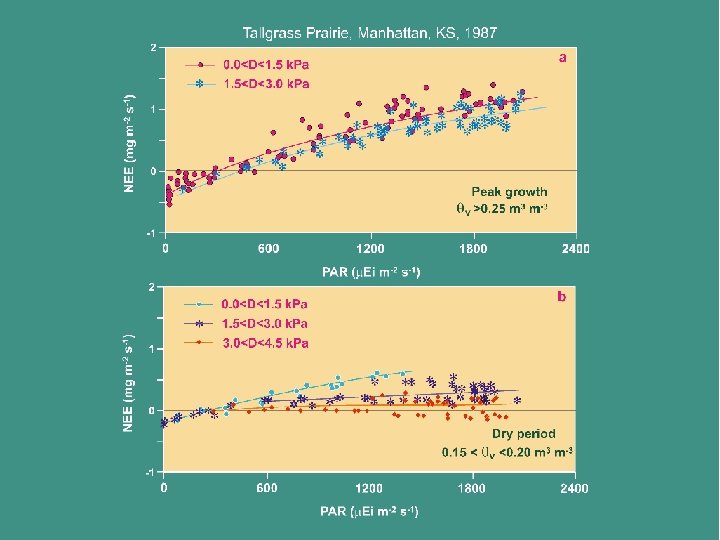
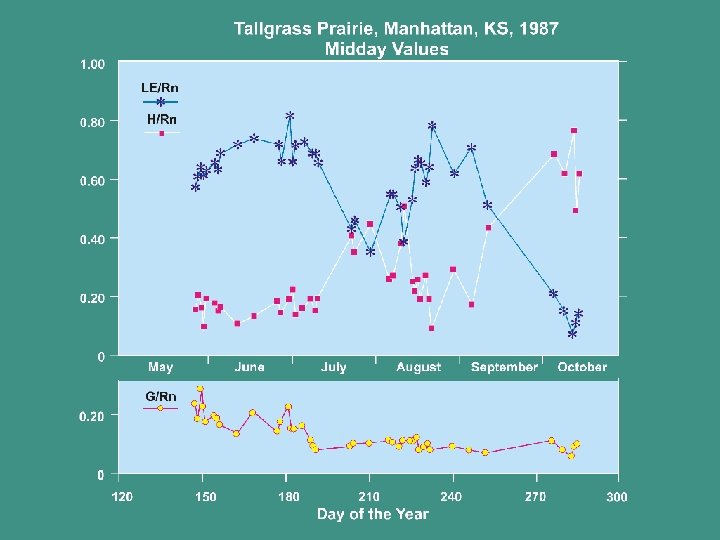
Tallgrass Prairie, Manhattan, KS, 1987
Energy Partitioning Daytime
Energy Partitioning Shidler, Oklahoma
Tallgrass Prairie, Manhattan, KS, 1987
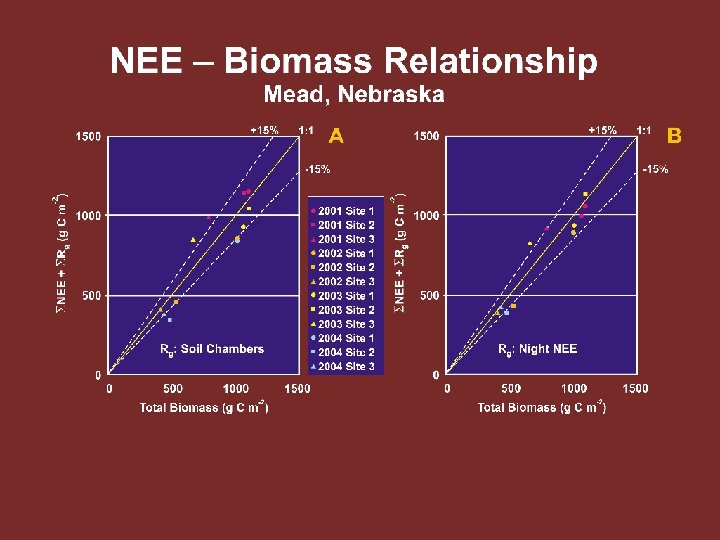
Checks and Balances • Data Quality Control – Foken and Wichura, 1996, Agric. For. Meteorol. , 78, 83 -105 – Aubinet et al. , 2000, Advances in Ecol. Res. , 30, 113 -175 • Energy Budget Closure: LE + H vs. Rn + G • NEE – Biomass Relationship
NEE-Biomass Relationship Day Night NEEday NEEnight Rc Rg Rc Rr Gain of CO 2 by = NEEday – D D crop during day Daily net gain of CO 2 by crop = = ( D Rg Loss of CO 2 by crop at night Rgday Net canopy ( NEEday D– = D ) photosynthesis night in 24 hours NEEday + NEEnight ) – ( Rgday + Rg night ) Daily = NEE N D + Rr Daily Rg N Rgday ) + ( N = N NEE night – N Rc + RNr NEEnight – N night Rg Rg Rc + Rr + Rg = NEEnight (Biscoe et al; 1975. J. Applied Ecology, 12, 269291)
Daily net gain of CO 2 by crop = Daily NEE + Daily Rg NEE = Net ecosystem CO 2 exchange Rg = Respiration by soil organisms (Biscoe et al. , 1975, J. Applied Ecology, 12, 269 -291)
Estimating Microbial Respiration (Rg) • Soil surface CO 2 flux measurements (Fs) – Two different kinds of chambers: ü Model LI-6200, Li-Cor, Lincoln, NE ü Hutchinson & Mosier (1981) type chamber – Used data from field measurements of maize soil respiration in root excluded and non-root excluded soil to estimate Rg • Night NEE data – Adjusted for plant respiration based on leaf gas exchange measurements – Adjusted for night/day temperatures – Applied measurements of root-excluded vs. non-root excluded soil to estimate Rg as mentioned above
Challenges • Insufficient mixing at night • Filling in data gaps • Complex terrain
N 2 O and CH 4 Fluxes