
Towards a Complete Mouse Haplotype Map Mathew Pletcher

- Slides: 22
Towards a Complete Mouse Haplotype Map Mathew Pletcher Genomics Institute of the Novartis Research Foundation
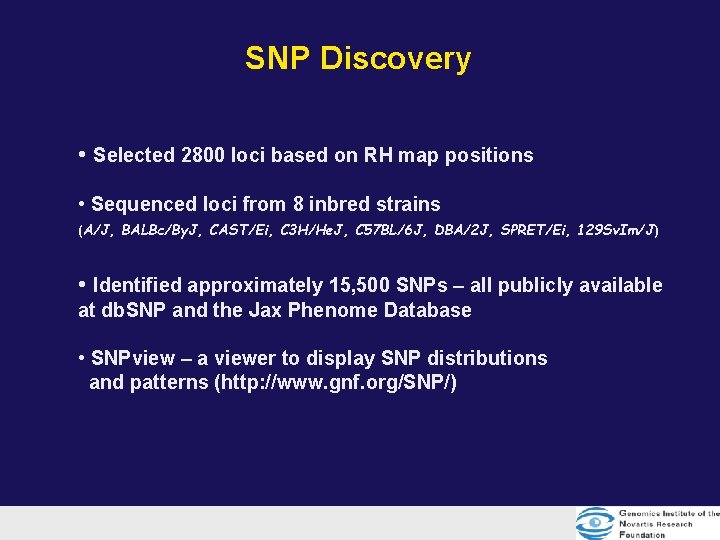
SNP Discovery • Selected 2800 loci based on RH map positions • Sequenced loci from 8 inbred strains (A/J, BALBc/By. J, CAST/Ei, C 3 H/He. J, C 57 BL/6 J, DBA/2 J, SPRET/Ei, 129 Sv. Im/J) • Identified approximately 15, 500 SNPs – all publicly available at db. SNP and the Jax Phenome Database • SNPview – a viewer to display SNP distributions and patterns (http: //www. gnf. org/SNP/)
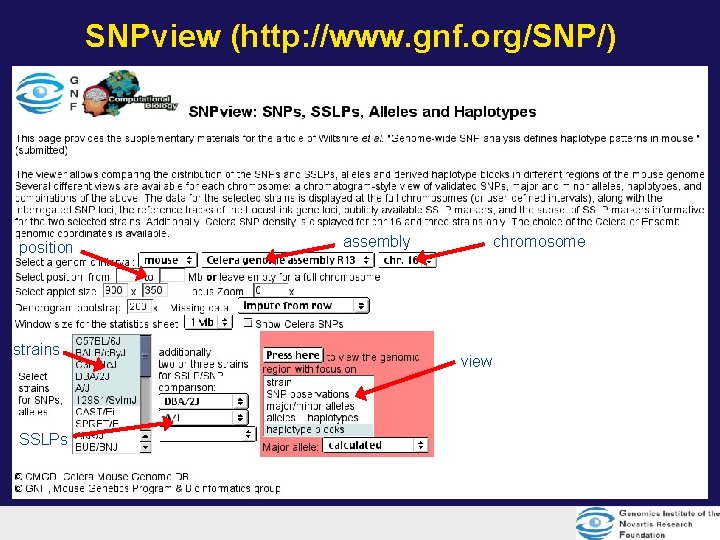
SNPview (http: //www. gnf. org/SNP/) position strains SSLPs assembly chromosome view
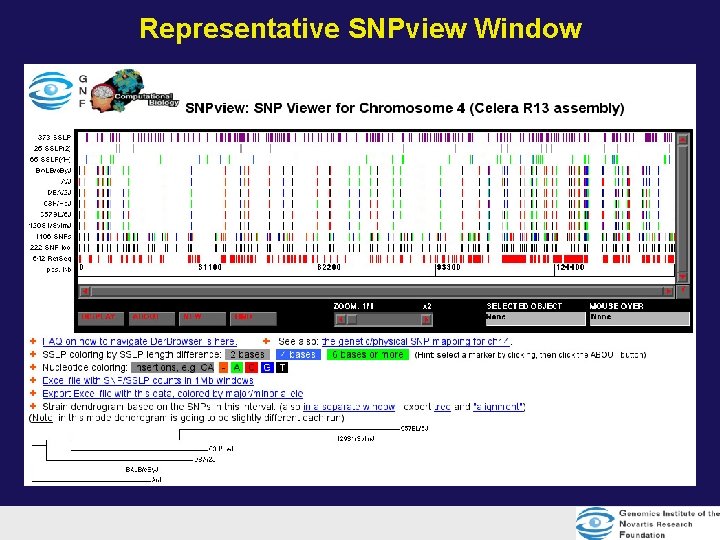
Representative SNPview Window
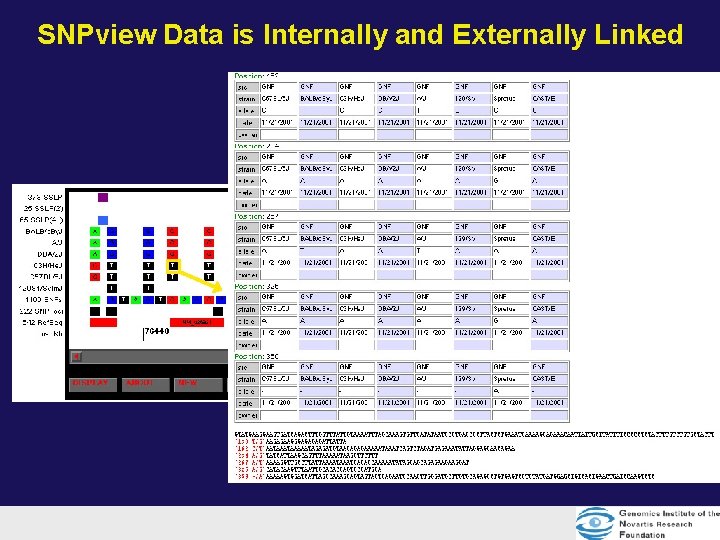
SNPview Data is Internally and Externally Linked
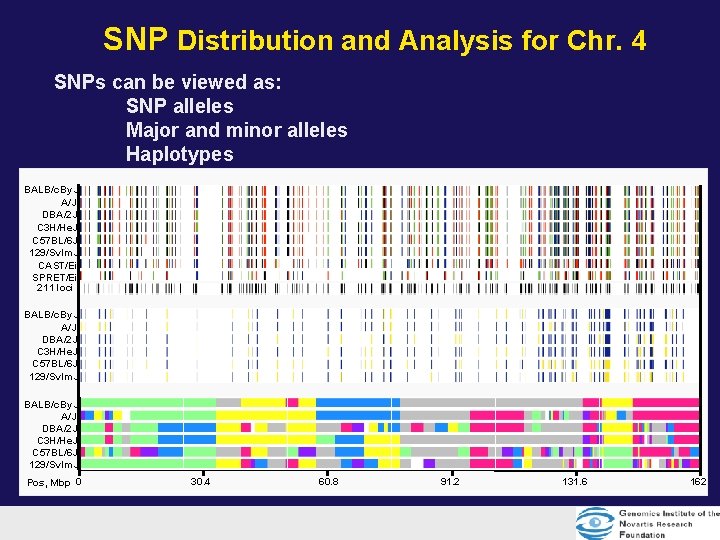
SNP Distribution and Analysis for Chr. 4 SNPs can be viewed as: SNP alleles Major and minor alleles Haplotypes BALB/c. By. J A/J DBA/2 J C 3 H/He. J C 57 BL/6 J 129/Sv. Im. J CAST/Ei SPRET/Ei 211 loci BALB/c. By. J A/J DBA/2 J C 3 H/He. J C 57 BL/6 J 129/Sv. Im. J Pos, Mbp 0 30. 4 60. 8 91. 2 131. 6 162
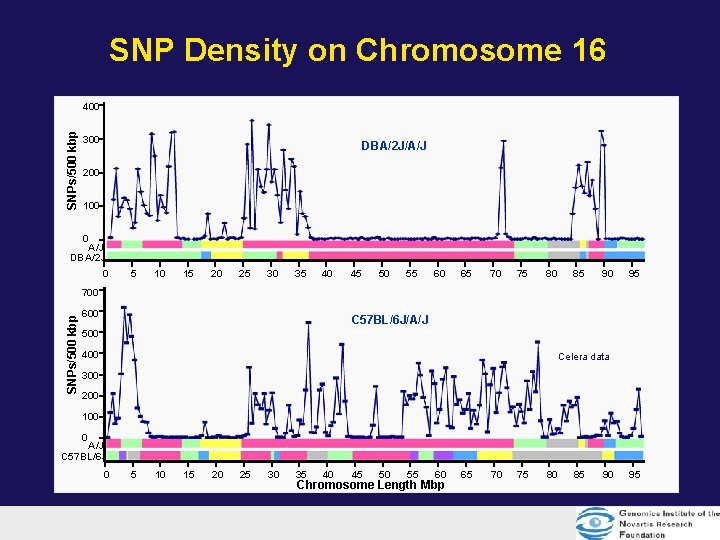
SNP Density on Chromosome 16 SNPs/500 kbp 400 300 DBA/2 J/A/J 200 100 0 A/J DBA/2 J 0 5 10 15 20 25 30 35 40 45 50 55 60 65 70 75 80 85 90 95 SNPs/500 kbp 700 600 C 57 BL/6 J/A/J 500 400 Celera data 300 200 100 0 A/J C 57 BL/6 J 0 5 10 15 20 25 30 35 40 45 50 55 60 Chromosome Length Mbp 65 70 75 80 85 90 95
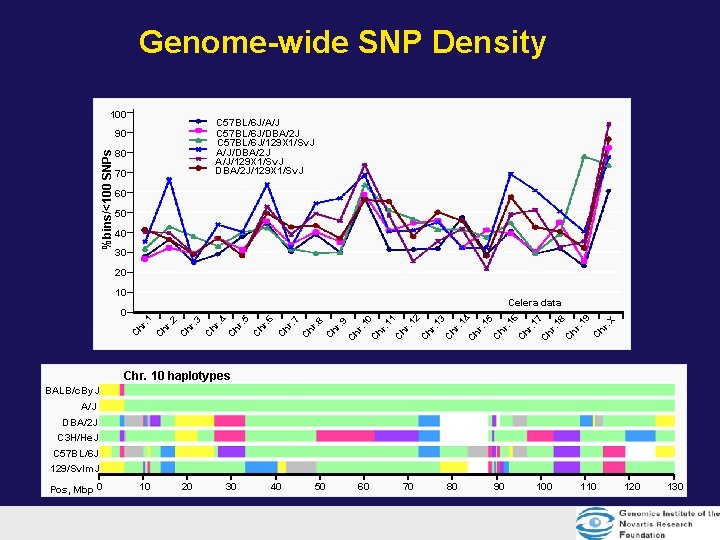
Genome-wide SNP Density 100 C 57 BL/6 J/A/J C 57 BL/6 J/DBA/2 J C 57 BL/6 J/129 X 1/Sv. J A/J/DBA/2 J A/J/129 X 1/Sv. J DBA/2 J/129 X 1/Sv. J %bins/<100 SNPs 90 80 70 60 50 40 30 20 10 . 9 Ch r . 8 Ch r . 7 . 6 Ch r . 5 . 4 Ch r . 3 . 2 Ch r . 1 0 Ch r. 1 1 Ch r. 1 2 Ch r. 1 3 Ch r. 1 4 Ch r. 1 5 Ch r. 1 6 Ch r. 1 7 Ch r. 1 8 Ch r. 1 9 Ch r. X Celera data 0 Chr. 10 haplotypes BALB/c. By. J A/J DBA/2 J C 3 H/He. J C 57 BL/6 J 129/Sv. Im. J Pos, Mbp 0 10 20 30 40 50 60 70 80 90 100 110 120 130
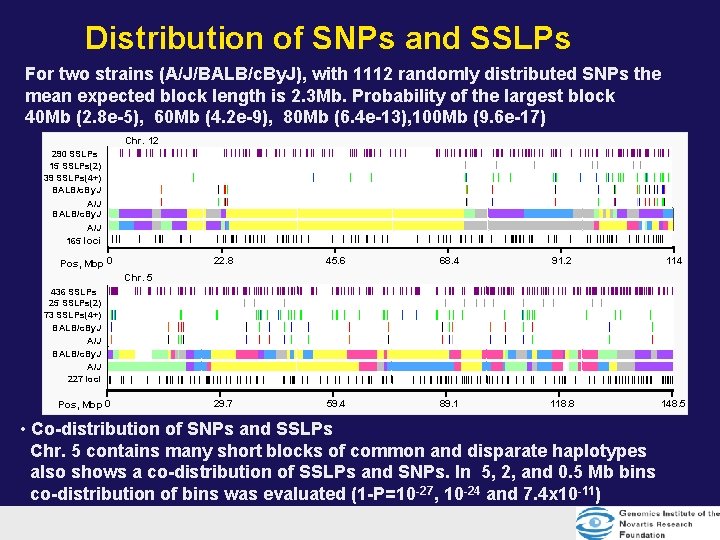
Distribution of SNPs and SSLPs For two strains (A/J/BALB/c. By. J), with 1112 randomly distributed SNPs the mean expected block length is 2. 3 Mb. Probability of the largest block 40 Mb (2. 8 e-5), 60 Mb (4. 2 e-9), 80 Mb (6. 4 e-13), 100 Mb (9. 6 e-17) Chr. 12 290 SSLPs 15 SSLPs(2) 39 SSLPs(4+) BALB/c. By. J A/J 165 loci Pos, Mbp 0 22. 8 45. 6 68. 4 91. 2 114 29. 7 59. 4 89. 1 118. 8 148. 5 Chr. 5 436 SSLPs 25 SSLPs(2) 73 SSLPs(4+) BALB/c. By. J A/J 227 loci Pos, Mbp 0 • Co-distribution of SNPs and SSLPs Chr. 5 contains many short blocks of common and disparate haplotypes also shows a co-distribution of SSLPs and SNPs. In 5, 2, and 0. 5 Mb bins co-distribution of bins was evaluated (1 -P=10 -27, 10 -24 and 7. 4 x 10 -11)
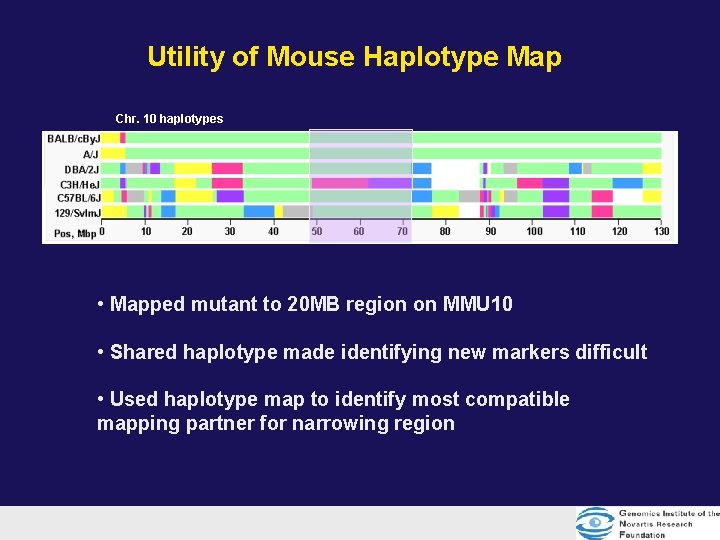
Utility of Mouse Haplotype Map Chr. 10 haplotypes • Mapped mutant to 20 MB region on MMU 10 • Shared haplotype made identifying new markers difficult • Used haplotype map to identify most compatible mapping partner for narrowing region
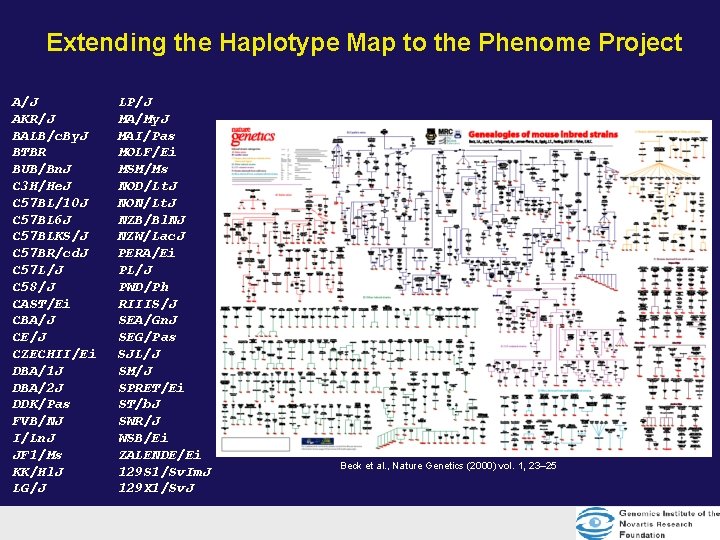
Extending the Haplotype Map to the Phenome Project A/J AKR/J BALB/c. By. J BTBR BUB/Bn. J C 3 H/He. J C 57 BL/10 J C 57 BL 6 J C 57 BLKS/J C 57 BR/cd. J C 57 L/J C 58/J CAST/Ei CBA/J CE/J CZECHII/Ei DBA/1 J DBA/2 J DDK/Pas FVB/NJ I/Ln. J JF 1/Ms KK/Hl. J LG/J LP/J MA/My. J MAI/Pas MOLF/Ei MSM/Ms NOD/Lt. J NON/Lt. J NZB/Bl. NJ NZW/Lac. J PERA/Ei PL/J PWD/Ph RIIIS/J SEA/Gn. J SEG/Pas SJL/J SM/J SPRET/Ei ST/b. J SWR/J WSB/Ei ZALENDE/Ei 129 S 1/Sv. Im. J 129 X 1/Sv. J Beck et al. , Nature Genetics (2000) vol. 1, 23– 25
Initial Set Selection • Goal – To pick an evenly spaced SNP set from the Celera collection that are from unique haplotypes and not recent strain specific mutations • Preference was given to SNPs where each allele was found in two strains (DBA, 129 X 1, A/J, B 6) • Worked on assumption that selection criteria would favor older SNPs – musculus vs. domesticus
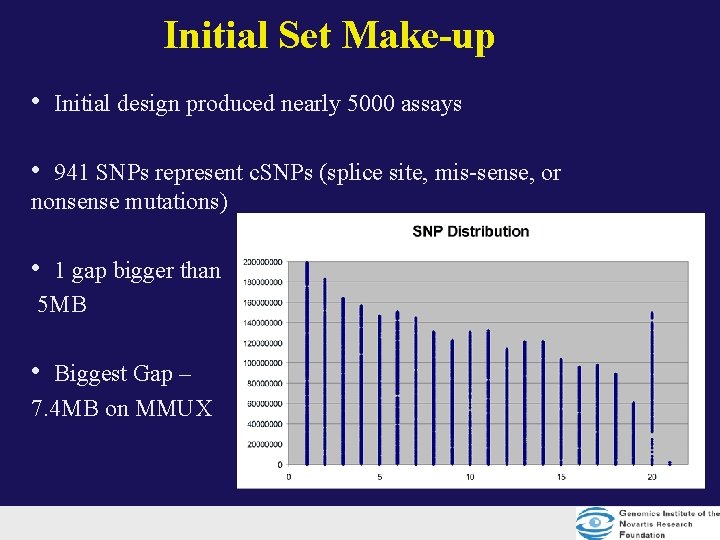
Initial Set Make-up • Initial design produced nearly 5000 assays • 941 SNPs represent c. SNPs (splice site, mis-sense, or nonsense mutations) • 1 gap bigger than 5 MB • Biggest Gap – 7. 4 MB on MMUX
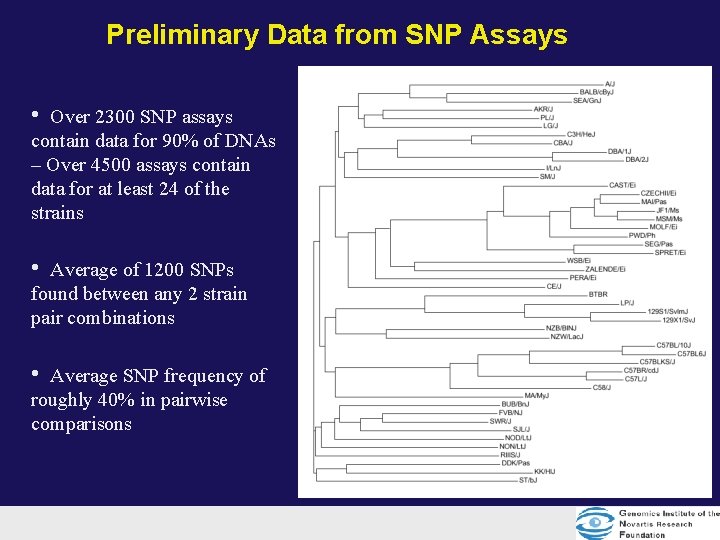
Preliminary Data from SNP Assays • Over 2300 SNP assays contain data for 90% of DNAs – Over 4500 assays contain data for at least 24 of the strains • Average of 1200 SNPs found between any 2 strain pair combinations • Average SNP frequency of roughly 40% in pairwise comparisons
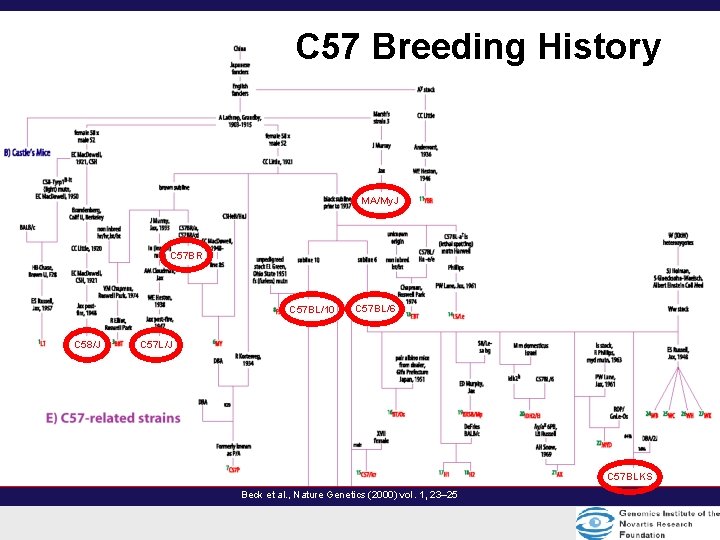
C 57 Breeding History MA/My. J C 57 BR C 57 BL/10 C 58/J C 57 BL/6 C 57 L/J C 57 BLKS Beck et al. , Nature Genetics (2000) vol. 1, 23– 25
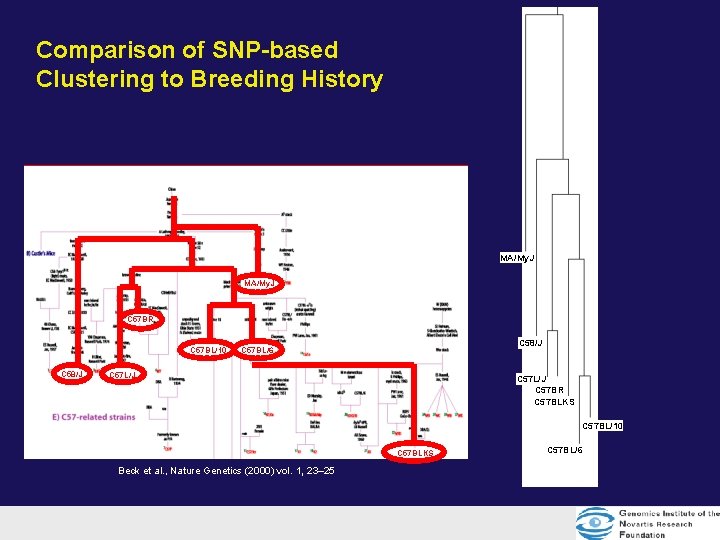
Comparison of SNP-based Clustering to Breeding History MA/My. J C 57 BR C 57 BL/10 C 58/J C 57 BL/6 C 57 L/J C 57 BR C 57 BLKS C 57 BL/10 C 57 BLKS Beck et al. , Nature Genetics (2000) vol. 1, 23– 25 C 57 BL/6
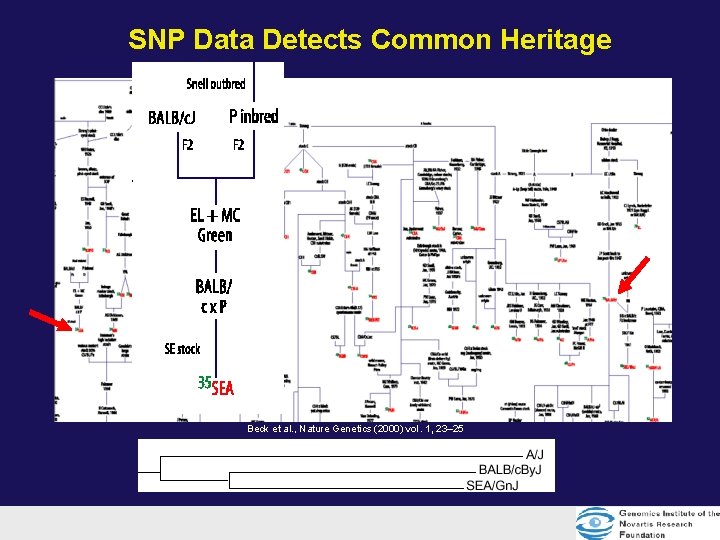
SNP Data Detects Common Heritage Beck et al. , Nature Genetics (2000) vol. 1, 23– 25
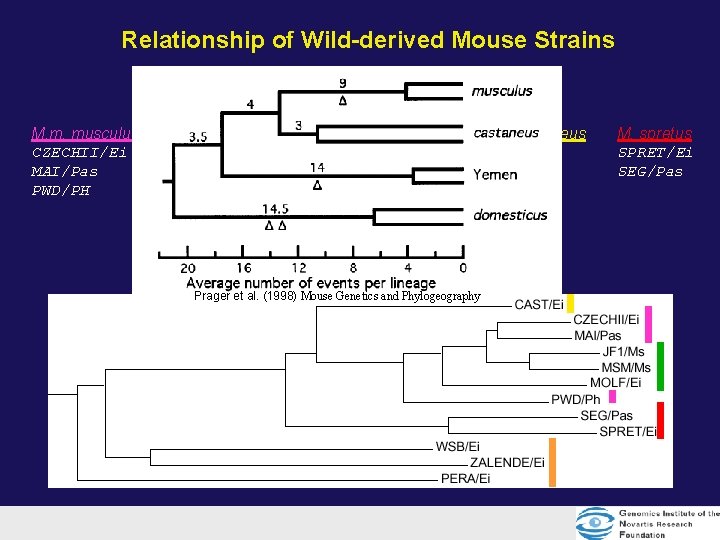
Relationship of Wild-derived Mouse Strains M. m. musculus CZECHII/Ei MAI/Pas PWD/PH M. m. molossinus JF 1 MSM/Ms MOLF/Ei M. m. domesticus PERA/Ei WSB/Ei ZALENDE/Ei M. m. castaneus CAST/Ei Prager et al. (1998) Mouse Genetics and Phylogeography M. spretus SPRET/Ei SEG/Pas
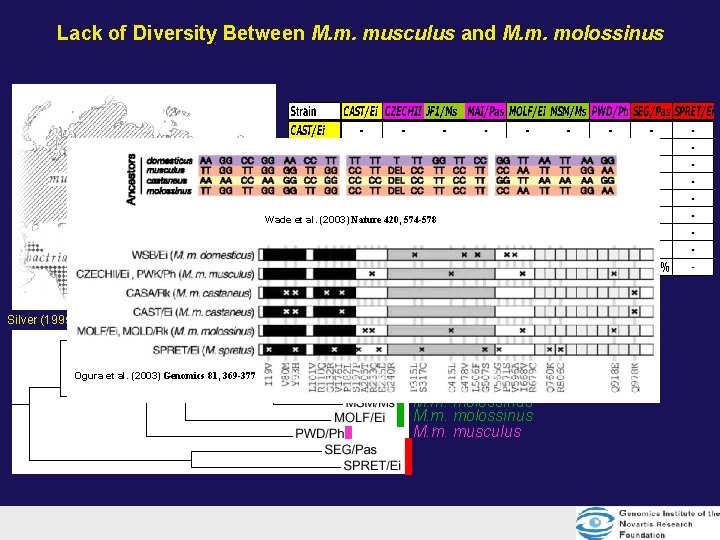
Lack of Diversity Between M. m. musculus and M. m. molossinus Wade et al. (2003) Nature 420, 574 -578 SNP Frequency Silver (1995) Mouse Genetics: Concepts and Applications Ogura et al. (2003) Genomics 81, 369 -377 M. m. musculus M. m. molossinus M. m. musculus
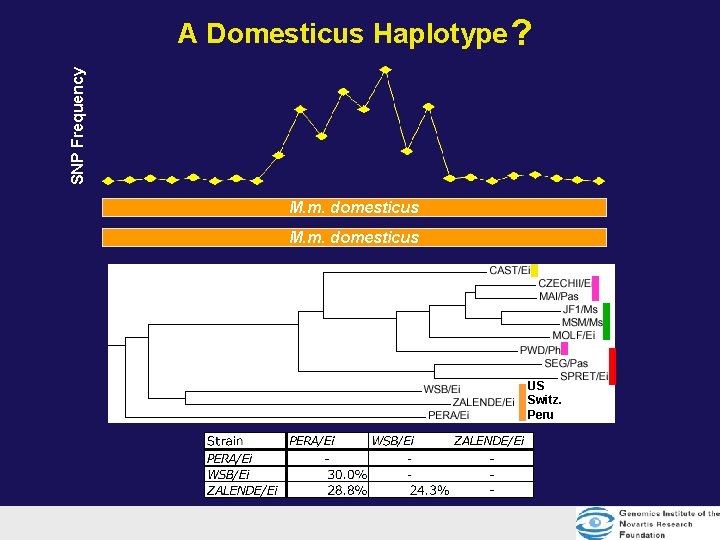
SNP Frequency A Domesticus Haplotype ? M. m. domesticus musculus M. m. domesticus US Switz. Peru
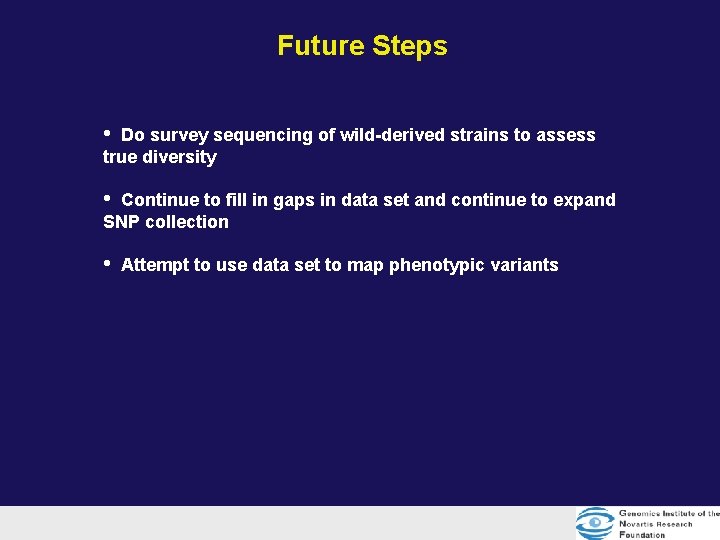
Future Steps • Do survey sequencing of wild-derived strains to assess true diversity • Continue to fill in gaps in data set and continue to expand SNP collection • Attempt to use data set to map phenotypic variants
Acknowledgements Tim Wiltshire Whitney Barnes Patrick Merritt Candace Motta Franzmarie Lippincott Deborah Stradley Niusha Ziaee Serge Batalov Steve Kay