
Toward a Sustainable Development of the Steel Industry
Toward a Sustainable Development of the Steel Industry – Building firm relationships in the steel industry to jointly resolve issues on environment and energy – Mr. Koichi ONISHI Senior Officer Technology Administration Department, Iron & Steel Sector Kobe Steel, Ltd. October 14 th 2005 1
– Contents – 1. Growing Steel Demand Environmental Issues 2. Energy-related Issues and Measures 3. Environmental/Emission Standards and Measures 4. Resource Saving and Recycling Activities 5. Work in Progress of Currently Developing New Technologies/ Plant Facilities 6. Conclusion 2
1. Growing Steel Demand Environmental Issues 3
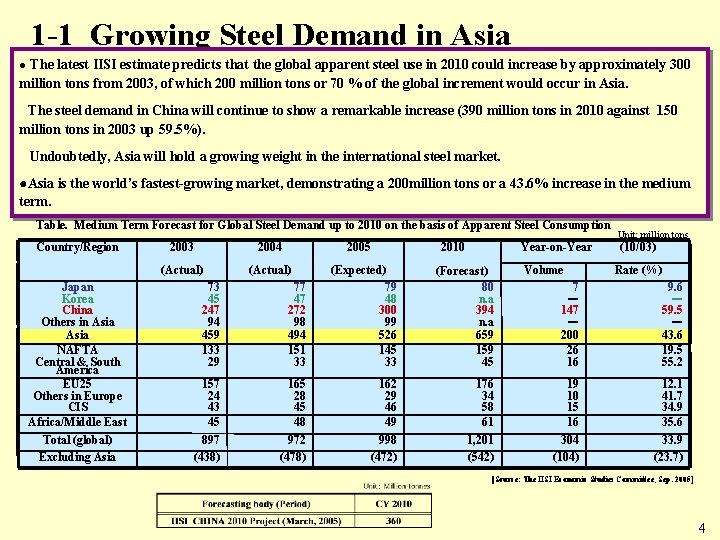
1 -1 Growing Steel Demand in Asia ● The latest IISI estimate predicts that the global apparent steel use in 2010 could increase by approximately 300 million tons from 2003, of which 200 million tons or 70 % of the global increment would occur in Asia. The steel demand in China will continue to show a remarkable increase (390 million tons in 2010 against 150 million tons in 2003 up 59. 5%). Undoubtedly, Asia will hold a growing weight in the international steel market. ●Asia is the world’s fastest-growing market, demonstrating a 200 million tons or a 43. 6% increase in the medium term. Table. Medium Term Forecast for Global Steel Demand up to 2010 on the basis of Apparent Steel Consumption Country/Region Japan Korea China Others in Asia NAFTA Central & South America EU 25 Others in Europe CIS Africa/Middle East Total (global) Excluding Asia 2003 2004 2005 (Actual) 2010 Year-on-Year 47 272 98 494 151 33 (Expected) 79 48 300 99 526 145 33 (Forecast) 80 n. a 394 n. a 659 159 45 157 24 43 45 165 28 45 48 162 29 46 49 897 (438) 972 (478) 998 (472) 73 45 247 94 459 133 29 77 単位:百万トン Volume Unit: million tons (10/03) Rate (%) 7 - 147 - 200 26 16 9. 6 - 59. 5 - 43. 6 19. 5 55. 2 176 34 58 61 19 10 15 16 12. 1 41. 7 34. 9 35. 6 1, 201 (542) 304 (104) 33. 9 (23. 7) [Source: The IISI Economic Studies Committee, Sep. 2005] 4
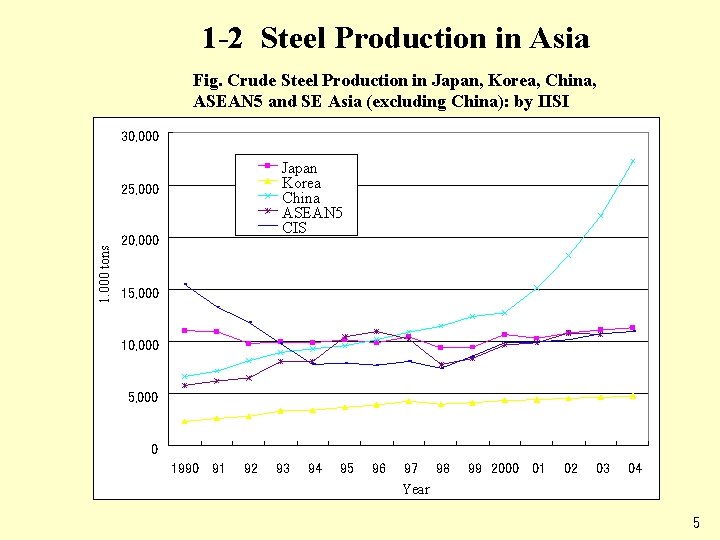
1 -2 Steel Production in Asia Fig. Crude Steel Production in Japan, Korea, China, ASEAN 5 and SE Asia (excluding China): by IISI 30, 000 Japan Korea China ASEAN 5 CIS 1. 000 tons 25, 000 20, 000 15, 000 10, 000 5, 000 0 1990 91 92 93 94 95 96 97 98 Year 99 2000 01 02 03 04 5
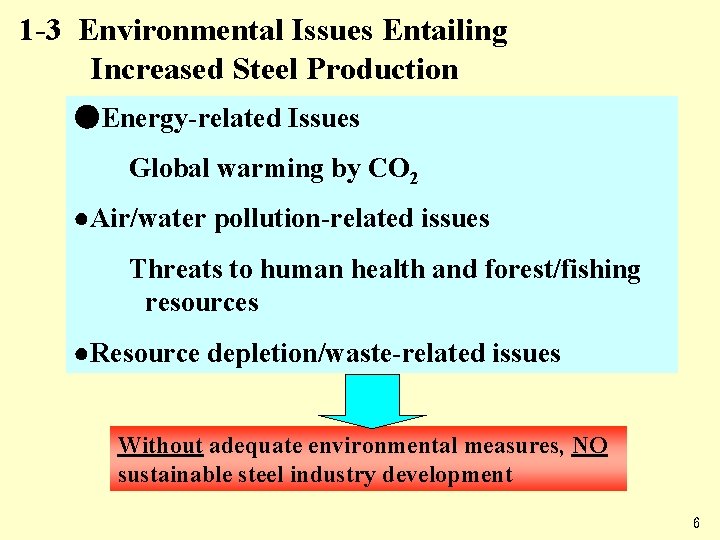
1 -3 Environmental Issues Entailing Increased Steel Production ●Energy-related Issues Global warming by CO 2 ●Air/water pollution-related issues Threats to human health and forest/fishing resources ●Resource depletion/waste-related issues Without adequate environmental measures, NO sustainable steel industry development 6
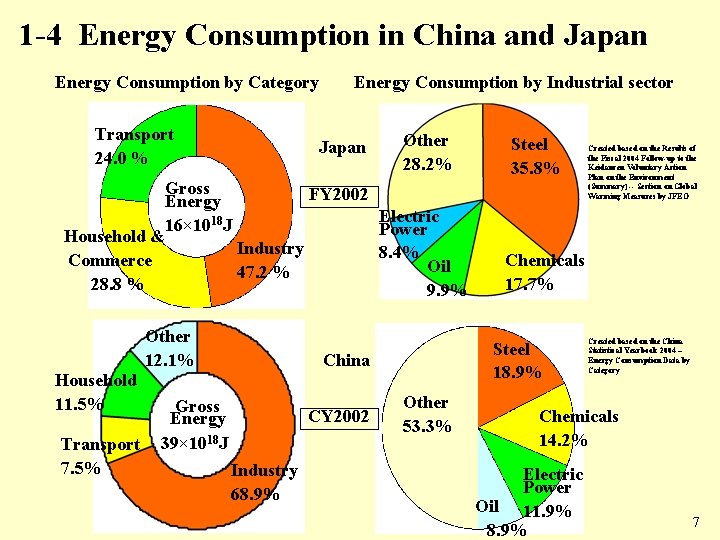
1 -4 Energy Consumption in China and Japan Energy Consumption by Category Transport 24. 0 % Energy Consumption by Industrial sector Japan Other 28. 2% Gross FY 2002 Energy Electric 16× 1018 J Power Household & Industry 8. 4% Commerce Oil 47. 2 % 28. 8 % 9. 9% Other 12. 1% Household 11. 5% Transport 7. 5% CY 2002 Industry 68. 9% Other 53. 3% Created based on the Results of the Fiscal 2004 Follow-up to the Keidanren Voluntary Action Plan on the Environment (Summary) -- Section on Global Warming Measures by JFEO Chemicals 17. 7% Steel 18. 9% China Gross Energy 39× 1018 J Steel 35. 8% Created based on the China Statistical Yearbook 2004 – Energy Consumption Data by Category Chemicals 14. 2% Electric Power Oil 11. 9% 8. 9% 7
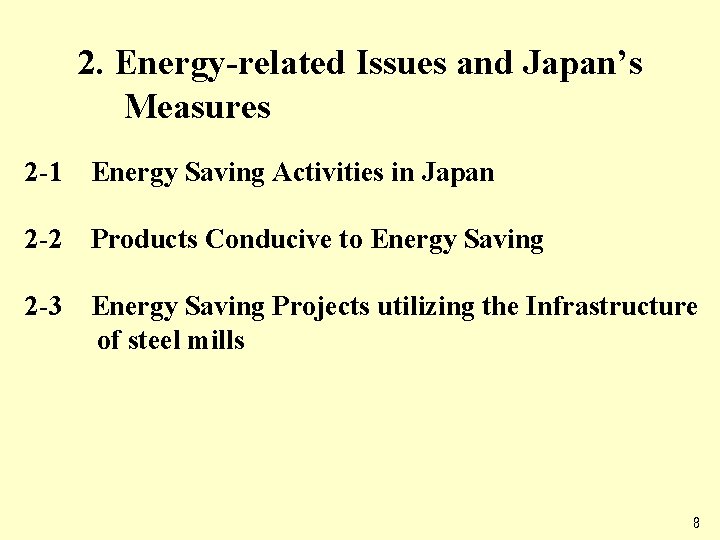
2. Energy-related Issues and Japan’s Measures 2 -1 Energy Saving Activities in Japan 2 -2 Products Conducive to Energy Saving 2 -3 Energy Saving Projects utilizing the Infrastructure of steel mills 8
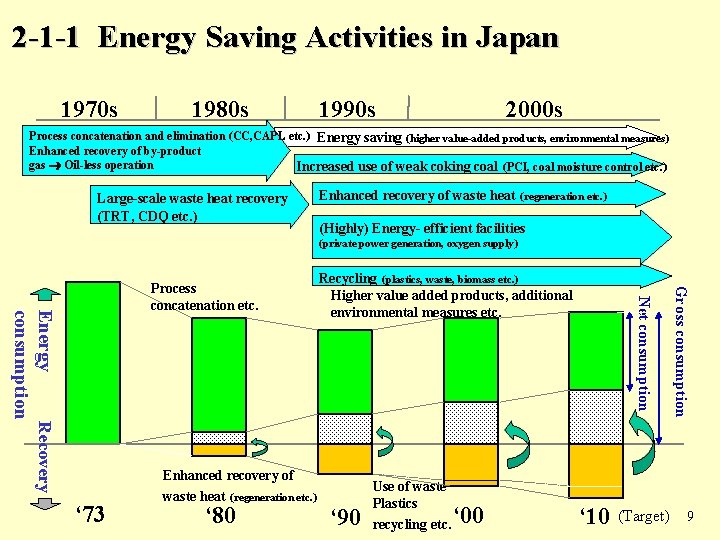
2 -1 -1 Energy Saving Activities in Japan 1970 s 1980 s 1990 s 2000 s Process concatenation and elimination (CC, CAPL etc. ) Energy saving (higher value-added products, environmental measures) Enhanced recovery of by-product gas Oil-less operation Increased use of weak coking coal (PCI, coal moisture control etc. ) Large-scale waste heat recovery (TRT, CDQ etc. ) Enhanced recovery of waste heat (regeneration etc. ) (Highly) Energy- efficient facilities (private power generation, oxygen supply) ‘ 80 ‘ 90 Use of waste Plastics recycling etc. ‘ 00 ‘ 10 (Target) Gross consumption ‘ 73 Enhanced recovery of waste heat (regeneration etc. ) Recycling (plastics, waste, biomass etc. ) Higher value added products, additional environmental measures etc. Net consumption Energy Recovery consumption Process concatenation etc. 9
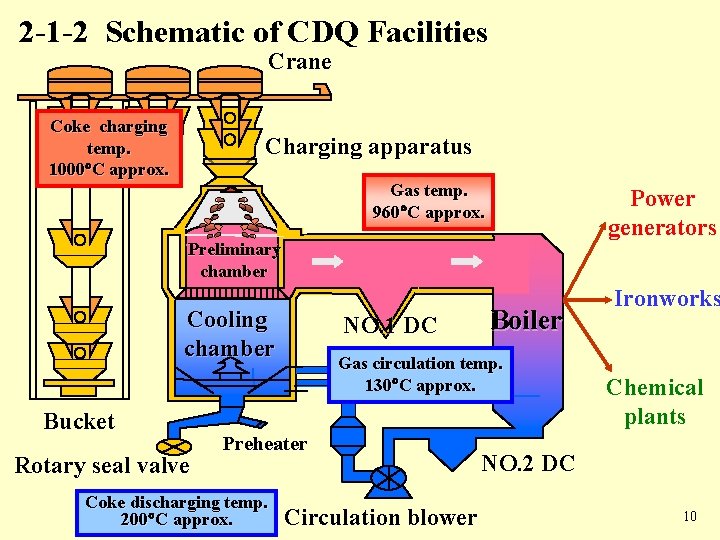
2 -1 -2 Schematic of CDQ Facilities Crane Coke charging temp. 1000 C approx. Charging apparatus Gas temp. 960 C approx. Power generators Preliminary chamber Cooling chamber Bucket Rotary seal valve NO. 1 DC Gas circulation temp. 130 C approx. Preheater Coke discharging temp. 200 C approx. Boiler Circulation blower Ironworks Chemical plants NO. 2 DC 10
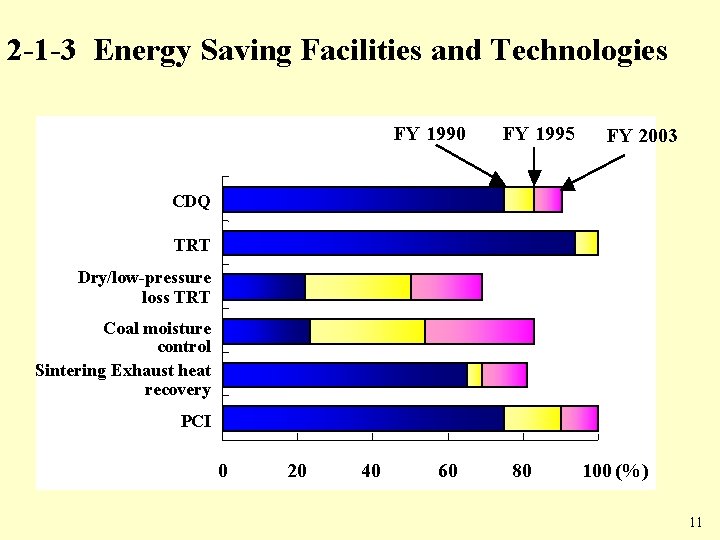
2 -1 -3 Energy Saving Facilities and Technologies FY 1990 FY 1995 FY 2003 CDQ TRT Dry/low-pressure loss TRT Coal moisture control Sintering Exhaust heat recovery PCI 0 20 40 60 80 100 (%) 11
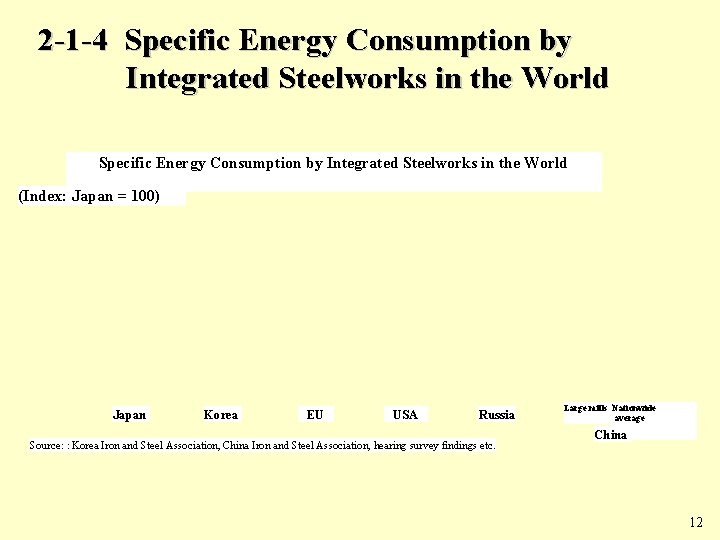
2 -1 -4 Specific Energy Consumption by Integrated Steelworks in the World (Index: Japan = 100) Japan Korea EU USA Russia Source: :Korea Iron and Steel Association, China Iron and Steel Association, hearing survey findings etc. Large mills Nationwide average China 12
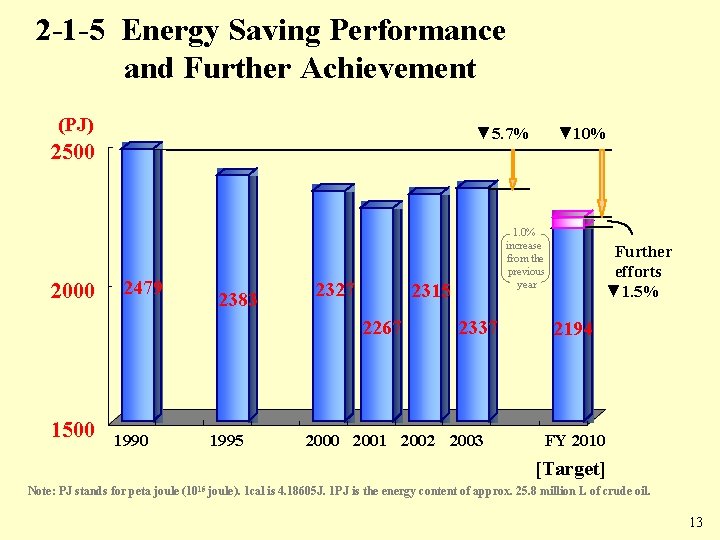
2 -1 -5 Energy Saving Performance and Further Achievement (PJ) ▼ 5. 7% 2500 2000 2479 2383 2327 1500 1995 1. 0% increase from the previous year 2315 2267 ▼ 10% 2337 2000 2001 2002 2003 Further efforts ▼ 1. 5% 2194 FY 2010 [Target] Note: PJ stands for peta joule (1015 joule). 1 cal is 4. 18605 J. 1 PJ is the energy content of approx. 25. 8 million L of crude oil. 13
2 -2 Products Conducive to Energy Saving 14
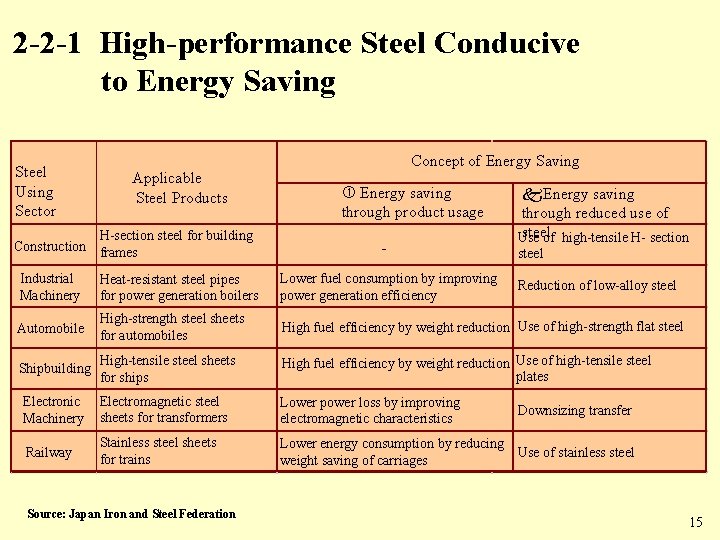
2 -2 -1 High-performance Steel Conducive to Energy Saving Steel Using Sector Applicable Steel Products H-section steel for building Construction frames Concept of Energy Saving Energy saving through product usage - k. Energy saving through reduced use of steel Use of high-tensile H- section steel Industrial Machinery Heat-resistant steel pipes for power generation boilers Lower fuel consumption by improving power generation efficiency Automobile High-strength steel sheets for automobiles High fuel efficiency by weight reduction Use of high-strength flat steel Shipbuilding High-tensile steel sheets for ships High fuel efficiency by weight reduction Use of high-tensile steel plates Electronic Machinery Electromagnetic steel sheets for transformers Lower power loss by improving electromagnetic characteristics Railway Stainless steel sheets for trains Lower energy consumption by reducing Use of stainless steel weight saving of carriages Source: Japan Iron and Steel Federation Reduction of low-alloy steel Downsizing transfer 15
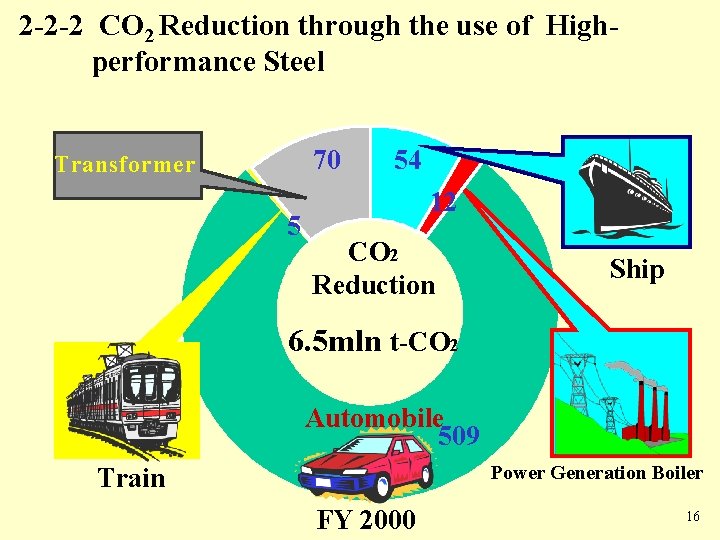
2 -2 -2 CO 2 Reduction through the use of Highperformance Steel 70 Transformer 5 54 12 CO 2 Reduction Ship 6. 5 mln t-CO 2 Automobile 509 Power Generation Boiler Train FY 2000 16
2 -3 Energy Saving Projects Utilizing the Infrastructure of steel mills ●Entry to Power Generation Business ●Entry to Recycle Management Business 17
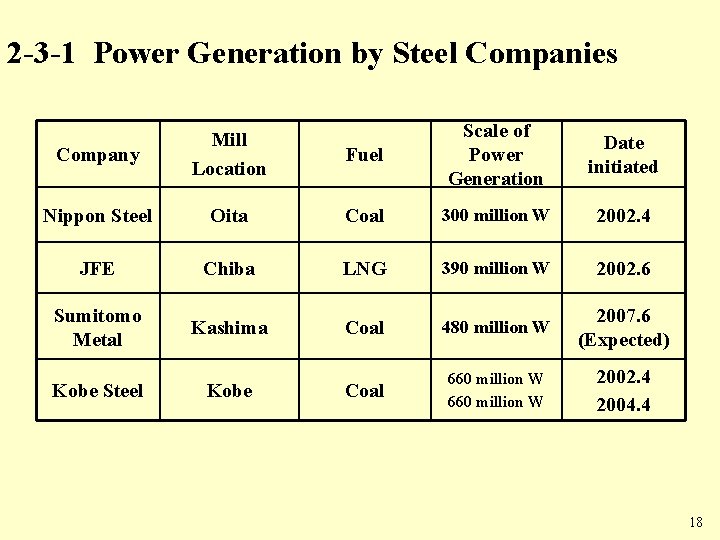
2 -3 -1 Power Generation by Steel Companies Fuel Scale of Power Generation Date initiated Oita Coal 300 million W 2002. 4 JFE Chiba LNG 390 million W 2002. 6 Sumitomo Metal Kashima Coal 480 million W 2007. 6 (Expected) Coal 660 million W 2002. 4 2004. 4 Company Mill Location Nippon Steel Kobe 18
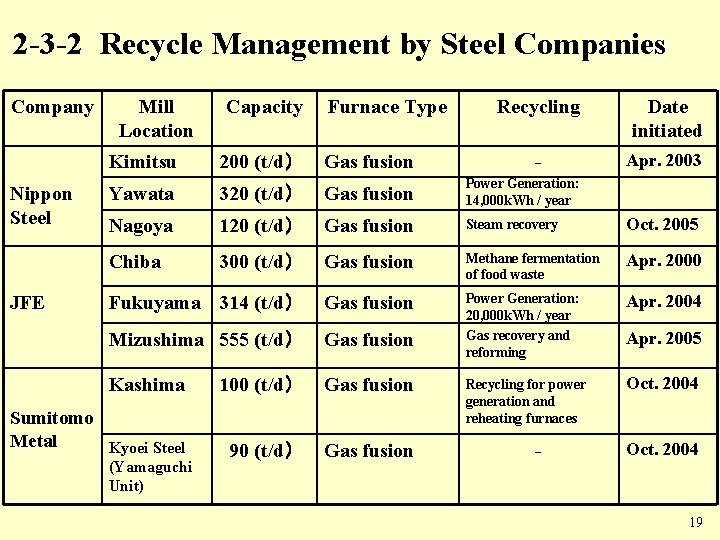
2 -3 -2 Recycle Management by Steel Companies Company Mill Location Capacity Furnace Type Recycling Date initiated - Apr. 2003 Kimitsu 200 (t/d) Gas fusion Yawata 320 (t/d) Gas fusion Power Generation: 14, 000 k. Wh / year Nagoya 120 (t/d) Gas fusion Steam recovery Oct. 2005 Chiba 300 (t/d) Gas fusion Methane fermentation of food waste Apr. 2000 Fukuyama 314 (t/d) Gas fusion Apr. 2004 Mizushima 555 (t/d) Gas fusion Power Generation: 20, 000 k. Wh / year Gas recovery and reforming Kashima 100 (t/d) Gas fusion Oct. 2004 Sumitomo Metal Kyoei Steel Recycling for power generation and reheating furnaces 90 (t/d) Gas fusion Nippon Steel JFE (Yamaguchi Unit) - Apr. 2005 Oct. 2004 19
3. Environmental/Emission Standards and Measures 20
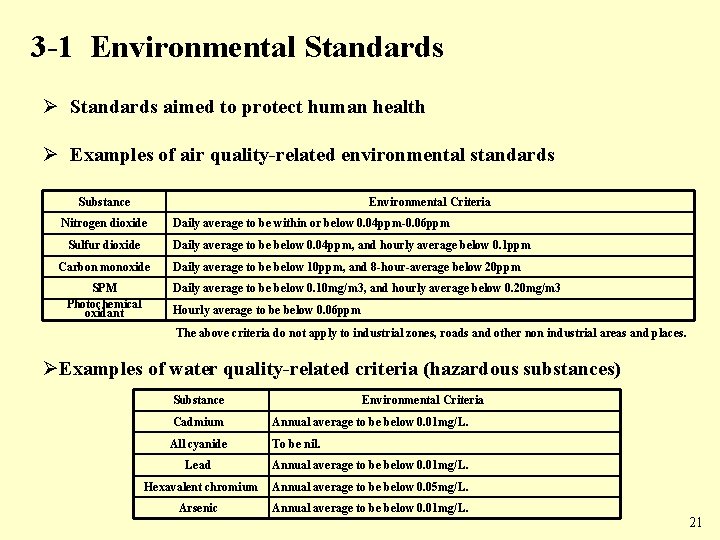
3 -1 Environmental Standards Ø Standards aimed to protect human health Ø Examples of air quality-related environmental standards Substance Environmental Criteria Nitrogen dioxide Sulfur dioxide Daily average to be below 0. 04 ppm, and hourly average below 0. 1 ppm Carbon monoxide SPM Photochemical oxidant Daily average to be within or below 0. 04 ppm-0. 06 ppm Daily average to be below 10 ppm, and 8 -hour-average below 20 ppm Daily average to be below 0. 10 mg/m 3, and hourly average below 0. 20 mg/m 3 Hourly average to be below 0. 06 ppm The above criteria do not apply to industrial zones, roads and other non industrial areas and places. ØExamples of water quality-related criteria (hazardous substances) Substance Environmental Criteria Cadmium Annual average to be below 0. 01 mg/L. All cyanide To be nil. Lead Annual average to be below 0. 01 mg/L. Hexavalent chromium Annual average to be below 0. 05 mg/L. Arsenic Annual average to be below 0. 01 mg/L. 21
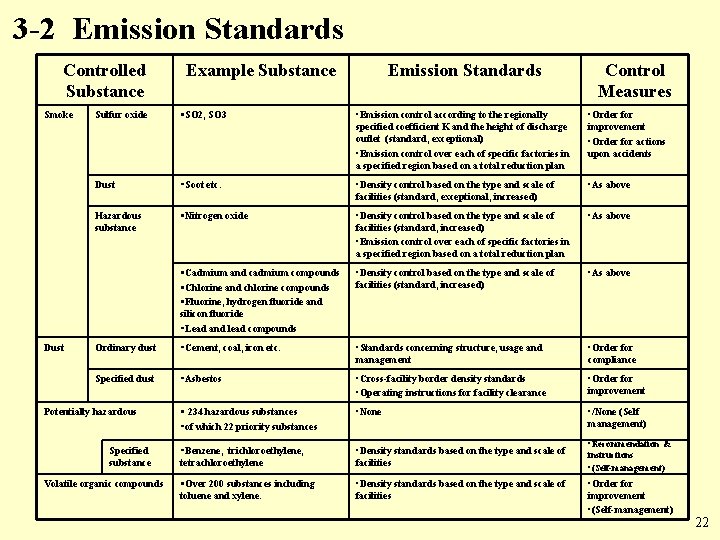
3 -2 Emission Standards Controlled Substance Smoke Dust Example Substance Emission Standards Control Measures Sulfur oxide ・SO 2, SO 3 • Emission control according to the regionally specified coefficient K and the height of discharge outlet (standard, exceptional) • Emission control over each of specific factories in a specified region based on a total reduction plan • Order for improvement • Order for actions upon accidents Dust ・Soot etc. • Density control based on the type and scale of facilities (standard, exceptional, increased) • As above Hazardous substance ・Nitrogen oxide • Density control based on the type and scale of facilities (standard, increased) • Emission control over each of specific factories in a specified region based on a total reduction plan • As above ・Cadmium and cadmium compounds ・Chlorine and chlorine compounds ・Fluorine, hydrogen fluoride and silicon fluoride ・Lead and lead compounds • Density control based on the type and scale of facilities (standard, increased) • As above Ordinary dust ・Cement, coal, iron etc. • Standards concerning structure, usage and management • Order for compliance Specified dust ・Asbestos • Cross-facility border density standards • Operating instructions for facility clearance • Order for improvement ・ 234 hazardous substances ・of which 22 priority substances • None • /None (Self management) ・Benzene, trichloroethylene, tetrachloroethylene • Density standards based on the type and scale of facilities ・Over 200 substances including toluene and xylene. • Density standards based on the type and scale of facilities Potentially hazardous Specified substance Volatile organic compounds • Recommendation & instructions • (Self-management) • Order for improvement • (Self-management) 22
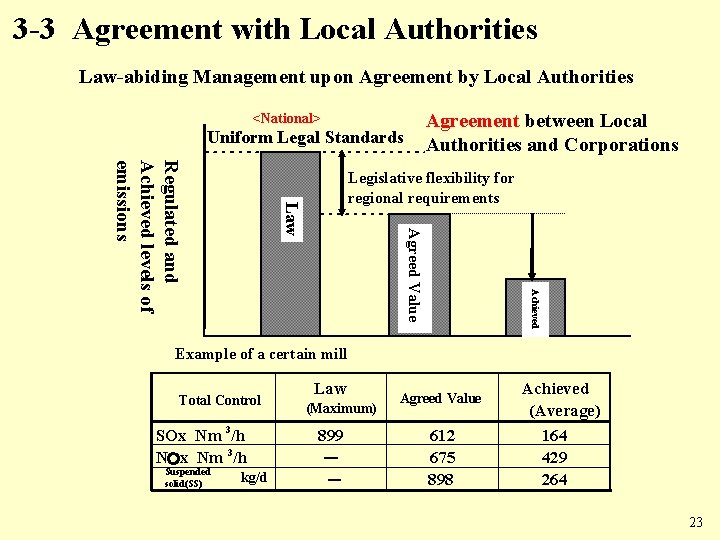
3 -3 Agreement with Local Authorities Law-abiding Management upon Agreement by Local Authorities Agreement between Local Authorities and Corporations <National> Uniform Legal Standards Achieved Agreed Value Law Regulated and Achieved levels of emissions Legislative flexibility for regional requirements Example of a certain mill Total Control SOx Nm 3/h NOx Nm 3/h Suspended solid(SS) kg/d Law (Maximum) 899 - - Agreed Value 612 675 898 Achieved (Average) 164 429 264 23
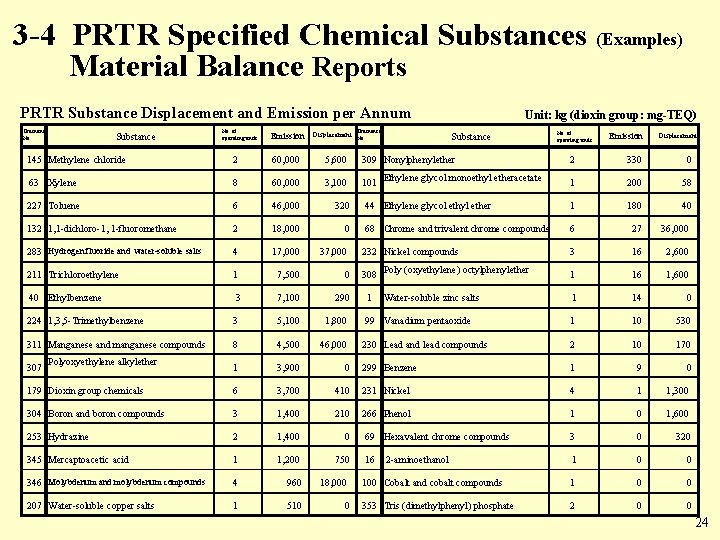
3 -4 PRTR Specified Chemical Substances (Examples) Material Balance Reports PRTR Substance Displacement and Emission per Annum Ordinance No. Substance No. of operating units Emission Displacement Ordinance Unit: kg (dioxin group: mg-TEQ) Substance No. 145 Methylene chloride 2 60, 000 5, 600 309 Nonylphenylether 63 Xylene 8 60, 000 3, 100 101 227 Toluene 6 46, 000 320 132 1, 1 -dichloro-1, 1 -fluoromethane 2 18, 000 0 283 Hydrogen fluoride and water-soluble salts 4 17, 000 37, 000 211 Trichloroethylene 1 7, 500 0 40 Ethylbenzene 3 7, 100 290 224 1, 3, 5 -Trimethylbenzene 3 5, 100 1, 800 311 Manganese and manganese compounds 8 4, 500 46, 000 1 3, 900 0 179 Dioxin group chemicals 6 3, 700 304 Boron and boron compounds 3 253 Hydrazine No. of operating units Emission Displacement 2 330 0 1 200 58 44 Ethylene glycol ethyl ether 1 180 40 68 Chrome and trivalent chrome compounds 6 27 36, 000 232 Nickel compounds 3 16 2, 600 1 16 1, 600 1 14 0 99 Vanadium pentaoxide 1 10 530 230 Lead and lead compounds 2 10 170 299 Benzene 1 9 0 410 231 Nickel 4 1 1, 300 1, 400 210 266 Phenol 1 0 1, 600 2 1, 400 0 69 Hexavalent chrome compounds 3 0 320 345 Mercaptoacetic acid 1 1, 200 750 16 1 0 0 346 Molybdenum and molybdenum compounds 4 960 18, 000 100 Cobalt and cobalt compounds 1 0 0 207 Water-soluble copper salts 1 510 0 353 Tris (dimethylphenyl) phosphate 2 0 0 307 Polyoxyethylene alkylether 308 1 Ethylene glycol monoethyl etheracetate Poly (oxyethylene) octylphenylether Water-soluble zinc salts 2 -aminoethanol 24
3 -5 Environmental Conservation Cost 25
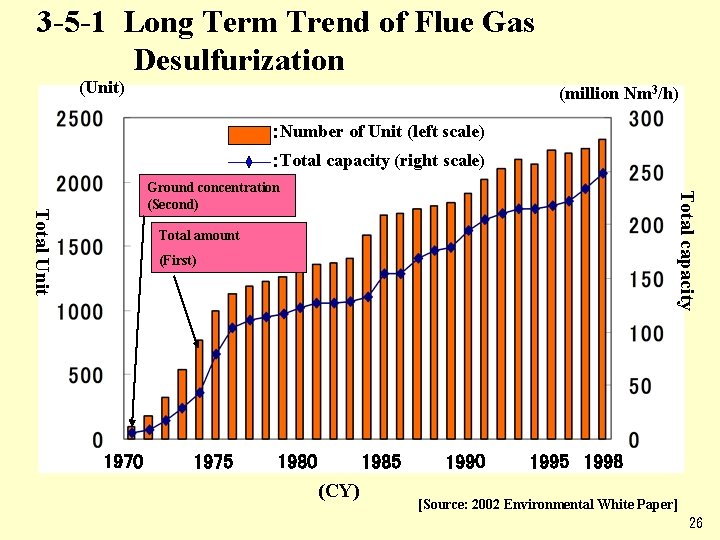
3 -5 -1 Long Term Trend of Flue Gas Desulfurization (Unit) (million Nm 3/h) :Number of Unit (left scale) :Total capacity (right scale) Total capacity Total Unit Ground concentration (Second) Total amount (First) 1970 1975 1980 (CY) 1990 1995 1998 [Source: 2002 Environmental White Paper] 26
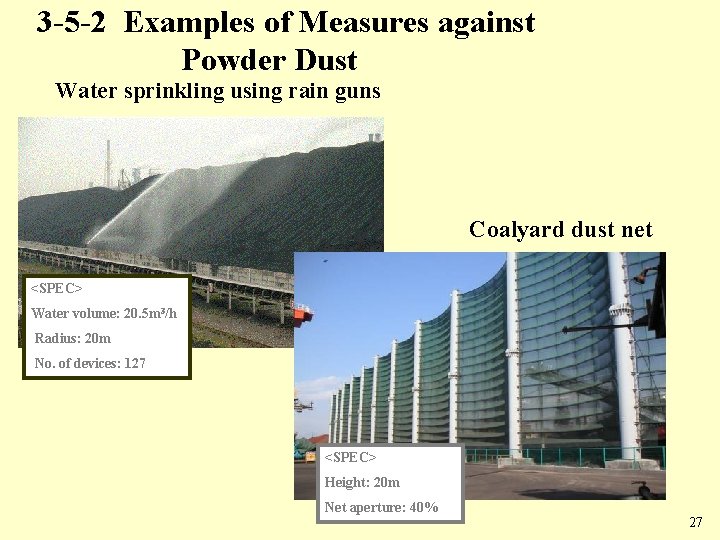
3 -5 -2 Examples of Measures against Powder Dust Water sprinkling using rain guns Coalyard dust net <SPEC> Water volume: 20. 5 m 3/h Radius: 20 m No. of devices: 127 <SPEC> Height: 20 m Net aperture: 40% 27
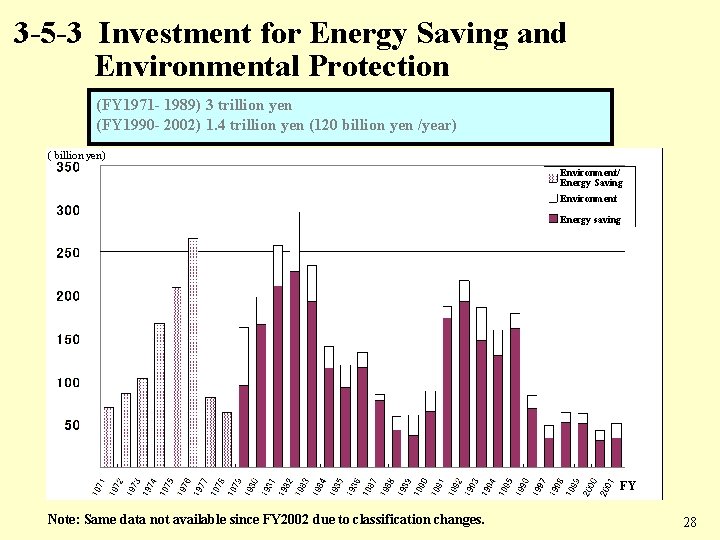
3 -5 -3 Investment for Energy Saving and Environmental Protection (FY 1971 - 1989) 3 trillion yen (FY 1990 - 2002) 1. 4 trillion yen (120 billion yen /year) ( billion yen) Environment/ Energy Saving Environment Energy saving FY Note: Same data not available since FY 2002 due to classification changes. 28
3 -6 Environmentally Sound Products 29
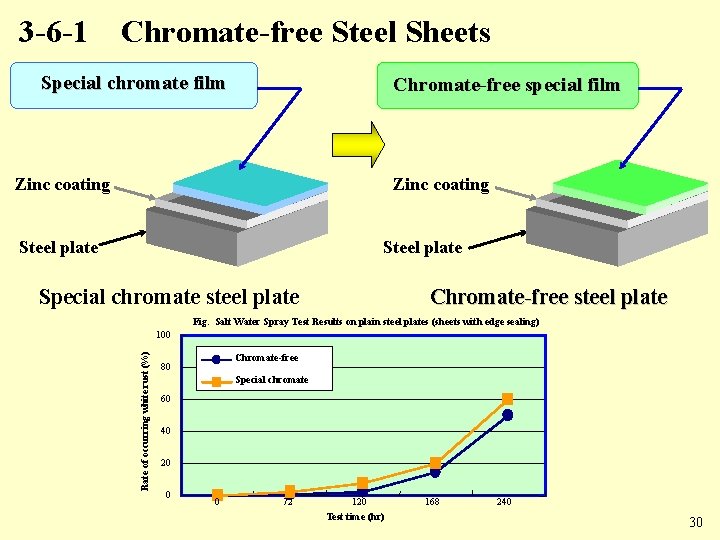
3 -6 -1 Chromate-free Steel Sheets Special chromate film Chromate-free special film Zinc coating Steel plate Special chromate steel plate Chromate-free steel plate Fig. Salt Water Spray Test Results on plain steel plates (sheets with edge sealing) Rate of occurring white rust (%) 100 Chromate-free 80 Special chromate 60 40 20 0 0 72 120 Test time (hr) 168 240 30
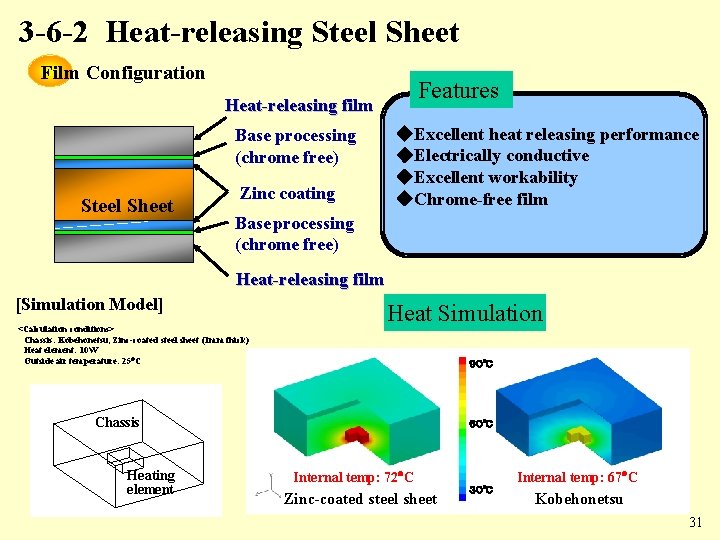
3 -6 -2 Heat-releasing Steel Sheet Film Configuration Features Heat-releasing film Base processing (chrome free) Steel Sheet Zinc coating ◆Excellent heat releasing performance ◆Electrically conductive ◆Excellent workability ◆Chrome-free film Base processing (chrome free) Heat-releasing film [Simulation Model] <Calculation conditions> Chassis: Kobehonetsu, Zinc-coated steel sheet (1 mm thick) Heat element: 10 W Outside air temperature: 25 C Heat Simulation 90℃ Chassis Heating element 60℃ Internal temp: 72 C Zinc-coated steel sheet 30℃ Internal temp: 67 C Kobehonetsu 31
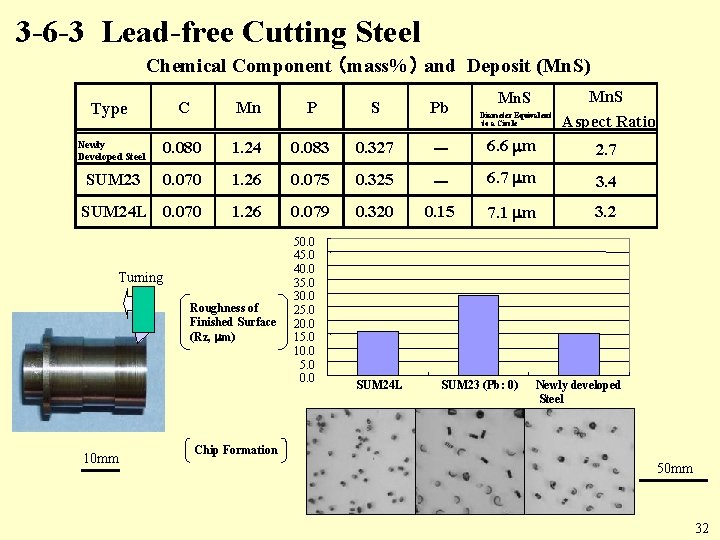
3 -6 -3 Lead-free Cutting Steel Chemical Component (mass%) and Deposit (Mn. S) Mn. S Aspect Ratio Type C Mn P S Pb Newly Developed Steel 0. 080 1. 24 0. 083 0. 327 - 6. 6 m 2. 7 SUM 23 0. 070 1. 26 0. 075 0. 325 - 6. 7 m 3. 4 SUM 24 L 0. 070 1. 26 0. 079 0. 320 0. 15 7. 1 m 3. 2 Turning Roughness of Finished Surface (Rz, m) 10 mm 50. 0 45. 0 40. 0 35. 0 30. 0 25. 0 20. 0 15. 0 10. 0 5. 0 0. 0 SUM 24 L Diameter Equivalent to a Circle SUM 23 (Pb: 0) Newly developed Steel Chip Formation 50 mm 32
4. Resource Saving and Recycling 33
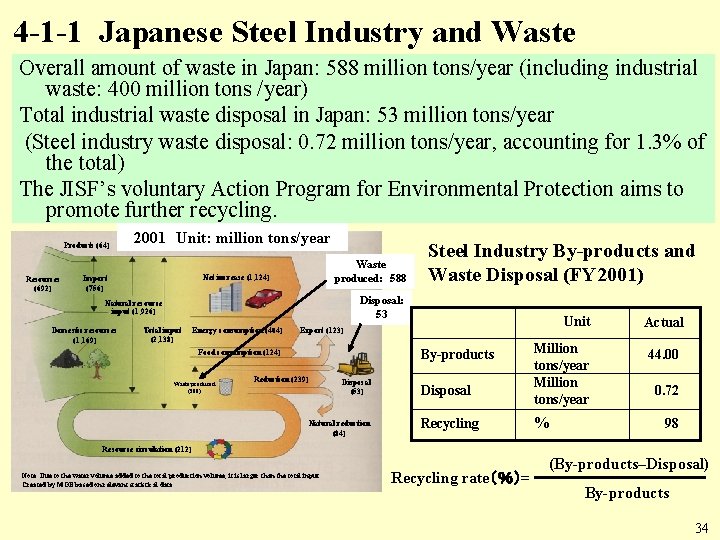
4 -1 -1 Japanese Steel Industry and Waste Overall amount of waste in Japan: 588 million tons/year (including industrial waste: 400 million tons /year) Total industrial waste disposal in Japan: 53 million tons/year (Steel industry waste disposal: 0. 72 million tons/year, accounting for 1. 3% of the total) The JISF’s voluntary Action Program for Environmental Protection aims to promote further recycling. Products (64) Resources (692) 2001 Unit: million tons/year Waste produced: 588 Net increase (1, 124) Import (756) Disposal: 53 Natural resource input (1, 926) Domestic resources (1, 169) Steel Industry By-products and Waste Disposal (FY 2001) Total input (2, 138) Energy consumption (404) By-products Food consumption (124) Waste produced (588) Unit Export (123) Reduction (239) Disposal (53) Natural reduction (84) Disposal Recycling Million tons/year % Actual 44. 00 0. 72 98 Resource circulation (212) Note: Due to the water volume added to the total production volume, it is larger than the total input. Created by MOE based on relevant statistical data Recycling rate(%)= (By-products–Disposal) By-products 34
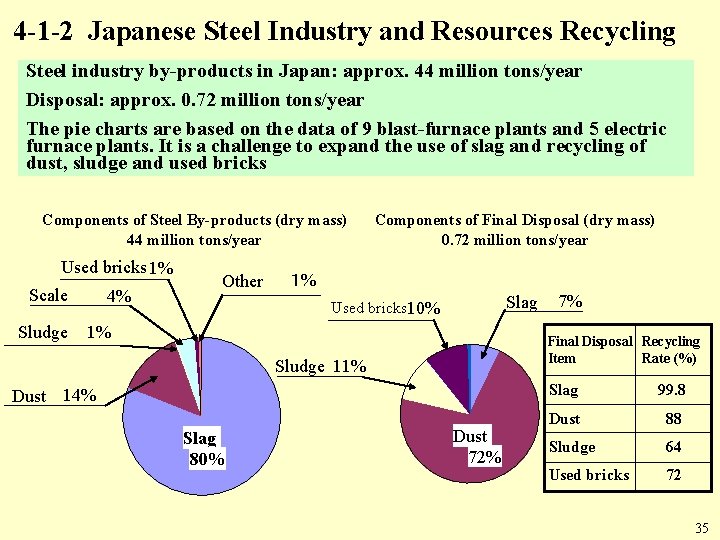
4 -1 -2 Japanese Steel Industry and Resources Recycling Steel industry by-products in Japan: approx. 44 million tons/year Disposal: approx. 0. 72 million tons/year The pie charts are based on the data of 9 blast-furnace plants and 5 electric furnace plants. It is a challenge to expand the use of slag and recycling of dust, sludge and used bricks Components of Steel By-products (dry mass) 44 million tons/year Used bricks 1% Scale Sludge 4% Other Components of Final Disposal (dry mass) 0. 72 million tons/year 1% Slag Used bricks 10% 1% Final Disposal Recycling Rate (%) Item Sludge 11% Dust 14% Slag 80% 7% Dust 72% Slag 99. 8 Dust 88 Sludge 64 Used bricks 72 35
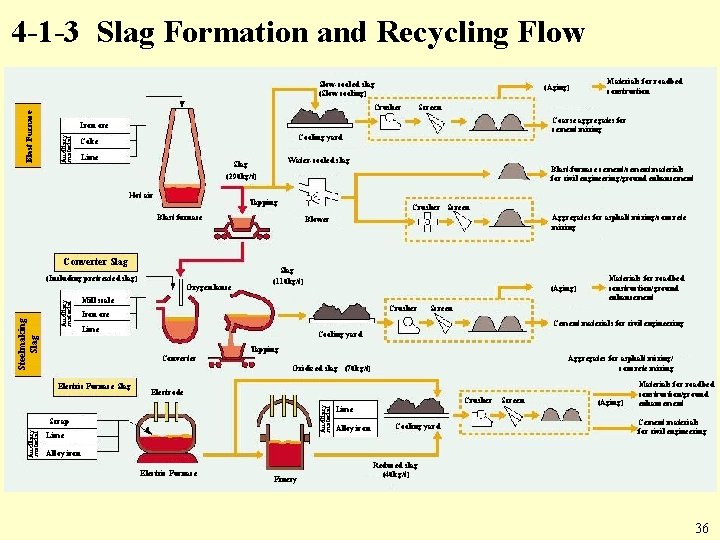
4 -1 -3 Slag Formation and Recycling Flow (Aging) Crusher Coarse aggregates for cement mixing Cooling yard Coke Lime Water-cooled slag Slag Blast-furnace cement/cement materials for civil engineering/ground enhancement (290 kg/t) Hot air Tapping Crusher Screen Blast furnace Converter Slag (Including pretreated slag) Auxiliary material Slag (110 kg/t) (Aging) Mill scale Crusher Iron ore Materials for roadbed construction/ground enhancement Screen Cement materials for civil engineering Lime Cooling yard Tapping Converter Aggregates for asphalt mixing/ concrete mixing Oxidized slag (70 kg/t) Electric Furnace Slag Electrode Crusher Scrap Auxiliary material Aggregates for asphalt mixing/concrete mixing Blower Auxiliary material Steelmaking Slag Oxygen lance Materials for roadbed construction Screen Iron ore Auxiliary material Blast Furnace Slow-cooled slag (Slow cooling) Lime Alloy iron Cooling yard Screen (Aging) Materials for roadbed construction/ground enhancement Cement materials for civil engineering Alloy iron Electric Furnace Finery Reduced slag (40 kg/t) 36
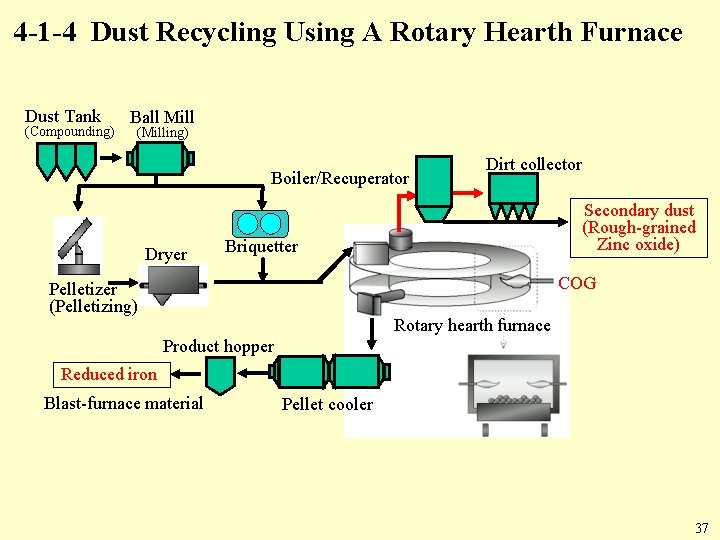
4 -1 -4 Dust Recycling Using A Rotary Hearth Furnace Dust Tank (Compounding) Ball Mill (Milling) Boiler/Recuperator Dryer Dirt collector Secondary dust (Rough-grained Zinc oxide) Briquetter COG Pelletizer (Pelletizing) Rotary hearth furnace Product hopper Reduced iron Blast-furnace material Pellet cooler 37
4 -2 Contributions to Facilitating Waste Disposal of Other Industries ● Waste Plastic Recycling ● Waste Tire Recycling 38
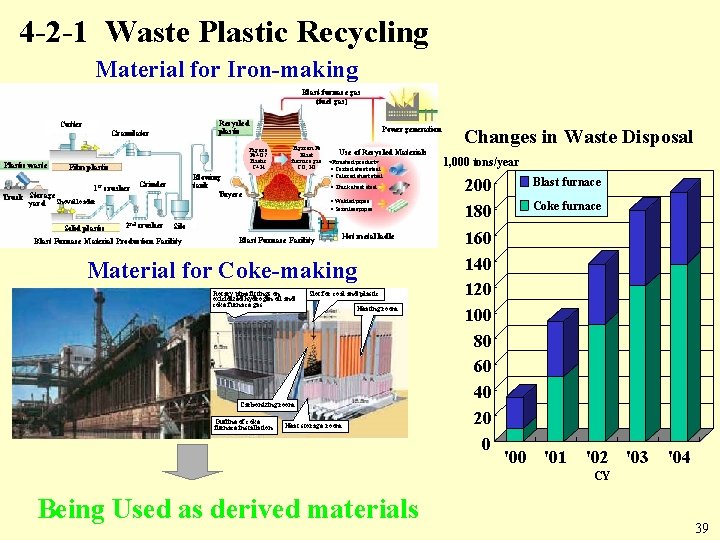
4 -2 -1 Waste Plastic Recycling Material for Iron-making Blast-furnace gas (fuel gas) Recycled plastic Cutter Granulator Plastic waste Pig ore Fe+O? Plastic C+H Film plastic 1 st crusher 2 nd crusher Pig iron Fe Blast furnace gas CO, H 2 Blowing tank Tuyere Grinder Truck Storage yard Shovel loader Solid plastic Power generation Use of Recycled Materials <Finished product> ・Coated sheet steel ・Colored sheet steel ・Thick sheet steel ・Welded pipes ・Seamless pipes Silo Blast Furnace Material Production Facility Blast Furnace Facility Hot metal ladle Material for Coke-making Rotary pipe fittings on oxicidized hydrogen oil and coke furnace gas Slot for coal and plastic Heating room Carbonizing room Outline of coke furnace installation Heat storage room Changes in Waste Disposal 1, 000 tons/year 200 180 160 140 120 100 80 60 40 20 0 Blast furnace Coke furnace '00 '01 '02 '03 '04 CY Being Used as derived materials 39
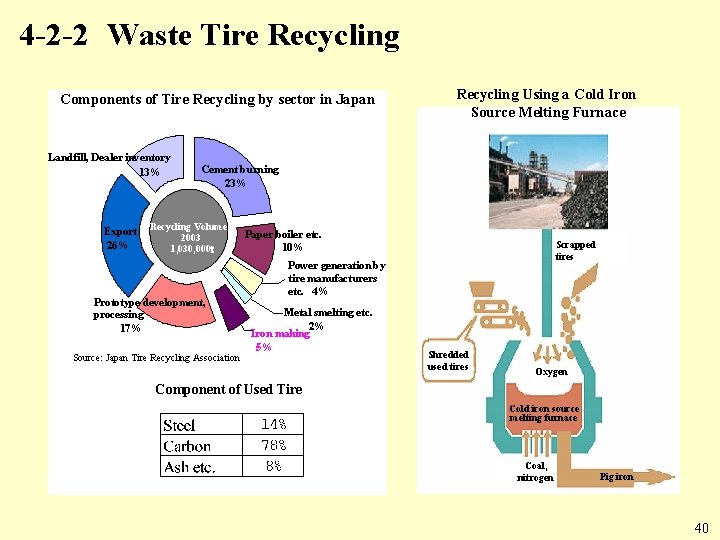
4 -2 -2 Waste Tire Recycling Components of Tire Recycling by sector in Japan Landfill, Dealer inventory 13% Export 26% Recycling Using a Cold Iron Source Melting Furnace Cement burning 23% Recycling Volume 2003 1, 030, 000t Prototype development, processing 17% Source: Japan Tire Recycling Association Paper boiler etc. 10% Scrapped tires Power generation by tire manufacturers etc. 4% Metal smelting etc. 2% Iron making 5% Shredded used tires Oxygen Component of Used Tire Cold iron source melting furnace Coal, nitrogen Pig iron 40
5. Work in Progress of Currently Developing New Technologies/Facilities ● Next generation coke ovens (SCOPE 21) ● Coal-reduced iron using rotary hearth furnaces (FASTMET) ● Hydrogen refining by COG reforming ● Blowing natural gas into blast furnaces (use of hydrogen reduction) ● Further use of slag in the area of ocean development ●・・・・・・・ 41
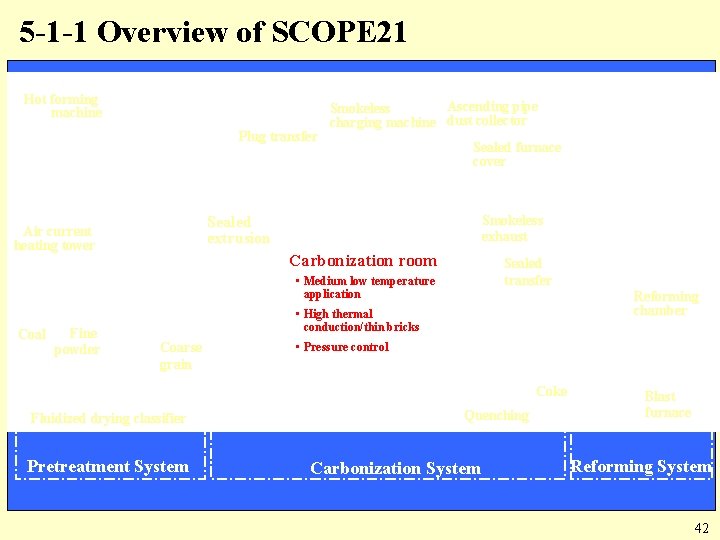
5 -1 -1 Overview of SCOPE 21 Hot forming machine Plug transfer Ascending pipe Smokeless charging machine dust collector Sealed furnace cover Smokeless exhaust Sealed extrusion Air current heating tower Carbonization room Sealed transfer ・Medium low temperature application Coal Fine powder Reforming chamber ・High thermal conduction/thin bricks Coarse grain ・Pressure control Coke Fluidized drying classifier Pretreatment System Quenching Carbonization System Blast furnace Reforming System 42
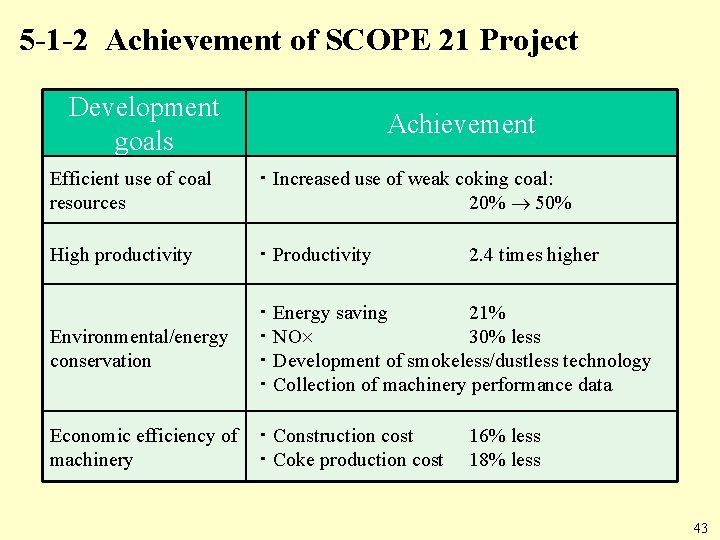
5 -1 -2 Achievement of SCOPE 21 Project Development goals Achievement Efficient use of coal resources ・Increased use of weak coking coal: 20% 50% High productivity ・Productivity Environmental/energy conservation ・Energy saving 21% ・NO 30% less ・Development of smokeless/dustless technology ・Collection of machinery performance data Economic efficiency of ・Construction cost machinery ・Coke production cost 2. 4 times higher 16% less 18% less 43
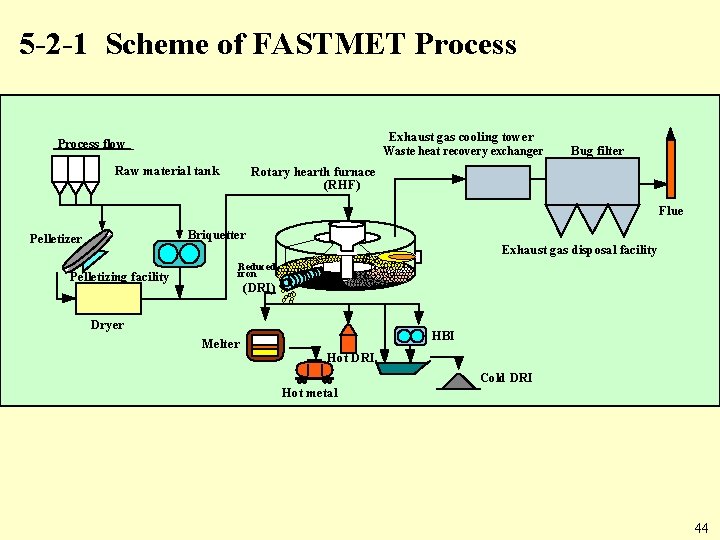
5 -2 -1 Scheme of FASTMET Process Exhaust gas cooling tower Process flow Waste heat recovery exchanger Raw material tank Bug filter Rotary hearth furnace (RHF) Flue Briquetter Pelletizer Exhaust gas disposal facility Pelletizing facility Reduced iron (DRI) Dryer HBI Melter Hot DRI Cold DRI Hot metal 44
6. Conclusion ● Environmental issues pose one of the most significant challenge for the steel industry in achieving its sustainable development. ● Japan has made considerable achievements in developing internationally recognized eco-technologies. ● Environmental issues are also a borderless challenge and would require close collaboration among Korea, China and Japan. ● Increased trilateral cooperation in response to these environmental challenges forms the basis of mutual confidence for a future FTA. 45

- Slides: 46