Total Solar Irradiance and its Relation to Solar


- Slides: 33

Total Solar Irradiance and its Relation to Solar Activity Claus Fröhlich CH 7265 Davos Wolfgang 11. 03. 2021 05: 48: 28 ISSI Forum Solar Activity, Novemebrl, 20 -21 2012 1

Outline § TSI as PMOD-Composite: what is special about the last 3 cycles • comparison with proxies of solar activity § A proxy model may help to «understand» the solar activity influence • • PSI and time of minima Mg. II index Do we need a trend ? Calibration during the last 3 cycles § Reconstruction of TSI and Ly-α back to 1915 § Why is the long-term behaviour of TSI and UV irradiance different? 11. 03. 2021 05: 48: 28 ISSI Forum Solar Activity, November , 20 -21 2012 2

PMOD-Composite of TSI § Data updated to end of October 2012. Composite and for VIRGO data are vailable from http: //www. pmodwrc. ch/pmod. php? topic=tsi/composite/Solar. Constant http: //www. pmodwrc. ch/pmod. php? topic=tsi/virgo/proj_space_virgo 11. 03. 2021 05: 48: 28 ISSI Forum Solar Activity, November , 20 -21 2012 3

11. 03. 2021 05: 48: 29 ISSI Forum Solar Activity, November , 20 -21 2012 4

TSI – BR Correlation 11. 03. 2021 05: 48: 30 ISSI Forum Solar Activity, November , 20 -21 2012 5

Photometric Sunspot Index PSI Sunspots can be modeled from their area and position on the disk by using an appropriate contrast. The result is the photometric sunspot index (PSI) 11. 03. 2021 05: 48: 32 IISSI Forum Solar Activity, Novemebrl, 20 -21 2012 6

PSI during the last 3 cycles 11. 03. 2021 05: 48: 33 ISSI Forum Solar Activity, November , 20 -21 2012 7

PSI during the last 3 cycles 11. 03. 2021 05: 48: 35 ISSI Forum Solar Activity, November , 20 -21 2012 8

Determination of Mimima 11. 03. 2021 05: 48: 36 ISSI Forum Solar Activity, November , 20 -21 2012 9

PSI during the last 3 cycles 11. 03. 2021 05: 48: 38 ISSI Forum Solar Activity, November , 20 -21 2012 10

Mg. II Index as Proxy for Faculae and Network 11. 03. 2021 05: 48: 38 ISSI Forum Solar Activity, November , 20 -21 2012 11

How to include a Trend ? 11. 03. 2021 05: 48: 41 ISSI Forum Solar Activity, November , 20 -21 2012 12

From Emmert & Picone, JGR, 2011 11. 03. 2021 05: 48: 42 ISSI Forum Solar Activity, November , 20 -21 2012 13

How to define the Trend between Minima 11. 03. 2021 05: 48: 43 ISSI Forum Solar Activity, November , 20 -21 2012 14

Comparison with Properties of Sunspots 11. 03. 2021 05: 48: 44 ISSI Forum Solar Activity, November , 20 -21 2012 15

Ingredients of the Proxy Model 11. 03. 2021 05: 48: 46 ISSI Forum Solar Activity, November , 20 -21 2012 16

Result of the Model Calibration 11. 03. 2021 05: 48 ISSI Forum Solar Activity, November , 20 -21 2012 17

Data back to 1875 11. 03. 2021 05: 48: 50 ISSI Forum Solar Activity, November , 20 -21 2012 18

Transformation of Ca. K to Mg. II via F 10. 7 11. 03. 2021 05: 48: 52 ISSI Forum Solar Activity, November , 20 -21 2012 19

PSI 1875 -1919 11. 03. 2021 05: 48: 54 ISSI Forum Solar Activity, November , 20 -21 2012 20

PSI 1919 -1971 11. 03. 2021 05: 48: 55 ISSI Forum Solar Activity, November , 20 -21 2012 21

Open Field 1875 -2012 11. 03. 2021 05: 48: 56 ISSI Forum Solar Activity, November , 20 -21 2012 22

Timeseries back 1915 for the Proxy Model 11. 03. 2021 05: 48: 58 ISSI Forum Solar Activity, November , 20 -21 2012 23

Calibration of the Proxy Model back to 1915 11. 03. 2021 05: 48: 59 ISSI Forum Solar Activity, November , 20 -21 2012 24

Proxy Model for Ly-α 11. 03. 2021 05: 49: 02 ISSI Forum Solar Activity, November , 20 -21 2012 25

Ly-α Proxy Model Comparison 11. 03. 2021 05: 49: 03 ISSI Forum Solar Activity, November , 20 -21 2012 26

11. 03. 2021 05: 49: 05 ISSI Forum Solar Activity, November , 20 -21 2012 27

11. 03. 2021 05: 49: 07 ISSI Forum Solar Activity, Novemebrl, 20 -21 2012 28

Where are these differences in longterm behaviour come from? § Both are influenced by the surface magnetic fields outside sunspots for which the Mg. II index is an excellent proxy § From the minimum in 1996 to the one in 2008 the surface magnetic fields (outside sunspots) changed by about 5 -7% and so did the UV irradiance as e. g. Ly-α. § TSI changed by 25% - what is responsible for the factor of 5. The answer is a substantial increase of the contrast with decreasing magnetic flux which is only observed in radiation originating at the photosphere (e. g. Spruit model). If the low fields are lowered TSI is lowered over-proportional. 11. 03. 2021 05: 49: 08 ISSI Forum Solar Activity, November , 20 -21 2012 29

Increase of the specific contrast § This effect has been observed already in the 70 ties, but the first quantification for Tsi was with MDI data by Ortiz et al, A&A, 2006 and more recently by Schnerr & Spruit, ASP, 2011. The latter claim that the small magnetic fields in quiet regions (most probably from the surface dynamo and independent of activity) increase TSI by as much as 0. 15% over a hypothetical really quite sun. From these estimates the activity related magnetic field during the last minimum producing the low TSI was only a small amount above the background. This may mean that we cannot expect the TSI during the Maunder minimum much below the value in 2008 or 1920. 11. 03. 2021 05: 49: 08 ISSI Forum Solar Activity, November , 20 -21 2012 30

What is the reason for the difference between EUV and UV § The EUV radiation as obverved by SEM/SOHO shows a change over the last cycle of about 10 -12%, which means it is about twice the 5 -7% effect due to the magnetic field. § Thus it cannot be explained with a model based on F 10. 7, as done by Emmert & Picone (slide 13= § The reason could be the extra nano flares which are also closely linked to the strength of the activity and hence may be able to double the activity related change. So, as for TSI a ‘trend’ is needed to describe the extra effect. 11. 03. 2021 05: 49: 09 ISSI Forum Solar Activity, November , 20 -21 2012 31

Thanks The presentation is available from ftp: //ftp. pmodwrc. ch/pub/claus/ISSIForum 2012/ISSI_Forum 2012_CF. pptx after I have corrected the problems with the symbol font 11. 03. 2021 05: 49: 09 ISSI Forum Solar Activity, Novemebrl, 20 -21 2012 32

Increase of Contrast with lower magnetic flux density The coefficients of the multiple regression are different for the long and short term Mg. II: Mg. II shortterm is 93 and for the longterm 120, the difference may be explained by the difference in specific contrast of the network and faculae as shown by Ortiz (2005) from MDI data. From this it becomes evident, that the solar cycle variation is mostly determined by the network, whereas faculae only contribute to active region variability 11. 03. 2021 05: 49: 10 ISSI Forum Solar Activity, Novemebrl, 20 -21 2012 33
 Irradiance environment map
 Radiance to irradiance conversion
 An efficient representation for irradiance environment maps
 Inverse square law irradiance
 Vray global illumination
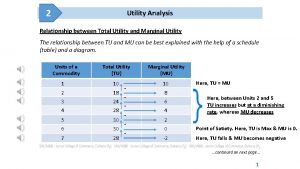
 Relation between marginal utility and total utility
 Total order relation
 Activo promedio
 Total revenues minus total costs equals
 Total revenues minus total costs equals
 Total revenues minus total costs equals
 Total revenue minus total expenses
 Form of emigree
 Its halloween its halloween the moon is full and bright
 Wholesale solar battery
 Inexhaustible source of energy
 When a train increases its velocity its momentum
 Its cloudy its sunny
 If its square its a sonnet summary
 Its not easy but its worth it
 Relation between pressure and kinetic energy of gas
 C b e transistor
 Usp solubility
 Relation between ac and mc in economics
 Relation and function example
 Banker customer relation
 Relation between political science and economics
 Relationship between angular and linear quantities
 A uniformly charged conducting sphere
 Codomain
 The pressure intensity
 Sociology vs political science
 Relationship between political science and psychology
 Horizontal jaw


