TOT Y 3 D 3 Tier 3 InstructionIntervention


 Calculating instructional minutes: Daily minutes for annual 3 rd")
 Dividing the total minutes (400) between 3 rd and")


: District to provide proof that: • Research-based instruction/intervention provided at")


Integrity may not impact performance 2)Poor implementation")


")


 Assessed Type of Duration of Assessment Where")


 • MATH CBM")


 - Number of Tasks \"Meeting Benchmark\" Student A Benchmark 8")


- Slides: 63
TOT Y 3 D 3 Tier 3: Instruction/Intervention Design & Integrity Progress Monitoring School Implementation Blueprints A collaborative project between the Florida Department of Education and the University of South Florida
Advance Organizer • Y 3 D 2 Content Review • Skill Assessment Review • T 3 Intervention Design – Intervention Integrity • T 3 Progress Monitoring • Review of Randy - Comprehensive Intervention Plan Columns 4 -5 – Step 4 Student Success Worksheet • Surveys - Personnel Satisfaction, Perceptions of Practices • School Blueprint – Implementation 2
Annual Growth/Catch-up Growth, Tier 3 Intervention Design YEAR 3, DAY 2 REVIEW 3
Review: Annual & Catch-up Growth • Each year of instruction in core subject yields one year annual growth • Students who are behind must achieve annual growth PLUS • Primary driver of catch-up growth is increased instructional time 4
Review: Kenewick’s formula 13 percentile pts. = one year’s growth • • Gr. 4 State standard: Target 2 nd grader: The difference: Point difference divided by 13: 50 th percentile 12 th percentile 38 points 2. 9 yrs. Behind Example taken from Annual Growth…Catch-up Growth, Fielding et al. , 2007 5
Review: Kenewick’s formula (cont. ) Calculating instructional minutes: Daily minutes for annual 3 rd gr. growth: 80 Daily minutes for annual 4 th gr. growth: 80 Additional daily minutes to make three years of catch-up growth: 240 Total 3 rd/4 th grade daily minutes: 400 6
Review: Kenewick’s formula (cont. ) Dividing the total minutes (400) between 3 rd and 4 th grade shows that the student needs 200 minutes of direct reading instruction in both 3 rd and 4 th grades to reach the 50 th percentile by the end of fourth grade. 7
Review: Tier 3 Intervention Design • Purpose is instructional match • Adjusts what is taught and/or how it is taught • Evidence-base for Tier 3 instruction relies on careful progress monitoring 8
Review: Tier 3 Intervention Design 9
Review Y 3 D 2 Skill Assessment 10
Skill Assessment Review Guiding Questions • 1. Which components of developing a comprehensive intervention plan did your team complete successfully? For which components did the team have difficulty? What factors helped or hindered the team when developing the comprehensive intervention plan to address the student’s needs? • 2. How helpful was it to your team to specifically outline the intervention and support plans (i. e. , who was responsible, what would be done, when it would occur, and where it would occur)? • 3. If your team was able to return to your school and implement the plan developed at the last training, to what extent did the level of specificity help ensure that the plan was implemented? • 4. If your team was able to return to your school and implement the plan developed at the last training, to what extent did the support plan you developed for the individuals responsible for implementing the intervention help ensure that the intervention was implemented as intended? 11
Tier 3 Considerations INTERVENTION INTEGRITY 12
Importance of integrity: • Rapid and widespread deployment of Rt. I has made urgent the need to attend to integrity • Integrity data are essential to making valid conclusions about outcomes • Issues related to integrity are central to the success of Rt. I (Sanetti and Kratochwill, 2009) 13
Best-practice/legal guidelines: • Evidence of exposure to appropriate instruction in general education setting • Adherence to Problem Solving steps • “Interventions shall be implemented as designed…and with a level of intensity that matches student’s needs. ” (FL Gen. Ed. Intervention Procedures— 6 A-6. 0331) 14
Best practice/legal guidelines (con’t): District to provide proof that: • Research-based instruction/intervention provided at each tier • Rt. I process consists of multiple tiers with defined decision points • Intervention team considers continuous progress monitoring data • Students provided appropriate instruction in gen. ed. setting delivered by qualified personnel. (Zirkel, 2008) 15
Parent involvement • Discussion with parent re: student Rt. I, supporting data, adjustments to interventions, and future action • Data-based/graphic documentation of repeated assessments at reasonable intervals provided to parents • Documentation of parental involvement and communication must be maintained (FL Gen. Ed. Intervention Procedures 6 A-6. 0331) 16
Another definition of Integrity: “Treatment integrity is the extent to which essential intervention components are delivered in a comprehensive and consistent manner, by an interventionist trained to deliver the intervention. ” (Sanetti & Kratochwill, 2009) 17
Dimensions of integrity: • Content—what steps were delivered • Quantity—how much was delivered • Quality—how well the steps were delivered • Process—how the intervention was delivered (Sanetti & Kratochwill, 2009) 18
Effective interventions… • Interventionist adequately delivers critical elements of the intervention • Student is present and engaged when intervention delivered • Student masters skills and is able to use them • Use of skills is associated with improved outcomes for student (Schulte, Easton & Parker, 2009) 19
Integrity elements to consider: • Delivery vs. Receipt • Simple vs. Complex interventions • Adherence vs. Adaptation • Adaptation vs. Drift 20
Intervention “adaptation” Use of expertise to intentionally modify an intervention to meet the needs of a particular student, or group of students. When might low integrity result in increased outcomes for students? 21
Interventionist “drift” Unplanned, gradual altering of the implementation of an intervention by the interventionist. What might contribute to this? 22
What degree of implementation is required? Consider: 1)Integrity may not impact performance 2)Poor implementation may cloak effective intervention 3)Intervention components may not be equally important 4)Level of necessary integrity varies 5)Goal should be effectiveness 23
Allocating integrity assessment resources: • Why do you need the data? • Which treatment integrity methods are best matched to target areas? • What decisions will be made using the data? • What resources are available to collect that data? 24
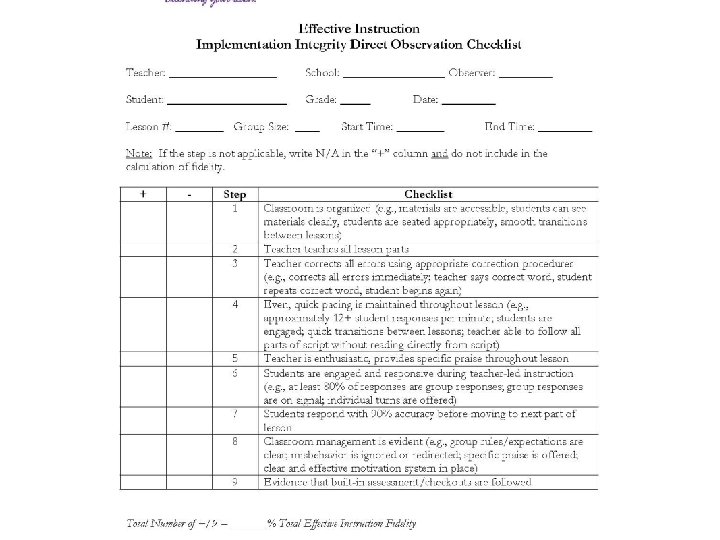
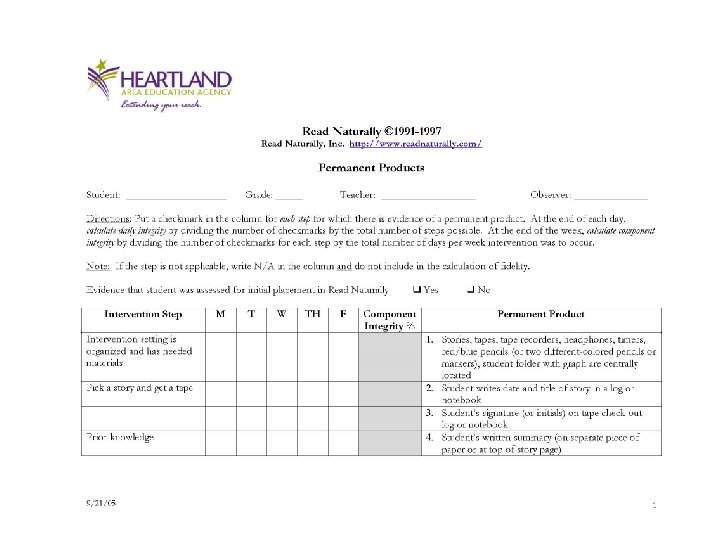
Types of integrity assessment • • Direct observation Behavior rating scales Self-report Permanent products 25
Self-report Example (Lane & Beebe-Frankenberger, 2004)
Intervention Documentation Worksheet
Resources: • http: //www. aea 11. k 12. ia. us/idm integrity assessment checklists— available for download • Lane, K. and Beebe-Frankenberger, M. (2004). School-Based Interventions: The Tools You Need to Succeed. Boston, MA: Allyn & Bacon/Pearson Education, Inc. 30
Practical considerations: • • • Student Rt. I data Frequency of assessment Impact of observer Use of multiple methods Feasibility 31
Performance feedback: The only strategy, to date, proven to promote high levels of treatment integrity in education settings. Components: 1)Graphed integrity data (percentage of steps correctly implemented, e. g. ) 2)Verbal recommendations re: intervention steps that need improvement 32
Tier 3 Integrity Group Activity: What integrity measures are currently in place at your school to assess Tier 3 interventions? What changes need to occur so that integrity of Tier 3 intervention is being adequately assessed and documented? How is parent involvement for students receiving Tier 3 interventions implemented and documented? 33
Tier 3 PROGRESS MONITORING 34
Planning for Data Use “Research has found that up-front planning helped make data collection and use more efficient in many case study schools by clarifying what data were needed, aiding with integration of multiple data sources, and ensuring that data collection processes were on track (Keeney, 1998; Lachat, 2001). ” -Kerr, et al. , (2006). Strategies to promote data use for instructional improvement: Actions, outcomes, and lessons learned from three urban districts. American Journal of Education, 112, 496 -520. 35
Table Talk Data use at Tier 3: • Do staff understand procedures and timelines for assessments at Tier 3? • Do staff have the skills to participate in Tier 3 data analysis? • How are you coordinating data collected at Tier 3 with data collected at Tiers 1 and 2? 36
“Evidence-based” at Tier 3 More Less Measurement Frequency Measurement Precision Evidence Base Measurement Focus Group Size Depth of Problem Analysis Instructional Time Less More 37
Purpose of Progress Monitoring • Evaluate student Rt. I • Encourage accountability and fidelity of intervention implementation • Inform accuracy of team problem-solving • Inform instruction/intervention across tiers 38
Tier 3 Progress Monitoring • Build on existing Tier 2 concepts and structures • Increased frequency of PM? New PM? • Coordinate multiple assessments across tiers • Mastery measurement or General Outcome Measurement? 39
Planning Data Collection • • Resource Map/Assessment Map School Calendar and Daily Schedule Existing infrastructure for Tiers 1 and 2 Scheduling Data school-wide (and keeping it sacred): – Examples: • • Tier 1: 1 week after assessment windows close Tier 2: 1 st Wednesday of every month; Tier 2: Every 20 instructional days Tier 3: Bi-weekly on Wednesdays • Identifying personnel to manage data 40
Mapping Your Assessments Name of Test Skill(s) Assessed Type of Duration of Assessment Where Given By Whom
PM Resources • http: //www. studentprogress. org/chart. asp • http: //www. rtinetwork. org/Essential/Assessment • http: //www. studentprogress. org/library/Webinars. asp#RTI • http: //www. rtinetwork. org/Essential/Assessment/Progress /ar/Linking. Monitoring/1 • http: //www. aea 11. k 12. ia. us/spedresources/Module. Four. p df (see Chapter 7, “Intervention Progress Monitoring”) 42
PM Resources • http: //www. rtitools. com/Progress_Monitoring/Tools/ • http: //www. jimwrightonline. com/php/rti_wire. php • http: //www. rti 4 success. org/chart/progress. Monitorin g/progressmonitoringtoolschart. htm • http: //www. rti 4 success. org/index. php? option=com_ content&task=view&id=1172&Itemid=150 (CBM manuals/tools) 43
Evaluating a Student’s Rt. I PLANNED DECISION MAKING 44
Increasing Instructional Precision • What to teach this student? • How the student best learns new information? (How will we teach him/her? ) • What intensive conditions result in student improvement? (What conditions do not? ) • What can be learned from this case to prevent similar problems in the future? 45
Ongoing Decision Making Evidence based intervention linked to verified hypothesis is planned Evidence based intervention is implemented Student Outcomes (SO) Assessed Treatment Integrity (TI) Assessed I +T O +S Data-based Decisions -SO From Lisa Hagermoser Sanetti, 2008 NASP Convention -TI +TI Continue Intervention Implement strategies to promote treatment integrity Modify/change Intervention
Ongoing Tier 3 Decision. Making Modify/change Intervention What do your data suggest? Did you. Are ID there any Any new Does. Is the current dosage. Does the right problem? other validated hypotheses? intervention appropriate? plan intervention match hypothesis to need tweeking orstudent need? consider? a complete redo?
Response to Intervention Questionable Performance Expected Trajectory Good Poor Observed Trajectory Time
Decisions What to do if Rt. I is: • Positive • Continue intervention with current goal • Continue intervention with goal increased • Fade intervention to determine if student has acquired functional independence. 49
Decisions What to do if Rt. I is: • Questionable – Was intervention implemented as intended? • If no - employ strategies to increase implementation integrity • If yes – Increase intensity of current intervention for a short period of time and assess impact. If rate improves, continue. If rate does not improve, return to problem solving. 50
Decisions What to do if Rt. I is: • Poor – Was intervention implemented as intended? • If no - employ strategies in increase implementation integrity • If yes – Is intervention aligned with the verified hypothesis or are there other aligned interventions to consider? (Intervention Design) – Are there other hypotheses to consider? (Problem Analysis) – Was the problem identified correctly? Identification) (Problem 51
Let’s Look at Some Examples • Reading Fluency with DIBELS (CBM) • MATH CBM • FAIR TDI Tasks 52
Student’s 2 nd Grade Reading Fluency 100 Repeated Readings w/ Graphing Baseline 90 80 Words Read Correct Per Minute 70 60 50 Oral Reading Fluency 50 Benchmark 45 40 40 32 30 20 18 20 21 24 41 35 Linear(Oral Reading Fluency) Linear(Benchmark) 27 10 0 1 2 3 4 5 6 7 8 9 10 11 12 13 14 15 16 17 18 19 20 21 22 23 24 25 26 27 28 29 30 31 32 33 Weeks Courtesy of San Antonio Elem. , Pasco County School District
Math CBM – Tier 3 Data Courtesy of Monroe County School District
FAIR TDI (First Grade) - Number of Tasks "Meeting Benchmark" Student A Benchmark 8 7 90 Minute Reading Block + Intervention A 90 Minute Reading Block + Intensified Intervention A # of Tasks Benchmark Met 6 5 4 3 2 1 0 Fall Assessment OPM 1 OPM 2 Winter Assessment Period OPM 3 OPM 4 Spring Assessment
Randy • Case Study Review • Randy • Comprehensive Intervention Plan: Documentation & Monitoring • Step 4 Student Success Worksheet • Your Student • Comprehensive Intervention Plan: Documentation & Monitoring • Step 4 Student Success Worksheet 56
Comprehensive Intervention Plan - Randy
Step 4 Student Success Worksheet - Randy 58
Comprehensive Intervention Plan - Your Student
Step 4 Student Success Worksheet - Your Student 60
Perceptions of Practices Survey Your project ID is: • Last 4 digits of SS# • Last 2 digits of year of birth 61
Personnel Satisfaction Survey Your project ID is: • Last 4 digits of SS# • Last 2 digits of year of birth 62
THANK YOU! 63