Torch Lake Water Quality Trends and the National

, Max. depth of 87 meters (288")


 30 25 20 15")

")
 100 80 60 40")
 0. 70 0.")


 From")


- Slides: 31
Torch Lake Water Quality Trends and the National Lakes Assessment Dennis Mc. Cauley and Michelle Vanden. Brand Great Lakes Environmental Center, Inc. , Traverse City, MI
Torch Lake 18, 770 acres (7, 596 hectares), Max. depth of 87 meters (288 feet), Average depth of 111 feet, Michigan’s deepest inland lake, 41 miles of shoreline, Approximately 2 miles wide (3. 2 Km) at its widest point. Michigan’s second largest lake; second to Houghton Lake (20, 044 acres).
TORCH LAKE WATER QUALITY TRENDS • DATA SOURCES – 1990 -2017 – Antrim County Conservation District – Cooperative Lake Monitoring Data – 2017 National Lakes Assessment • • Water Transparency Chlorophyll @ Total Phosphorus Temperature
SUMMARY OF WATER QUALITY PARAMETERS FOR THE NORTH AND SOUTH BASINS OF TORCH LAKE: 1976 -2017 Minimum value (date recorded) Maximum value (date recorded) Average Number of data points 14 (September 2004) 3. 3 23 Torch Lake, South 1. 5 (12 events) 1. 5 (13 Events) (2004) 3. 5 26 Torch Lake, North 12 (September 2004) 45 (June 2007) 27 323 11 (September 1995) 0. 12 (June 1996) 0. 05 (July 1995) 11. 7 (June 2003) 16. 0 (June 2003) 52 (June 2017) 1. 20 (July 1990) 1. 40 (June 1990) 21. 6 (August 2003) 28. 3 (June 2001) 25 356 0. 45 105 0. 43 128 17. 7 12 21. 5 22 14. 4 (September 1997) 15. 6 (June 1994) 26. 7 (September 1996) 31. 1 (August 1995) 23. 0 23 21. 6 59 Parameter Location Total Phosphorus (µg/L) Torch Lake, North Secchi Disk Depth (feet) Torch Lake, South Chlorophyll a (µg/L) Torch Lake, North Torch Lake, South Water Temperature (°C) Torch Lake, North Torch Lake, South Air Temperature (°C) Torch Lake, North Torch Lake, South
Secchi Disk Depth Yearly Averages 40 35 Secchi Depth (ft) 30 25 20 15 10 5 0 1966 1976 1986 Torch Lake, North 1996 2006 Torch Lake, South 2016 2026
Seasonal Variation in Secchi Disk Depth for Torch Lake, North 50 45 40 Secchi Depth (ft) 35 30 25 20 15 10 5 0 2004 2005 2006 2007 2008 2009 2010 2011 2012 2013 2014 2016 2017
Seasonal Variation in Secchi Disk Depth for Torch Lake, South 60 Secchi Depth (ft) 50 40 30 20 10 0 2004 2005 2006 2007 2008 2009 2010 2011 2012 2013 2014 2016 2017
Secchi Disk Depth Box Plot 120 Depth from Surface (Feet) 100 80 60 40 20 n=323 n=356 0 Torch Lake, North Torch Lake, South
Chlorophyll a Yearly Averages 0. 90 0. 80 Chlorophyll a (µg/L) 0. 70 0. 60 0. 50 0. 40 0. 30 0. 20 0. 10 0. 00 6/12/1905 12: 00 AM 6/17/1905 12: 00 AM 6/22/1905 12: 00 AM Torch Lake, North 6/27/1905 12: 00 AM 7/2/1905 12: 00 7/7/1905 12: 00 AM AM Torch Lake, South
BOX PLOT OF CHLOROPHYLL @ DATA FOR THE NORTH AND SOUTH BASINS OF TORCH LAKE: 1990 -2003 Chlorophyll a Box Plot 3. 00 Chlorophyll a (µg/L) 2. 50 2. 00 1. 50 1. 00 0. 50 0. 00 Torch Lake, North Torch Lake, South
TOTAL PHOSHORUS DATA FOR THE NORTH AND SOUTH BASINS OF TORCH LAKE: 1990 -2017 Total Phosphorus Yearly Averages 16 14 Total Phosphorus (µg/L) 12 10 8 6 4 2 0 2002 2004 2006 Torch Lake, North - Spring 2008 Torch Lake, North - Summer 2010 2012 Torch Lake, South - Spring 2014 2016 Torch Lake, South - Summer 2018
SEASONAL VARIATION IN TOTAL PHOSPHORUS CONCENTRATION FOR THE NORTH BASIN OF TORCH LAKE: 2004 -2017 Total Phosphorus in Torch Lake, North 16 Total Phosphorus (µg/L) 14 12 10 8 6 4 2 0 2004 2005 2006 2007 2008 2009 2010 2011 2012 2013 2014 2016 2017
SEASONAL VARIATION IN TOTAL PHOSPHORUS CONCENTRATION FOR THE SOUTH BASIN OF TORCH LAKE: 2004 -2017 Total Phosphorus in Torch Lake, South 14 Total Phosphorus (µg/L) 12 10 8 6 4 2 0 2004 2005 2006 2007 2008 2009 2010 2011 2012 2013 2014 2016 2017
Future Monitoring • Standardized data collection • Field and Laboratory Quality Control • Choose the parameters for long-term trend monitoring • Ice Cover
Torch Lake 2017 National Lakes Assessment The Watershed Center – Grand Traverse Bay • Funding Partners: • Dole Family Foundation • Three Lakes Association • Torch Conservation Center • Torch Lake Protection Alliance
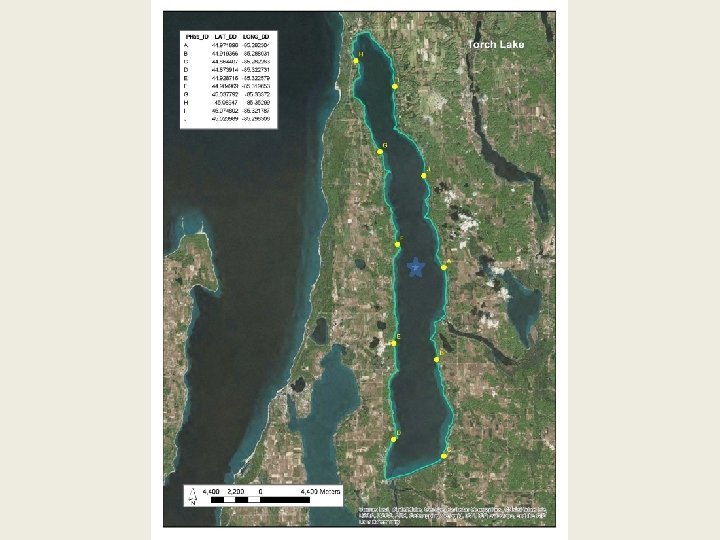
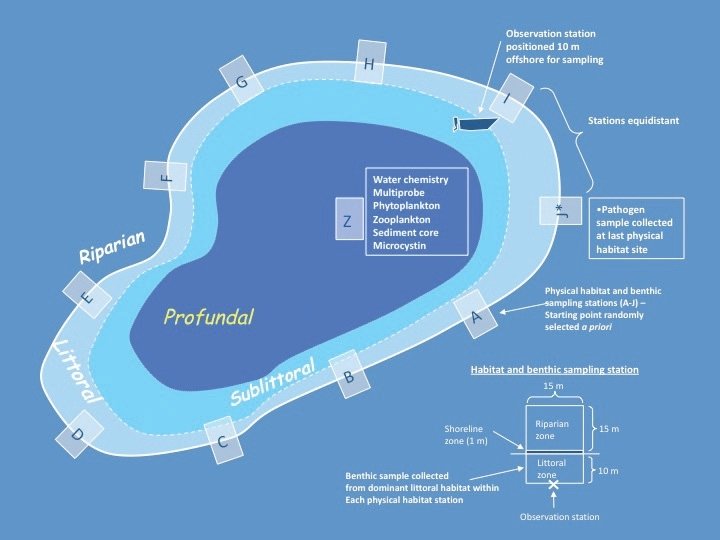
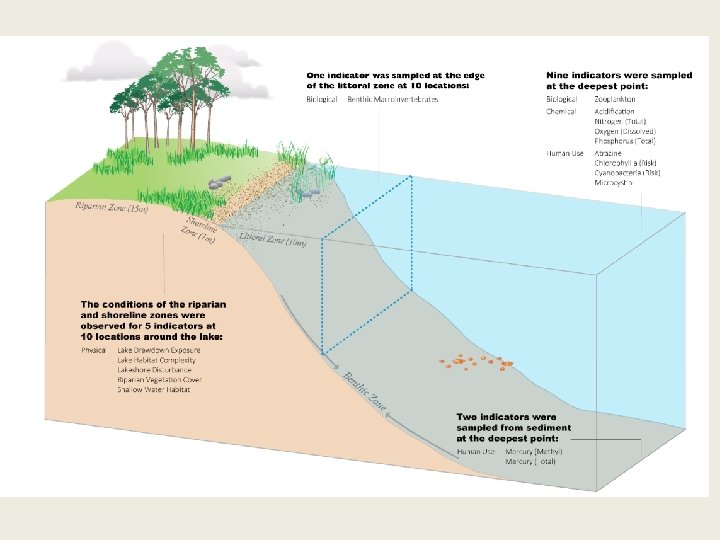
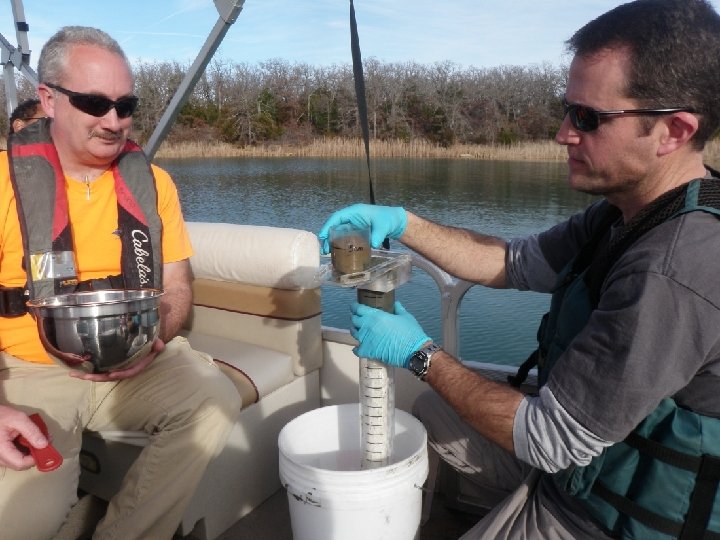
2017 National Lakes Assessment
Torch Lake “X” Point 44. 960000 N and -85. 29362 W
Least-disturbed Reference Screening Filter Thresholds for NLA 2012 (Upper Midwest Ecoregion is labeled as UMW ) WMT = Western Mountains; 2 XER = western Xeric, 3 NPL = Northern Plains, 4 SPL = Southern Plains, 5 TPL = Temperate Plains, 6 UMW = Upper Midwest, 7 Central Plains, 8 Southern Appalachians, 9 NAP = Northern Appalachians, 10 Lakeshore Physical Habitat disturbances; non-agricultural, 11 Lakeshore Physical Habitat disturbances; agricultural, 12 Sum of agricultural/residential/industrial human disturbances 1 WMT 1 XER 2 NPL 3 SPL 4 TPL 5 UMW 6 CPL 7 SAP 8 NAP 9 TP (ug/L) >30@ TN (ug/L) >400 Cl (ueq/L) >100# SO 4 (ueq/L) >200 Turbidity (NTU) >3 Hii-Non. Ag 10 >0. 6 Hii-Ag 11 Assessment (Ag/Res/Ind)12 >0 > 5/5/5 >1000 >500 >1000 >5 >1. 5 >0. 2 > 5/5/5 >150 >2000 >1000 --- >5 >1. 5 >0. 5 > 10/6/6 >150* >2000* >1000 --- >5 >1. 5 >0. 5 > 10/6/6 >120 >2000 >1000 >5. 5 >1. 7 >0. 15 > 9/9/9 >40 >1200 >200 >5 >0. 6 >0 > 5/5/5 >50 >1200 >1000 >400 >5 >1. 0 >0 > 6/10/6 >35 >800 >125 >300 >5 >0. 9 >0 > 6/6/6 >30 >600 >100# >300 >5 >0. 6 >0 > 6/6/6
Water and Sediment Quality Analysis: Torch Lake 2017 NLA Indicators Sample Type Water chemistry nutrients Torch Lake Results Analyses Bacteria Algal Toxin Sediment p. H TOTAL PHOSPHORUS TKN Chlorophyll a E. coli Total Coliforms Microcystin Total Organic Carbon Sediment grain size Sediment Sediment Chlorinated Pesticides Total PCBs Total PAHs Percent Solids Metals (µg/L) : Aluminum Antimony Arsenic Cadmium Chromium Copper Iron Lead Manganese Mercury Nickel Selenium Silver Tin Vanadium Zinc Triazine Pesticides (water) Atrazine Screen 8. 24 <0. 0007 0. 458 mg/L 0. 00033 mg/L <1 (MPN) 5. 2 (MPN) 0. 001 µg/L 3. 8% Clay: 26. 1%, Sand: 35. 0%, Silt: 29. 1% <1 ng/dry gram (<mdl) 14. 0 ng/dry gram 73. 8% 3249/3640 0/0 4. 16/4. 12 0/0 5. 9/6. 2 5. 9/7. 6 5665/5667 1. 7/1. 7 179/178 0. 0053/0. 0046 3. 4/3. 4 0. 091/0. 112 0/0 0. 45/0. 52 10. 7/10. 9 8. 2 0 µg/L
Dissolved Oxygen and Temperature Profile of Torch Lake July 5, 2017 0 5 10 Depth (meters) 15 20 25 30 35 40 45 50 0. 0 5. 0 10. 0 15. 0 Temperature (Celsius) and Dissolved Oxygen (mg/L) Temperature Profile Dissolved Oxygen Profile 20. 0 25. 0
Comparison of Selected Water Quality and Physical Habitat Indices (Rating Over Index Value) From Two Northern Michigan Lakes and Torch Lake Chl. 2 @ Drawdown Lit. Cvr 3 Lit. Rip. Cvr 4 RDIS 5 RVeg. 6 Total Phosphorus (mg/L) Sechi Depth (m) Lake Trophic Status DO 1 Torch Oligotrophic High Good (0. 00033) small Poor (2. 91) Poor (1. 5) Poor (0. 427) Poor (0. 11) <0. 0007 11. 5 Clear Oligotrophic High Good Med. Poor (0. 071) Poor (0. 305) Fair (0. 487) Poor (0. 447) 21 8. 8 Glenn Oligotrophic High Good Small Poor 0. 217) Poor (0. 424) Poor (0. 753) Fair (0. 560) 23 -- Dissolved Oxygen, 2 Chlorophyll @, 3 Littoral Cover, 4 Avg. Littoral and Riparian Cover, 5 Anthropogenic Disturbance, 6 Riparian Cover Complexity 1
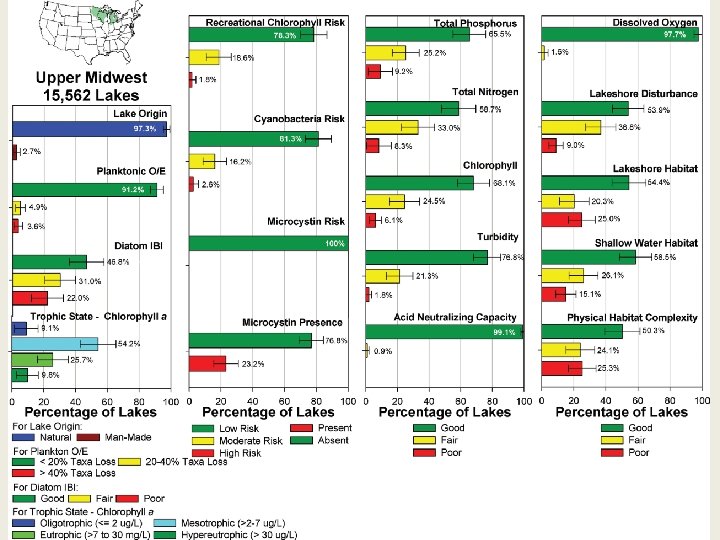
Comparison of the Least Disturbed Condition in the Upper Midwest Eco. Region to Torch Lake (2017) TP (ug/L) TN (ug/L) Cl (ueq/L) SO 4 (ueq/L) Turbidity (NTU) UMW >40 >1200 >200 >5 Torch <7 458 >5
“Given these indicators and similar scoring, Torch Lake would also likely rank in the “Good” category nationally. ”
QUESTIONS ?