
Topology of Supergranulation Pair Correlation Function g 2r



- Slides: 13
Topology of Supergranulation: Pair Correlation Function g 2(r) and Information Entropy H’(l) Berrilli F. , Del Moro D. , Giordano S. , Consolini G. , Kosovichev, A.
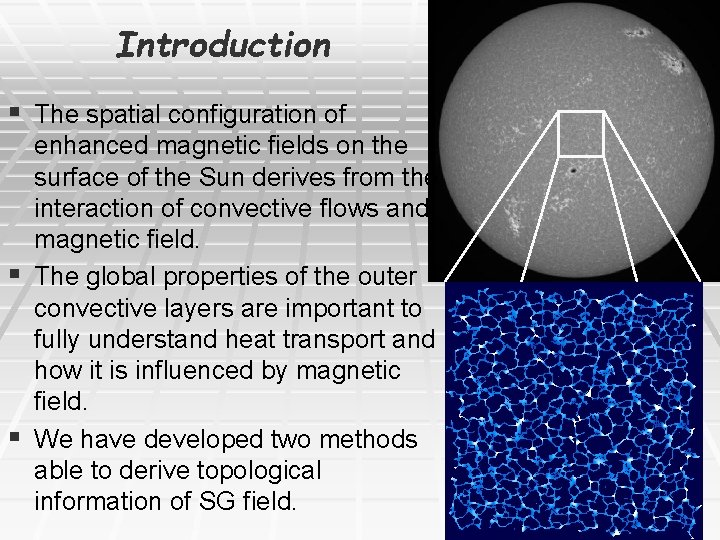
Introduction § The spatial configuration of enhanced magnetic fields on the surface of the Sun derives from the interaction of convective flows and magnetic field. § The global properties of the outer convective layers are important to fully understand heat transport and how it is influenced by magnetic field. § We have developed two methods able to derive topological information of SG field.
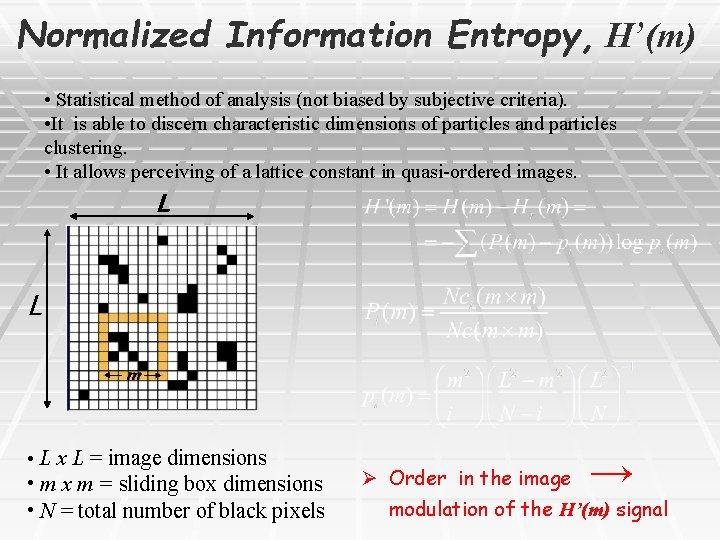
Normalized Information Entropy, H’(m) • Statistical method of analysis (not biased by subjective criteria). • It is able to discern characteristic dimensions of particles and particles clustering. • It allows perceiving of a lattice constant in quasi-ordered images. L L • L x L = image dimensions • m x m = sliding box dimensions • N = total number of black pixels → Ø Order in the image modulation of the H’(m) signal
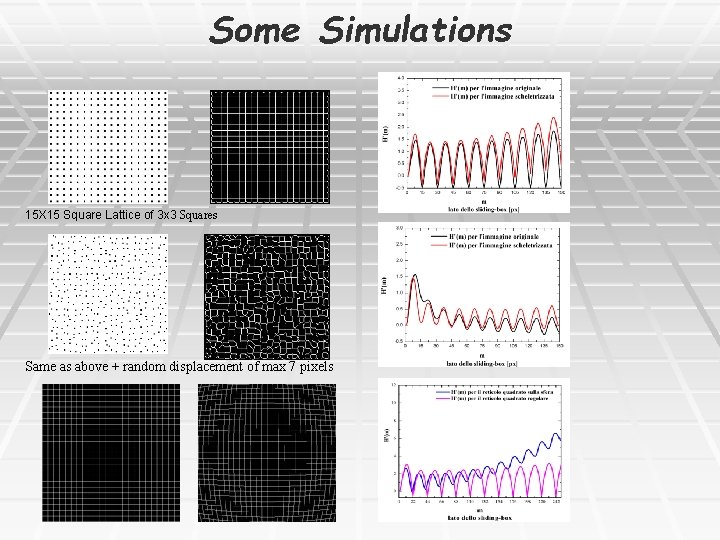
Some Simulations 15 X 15 Square Lattice of 3 x 3 Squares Same as above + random displacement of max 7 pixels
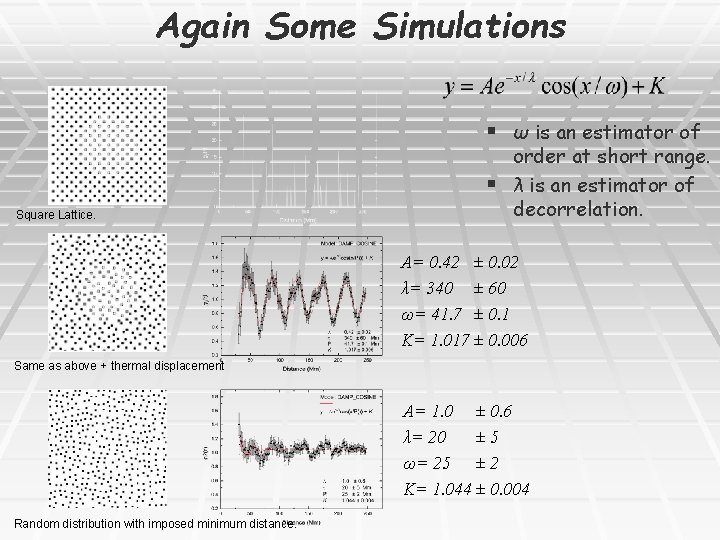
Pair Correlation Function, g 2(r) § g 2(r) shows density – density correlation. § g 2(r) is the probability to find a particle in the volume element dr located at r if at r = 0 there is another particle. § This probability is given relative to what expected for a uniform random distribution of particles of the same density. § For isotropic system the g 2(r) can be averaged over angles and computed from data by counting the mean number of particles at distance r – r+Δr from any given particle, <Nr>:
Again Some Simulations § ω is an estimator of Square Lattice. order at short range. § λ is an estimator of decorrelation. A= 0. 42 ± 0. 02 λ= 340 ± 60 ω= 41. 7 ± 0. 1 K= 1. 017 ± 0. 006 Same as above + thermal displacement A= 1. 0 ± 0. 6 λ= 20 ± 5 ω= 25 ± 2 K= 1. 044 ± 0. 004 Random distribution with imposed minimum distance.
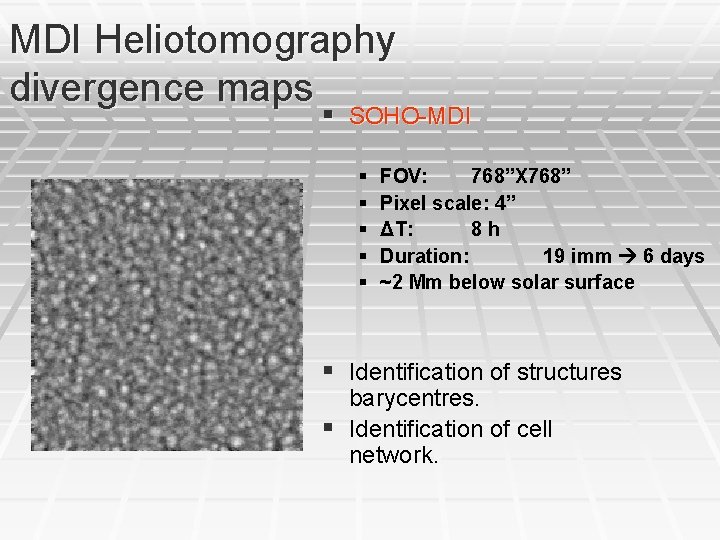
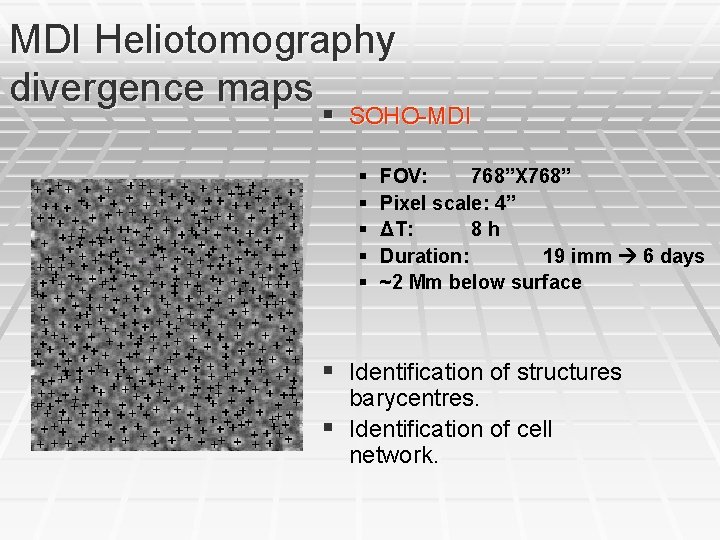
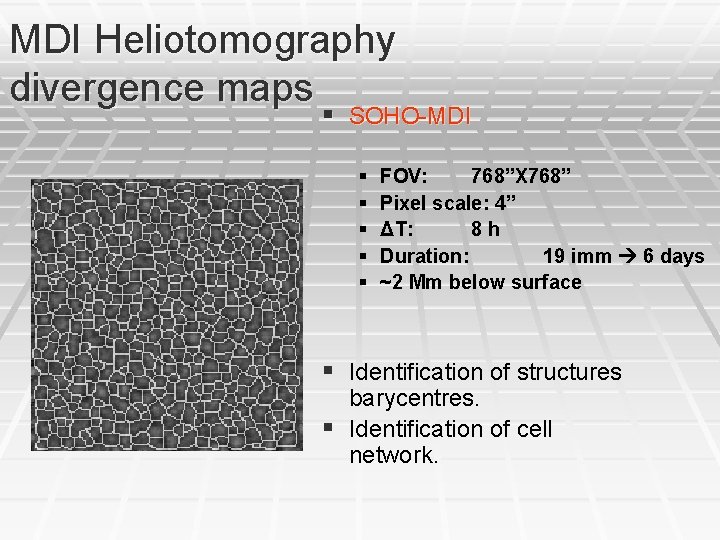
MDI Heliotomography divergence maps § SOHO-MDI § § § FOV: 768”X 768” Pixel scale: 4” ΔT: 8 h Duration: 19 imm 6 days ~2 Mm below solar surface § Identification of structures barycentres. § Identification of cell network.
MDI Heliotomography divergence maps § SOHO-MDI § § § FOV: 768”X 768” Pixel scale: 4” ΔT: 8 h Duration: 19 imm 6 days ~2 Mm below surface § Identification of structures barycentres. § Identification of cell network.
MDI Heliotomography divergence maps § SOHO-MDI § § § FOV: 768”X 768” Pixel scale: 4” ΔT: 8 h Duration: 19 imm 6 days ~2 Mm below surface § Identification of structures barycentres. § Identification of cell network.
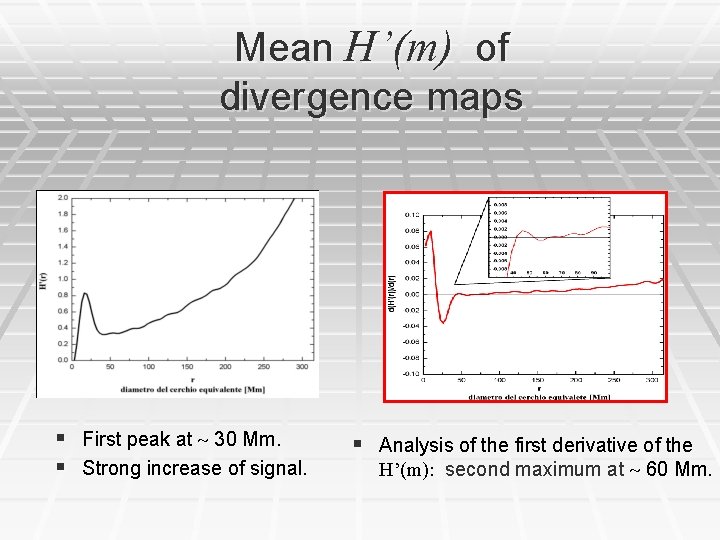
Mean H’(m) of divergence maps § First peak at 30 Mm. § Strong increase of signal. § Analysis of the first derivative of the H’(m): second maximum at 60 Mm.
Mean g 2(r) of divergence maps A= 0. 5 λ= 23 ω= 29 K= 1. 02 ± 0. 1 ± 3 ± 1 ± 0. 01
H’(m) Conclusions 1. The capacity of Van Siclen method to work on reticular structures has been proved. § First peak shows the Supergranular structure mean scale at 30 Mm. § Analyzing the first derivative of the H’(m), a second faint maximum has been found, indicating the presence of an higher scale of clustering at 60 Mm.
g 2(r) Conclusions § Mean size of SG structures ~ 29 Mm § Decorrelation length ~ 24 Mm § The interpretation of the results leads to consider the topology of the divergence maps incompatible with a random field, being more similar to the topology of close packed, mutually impenetrable structures.