TOPOGRAPHICAL MAPS Topographical Map Contour Map A type

 • A type of map indicating elevation in relief (highs")
 • And man-made")


 contour")

 • Slope – rate of change from one place to")


 1.")


 contour line on that hill •")


- Slides: 36
TOPOGRAPHICAL MAPS
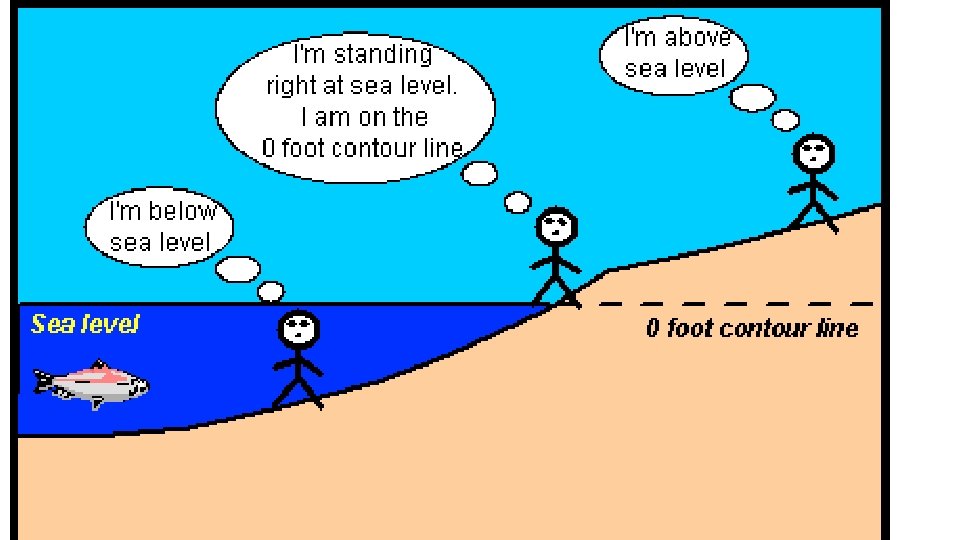
Topographical Map (Contour Map) • A type of map indicating elevation in relief (highs and lows, like hills and valleys), using contour lines. • Elevation – height above or below sea level
Topographical Map • Shows natural features (mountains, valleys, plains, lakes, rivers) • And man-made structures (roads, buildings, cities, boundaries, radio towers, dams)
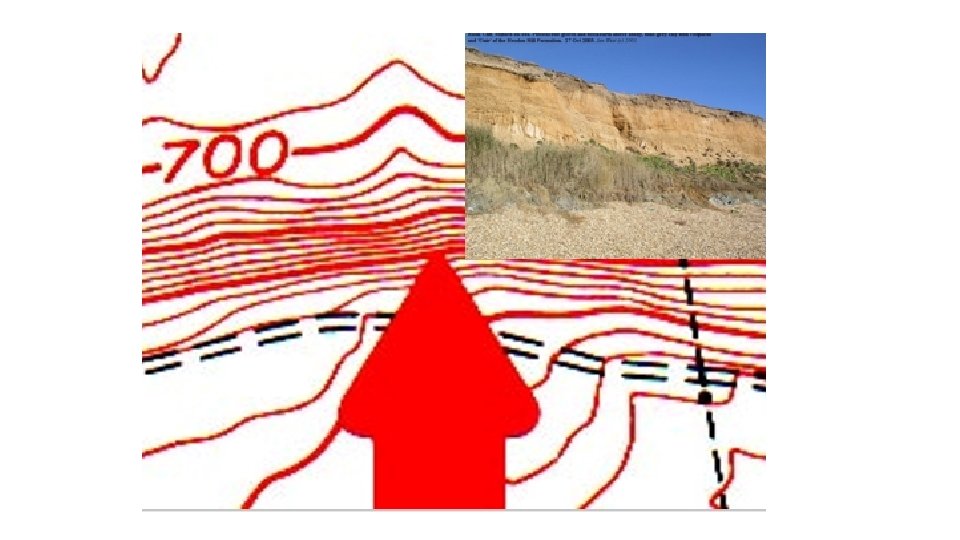
Uses of Topographical Maps • Used by ENGINEERS as they look for coal, oil, and gas. • Used to plan RESIDENTIAL and COMMERCIAL developments. • Used by the MILITARY and for RECREATIONAL purposes like hiking and camping.
Contour Lines • CONTOUR LINES are lines drawn on map that connect equal points of elevation. • show ELEVATION, STEEPNESS, SHAPE of land
• CONTOUR INTERVAL: difference in elevation between two consecutive (side by side) contour lines. • INDEX CONTOURS: lines that are bolder and have elevation labelled • Usually every 5 th line.
Contour lines can indicate slope • Gentle Slope - when contour lines are spaced far apart • Steep Slope - when contour lines are spaced close together
Gradient (slope or steepness) • Slope – rate of change from one place to another. • Difference in elevation between two points divided by the distance between the two points. • Gradient = change in elevation Distance travelled • https: //www. youtube. com/watch? v=3 QFJ_uv 2 m. Gw
• Gradient • Elevation of Y is 300 m. • By looking at the high point of 400 m, we deduce the interval is 20 m • Elevation of X is 380 m
• Gradient • To find the distance between X and Y, line up a piece of paper. • Then line it up to the scale on the map (not shown). • Let’s assume distance is 1. 5 km.
• Gradient So gradient would be: = (380 m - 300 m) 1. 5 km = 53. 3 m elevation gain for every km travelled.
Rules for Contours 1. Contour lines NEVER CROSS 2. Contours form CLOSED LOOPS (even if not shown of the map).
Rules 3. When contour lines cross a river they bend upstream Note: rivers flows the opposite direction the contour lines point
Rules for Contours 4. The highest possible elevation of the hill is just below the value of the next line that is not shown 90 80 70 60 50
Rules for Contours 5. The lowest possible elevation of a depression is just above the value of the next line that is not shown 90 90 80 51 70 60 50
Calculating Highest Point • Finding the last (highest) contour line on that hill • Imagine you drew another line • Subtract one from the imaginary line
SYMBOLS • Symbols represent features on a map. • Legend explains what the symbols mean.
Depression Contours • HACHURES – short lines at right angles that point toward center of a depression (lower elevation) • Allows you to distinguish a hill from a hole. • The elevation of the first depression contour is the same as the lowest regular contour near it.
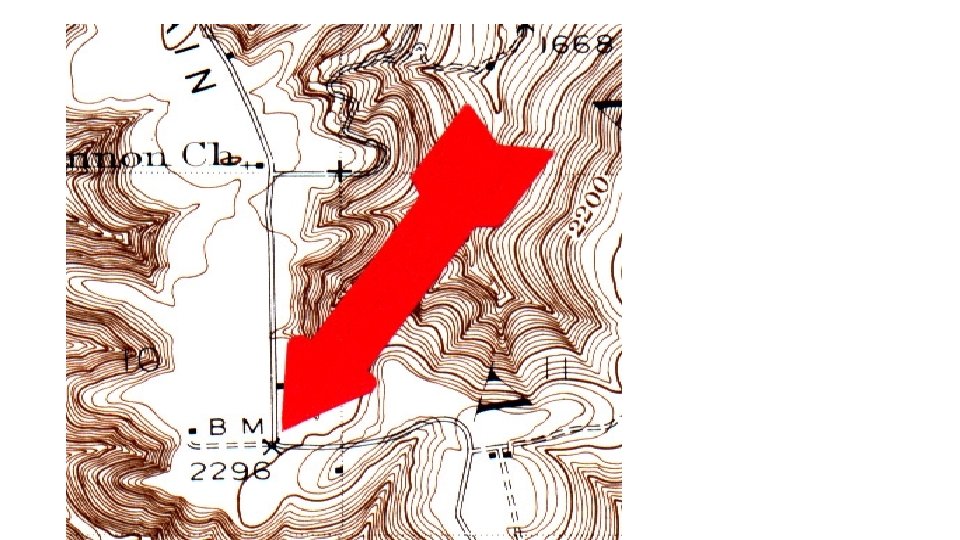
Benchmark • a marker that has the exact latitude, longitude, and elevation of that position • Labeled on a map as “BM. X. ”
• Notice the two high points on the island. • What is the elevation of the two high points?
What is the elevation of Point A?
What is the elevation of Point B?
What is the elevation of Point C?
What is the elevation of Point D?
What is the elevation of Point E?
How is elevation used in a topographic map?
Topographic Profile = the side view of a geological feature
Creating a Topographic Profile • You need two points on a contour map and a horizontal grid between the two points • Transfer the points from the map to the horizontal grid • Connect the points with a smooth line to draw the profile
Drawing Contour Maps
• Approximately how tall is Able Hill? • Approximately how tall is Baker Hill? • Which mountain is taller, and by about how much? • How many meters of elevation are there between contour lines on the topographic map? • Which mountain has steeper slopes? • Are the contour lines closer together on Able Hill or Baker Hill?
Check your Understanding 1. What are contour maps used for? 2. What information is found on a contour map? 3. How can you determine how steep a gradient is?
Mapping Assignment • Create your own map
Practice Reading Topographical Map and Scales • Text book page 125 • Interpret Topographic Map on page 652, Appendix B • And Topographic Map symbols, Appendix B, page 666