Topographic Maps What is a Topographic Map A


- Slides: 20
Topographic Maps
What is a Topographic Map? • A topographic map shows the shapes and elevations (the height) of land with contour lines • Contour lines: lines that connect places with the same elevations • For example, if the number 5 is written on a contour line of a topographic map, you know that every place along that line is 5 metres high.
Zero is sea level Highest point
What’s On a Topographic Map • Built-Up Areas: roads, buildings, urban development, boundaries, railways, power lines • Water: lakes, rivers, streams, swamps, rapids • Relief: mountains, valleys, slopes, depressions • Vegetation: wooded and cleared areas, vineyards and orchards • Labels: place names, water feature names, highway names
Who Uses These? People use topographic maps for: • Engineering • Conservation • Environmental management • Urban planning • Outdoor activities like fishing, hiking, or camping
Draw the outline of the mountain
Contour Intervals and Index Contours • Contour interval: the space between the contour lines. • Index Contour: Every fifth contour line labelled and wider than the other lines.
The Spacing Between Contour Lines • If the contours are close together, you're looking at a steep slope. • If the contours have wide spaces in between -- or aren't there at all -- the terrain is relatively flat. • Contour lines never cross or touch each other
Shading • Besides just the colour, patterns can be used to show certain features
Symbols
Forks of the Credit
Mt Everest
Topographic Toronto • https: //www. arcgis. com/home/webmap/view er. html? webmap=7124343 a 21 cb 4 bb 1 a 99 bbd 8 f 1 e 2 a 1 fa 8 – Select “Topographic” under Basemap option
Topographic Map Answers • 1. Contour interval = 20 m • 2. Elevation of Hill B = 220 m • 3. Direction of Blue River = Northeast – it flows into the ocean • 4. don’t bother • 5. Elevation of Point F = 160 m • 6. Lowest elevation on map = shoreline 0 m • 7. Steepest side of Pine Peak = Southeast slope • 8. Elevation of nearest line to bridge = 120 m
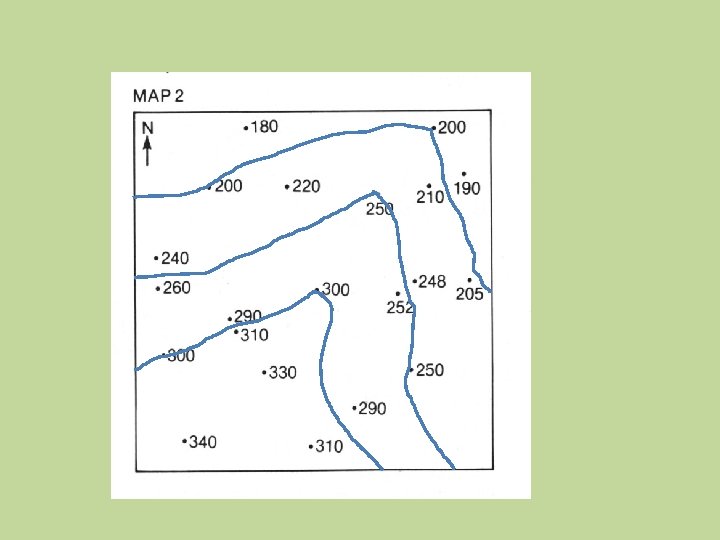
PRACTICING CONTOUR LINES
Practice Tips 1. Start at either the highest or lowest number you can find 2. Connect numbers that are the same, draw your line right over the numbers 3. Your line can only go between two numbers (one that is higher than it and one that is lower than it) 4. If there are no numbers available to connect with it – you can either turn it back on itself and make a circular shape, or lead it off the page if you can 5. Contour lines bend upstream and form a V when crossing a stream
6. Contour lines can cross small streams but not wider bodies of water 7. Contour lines can’t cross each other 8. Rivers always flow in the opposite direction from the way the contour lines bend (the V points uphill/upstream) 9. Water flows downhill 10. If you see contour lines with hashmarks on them, it is showing a depression (a decrease in elevation)
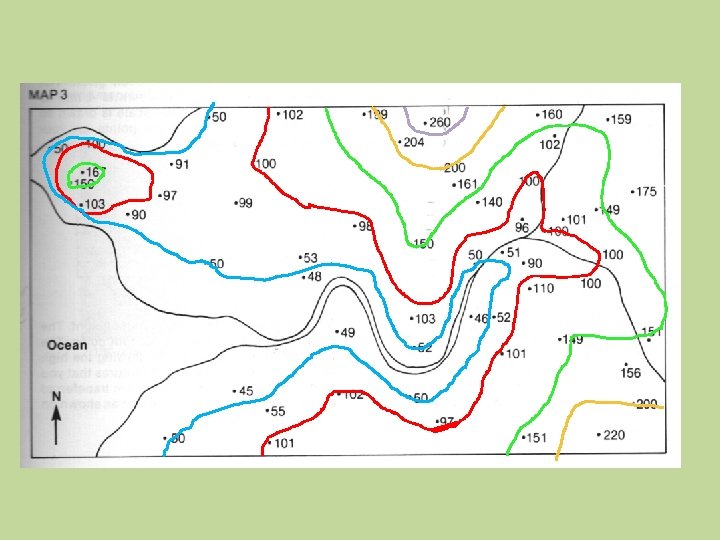
Drawing Contour Lines Worksheet Answers