Topographic Maps Topographic Maps maps used to show


 designate")

- Slides: 9
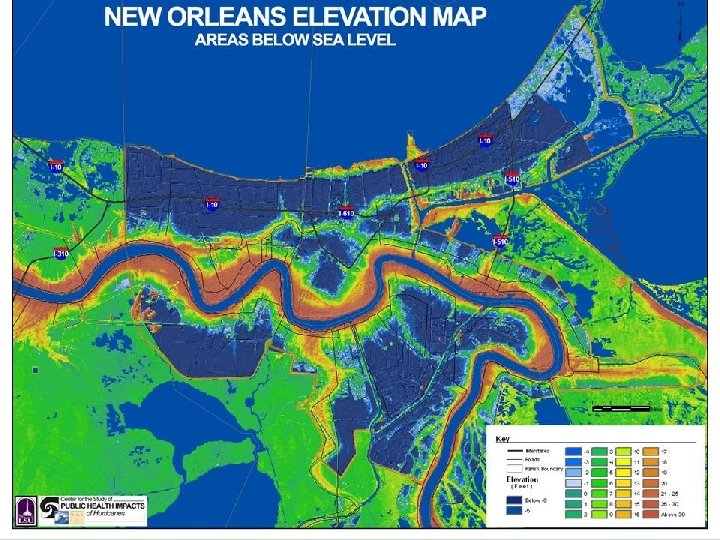
Topographic Maps • Topographic Maps -- maps used to show changes in elevation • Shows how high the land is above sea level • Shows how much the elevation changes (flat land or mountains)
Topographic Maps • 0 = sea level • Positive numbers = height above sea level • Negative numbers = height below sea level
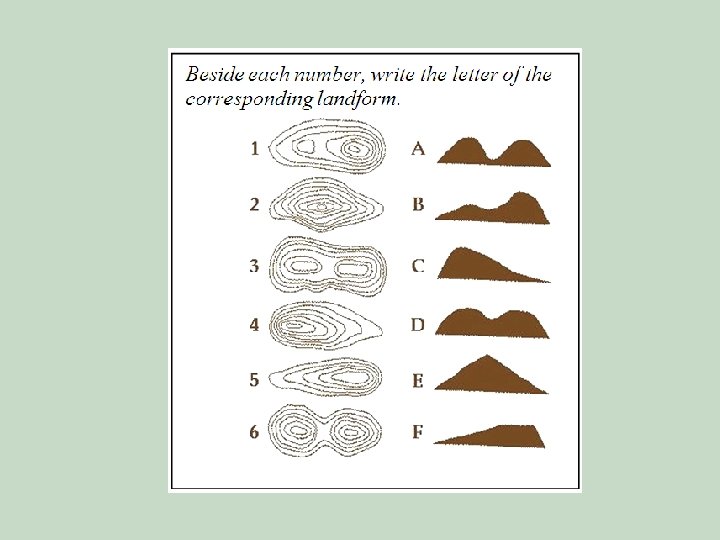
Topographic Maps • Contour Lines – connect areas with the same elevation • Contour lines never cross because one point can’t have two elevations (if a point is 100 m above sea level, then it can’t be 200 m also)
Topographic Maps • Contour intervals – distances between contour lines • The smaller the intervals (the closer the lines are to each other), the quicker the elevation is changing • Which would have closer contour lines, farmland or a mountain range? • Mountain range
Topographic Maps • Index contours – contour lines with numbers that let you know the exact elevation • These numbers are not on every line, so you have to figure out what the interval is • Sea level = 0 (0 m, 0 km, 0 mi, etc. )
Topographic Maps • Other features: • Hachures (dash marks around a circular region) designate a depression (an area of lower elevation) • If contour lines form upward Vs, there is a stream present in that location
20 m 780 m uphill