Topographic Maps Do Now Focused Free Write Pretend


 Open up the envelope and lay out the")
 Stand up and look down at your mountains, complete the map in the")

 What name would you give to")
 You have four minutes to complete this worksheet. Complete")


 Scalar Field – A field described in terms of magnitude")


 of the Atlantic Ocean Key: Isotherm Interval: 20 (˚C) What type of")

")

, but Long Creek flows down the")


 gradient changes quickly and the isolines are close together. A gentle")
 Label this on")


")


- Slides: 43
Topographic Maps!
Do Now: Focused Free Write: Pretend that you and a group of friends all go on a ski trip to Sugarloaf Mountain. Some of you are avid skiers and others are only beginners. Using the map below, how could you decide which trails are easy versus hard using the topographic map of Sugarloaf Mountain?
Do Now Focused Free Write: Pretend that you and a group of friends all go on a ski trip to sugarloaf. Some of you are avid skiers and others are only beginners. How could you decide which trails to take using a topographic map of Vail Mountain? DO NOT open the package !!!
Which trail would you want to take? Are you a good skier or a beginner?
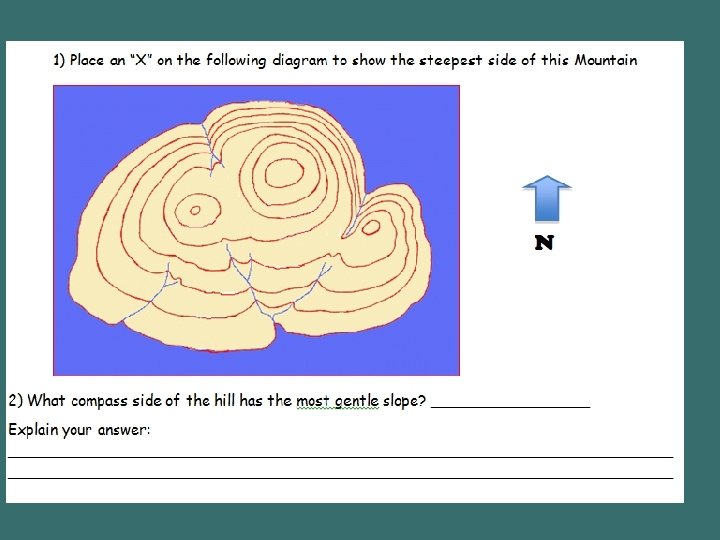
How can you use contour lines to tell if the slope is steep or gentle? The closer the contour lines the steeper __________________ the slope (1: 07)
A line that connects points that have the same value
Part 3: Puzzle Activity (1: 20) Open up the envelope and lay out the pieces so that the colored side faces up. Work together with your partner to assemble a card board mountain. After you complete the puzzle answer the following questions.
1) Stand up and look down at your mountains, complete the map in the box provided that would show the topography.
Reflect on your drawing… Describe the technique or method you use to build your mountain. How does your card board mountain differ from a real mountain. Explain. 2) What does each piece of the puzzle represent? A change in elevation
Did your drawing look something like this? 2) What name would you give to the outline of each of these pieces? Contour lines Tomorrow we are going to learn the rules for drawing contour lines, can you come up with some now?
Ticket out time (1: 34) You have four minutes to complete this worksheet. Complete the worksheet attached to today’s activity for HW When you hear the clapper begin pass -up procedure for the ticket out.
Earths Fields and Field Maps What is a field? What is a field map?
Describing Earth’s Field – a region which contains measurable quantities at every location. (i. e. elevation, temperature, pressure…) Field Value – the value of what is being measured. (i. e. temperature, elevation, pollution concentrations…)
Field Values (cont. ) Scalar Field – A field described in terms of magnitude alone (i. e. temp. , pressure, humidity) Vector Field – A field described with both magnitude and direction (i. e. wind velocity, gravity, magnetic fields)
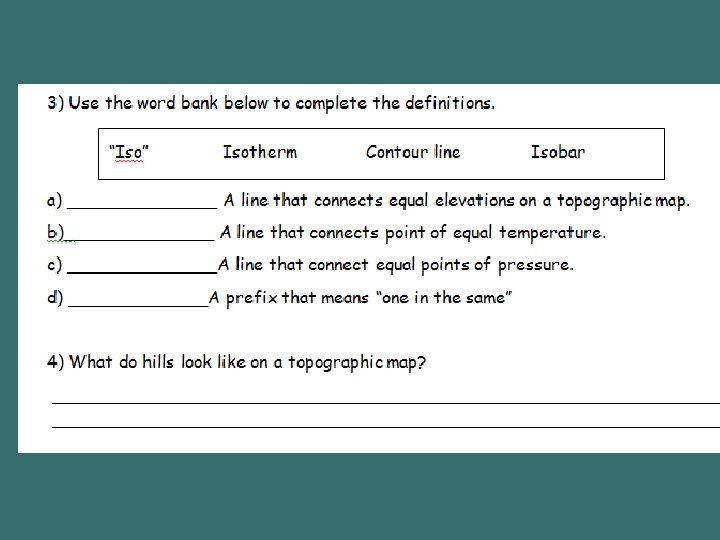
Isolines A line on a field map that connects all points of equal value. Note: ES 0304
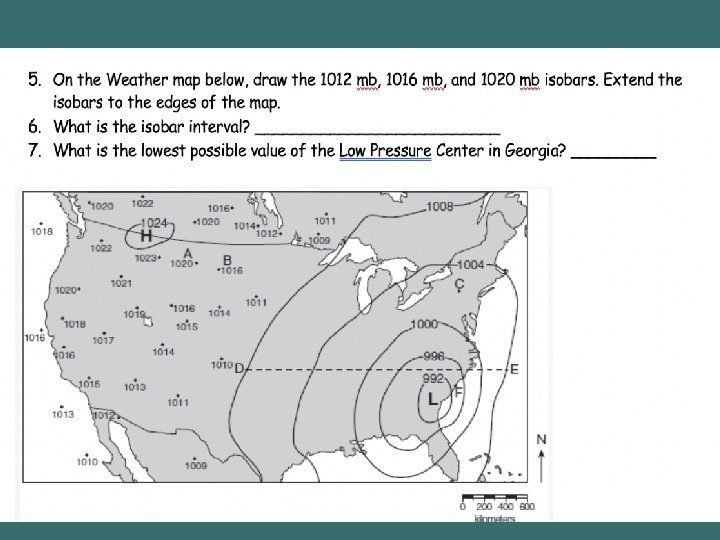
Types of Isolines Contour Line – Isoline that connects points of equal elevations on a contour map. Isotherm - Isoline that connects points of equal temperature on a field map. Isobar – Isoline that connects points of equal pressure on a field map.
Temperature (˚C) of the Atlantic Ocean Key: Isotherm Interval: 20 (˚C) What type of isolines are the lines on this map? ________ 2) What is the Isotherm interval? ________ 3) Estimate the ocean temperature at the following spots, mark each spot on the map with the appropriate letter A) (15°N, 160°E): _____ B) (20 N, 150 W: _____ C)(0, 180°): ______
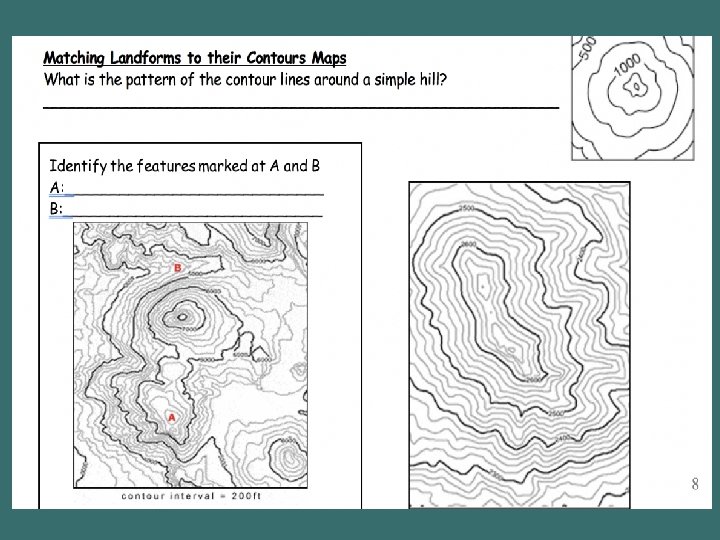
Important Field Map Terms Topographic map/Contour map – A map that uses contour lines to show elevation and landforms. Elevation – Height above mean (average) sea level. Contour interval – Vertical distance, or change in elevation, between adjacent contour lines.
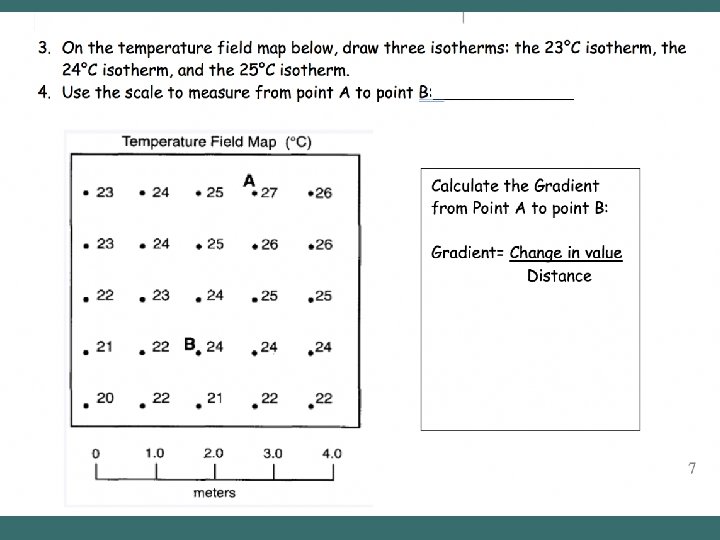
Scale The ratio of a model to the object. (i. e. globe to earth) Use the scale on the map as the ruler to measure that map.
General Contour Map Rules Rule of ‘V’s – as contour lines cross a stream they bend uphill. The steeper the slope the closer the lines are to each other. Topographic maps would be very cluttered if all contour lines were labeled so only heavier lines called index contours show labels.
The contour lines point up the page (orange), but Long Creek flows down the page.
CLOSER CONTOUR LINES = STEEPER GRADIENT TOPOGRAPHIC MAPS WOULD BE VERY CLUTTERED IF ALL CONTOUR LINES WERE LABELED, SO ONLY HEAVIER LINES called an index contour SHOW LABELS
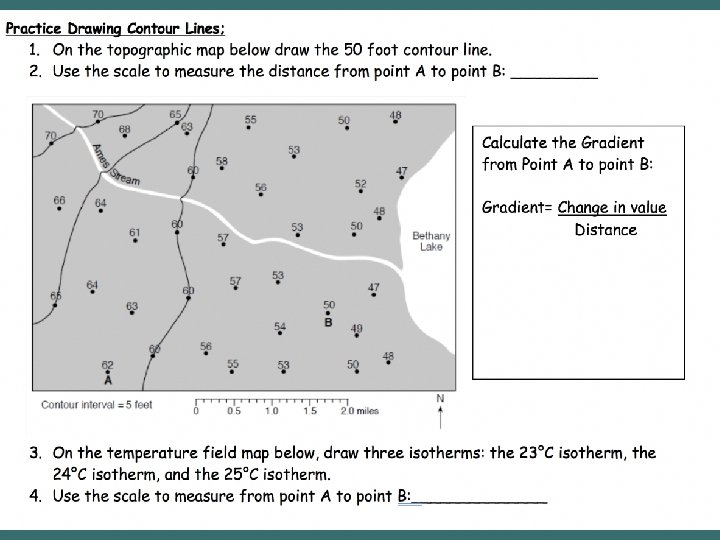
Gradient shows how quickly the value changes from one point to another.
A steep (high) gradient changes quickly and the isolines are close together. A gentle (low) gradient changes slowly and the lines are far apart. Steep area Gentle area 1 km=1 cm
1. What is the elevation level of sea level? _______ B) Label this on the map 2. What is the contour interval of this map? _______ 3. Number all the contour lines. 4. Find the North arrow on this map, complete the compass rose (add W, E, S) 5. Draw a box around the scale. 6. Using the scale, measure the distance between points A and B. _______ 7. State the compass direction of the side of hill D with the steepest slope? ____ 8. How can you tell whether a landform has a steep or gentle slopes? ______________6. In what direction from hill C is hill D? ______ 7. What is the elevation above sea level of the point labeled A? ______
Rules for Drawing Isolines: 1. Isolines connect points of equal value. � 5 � 10 � 15
2. Isolines are gentle, curving linesno sharp corners. � 5 � 10 � 15
3. Isolines are always closed curves even though the map might only show part of it.
4. Isolines NEVER cross- this would mean that one point has two different values. Ex: one spot has two temperatures? 40 ° 50 ° 30 ° 60 ° � X 20° � Y � Z
5. Isolines usually are parallel. (They have a parallel trend. )
Visualizations of contour lines http: //geology. asu. edu/~sreynolds/to po_gallery/topo_gallery. htm
Tips on Drawing Contour Lines • Always draw a contour line so that elevation reading is higher on one side of the contour line and lower on the other side. • Assume a steady elevation change between neighboring readings when positioning contour lines. • Adjacent contour lines tend to look alike. • Continue drawing a contour line until it reaches the boundary of plotted data or “closes” to form a loop by making its way to its starting point. • Contour lines never stop or end within a data field, and they never fork, touch or cross one another. • Contour lines cannot skip values and must always appear in sequence. • Only draw contour lines that fall within the range of data reported on the map. • Always label all contour lines.
Draw Isolines Connection equal values of elevation 80 80 90 90 80 100 120 90 112 80 120 110 90 100 90 80 90 70 80 90 80 Elevations in meters above sea level
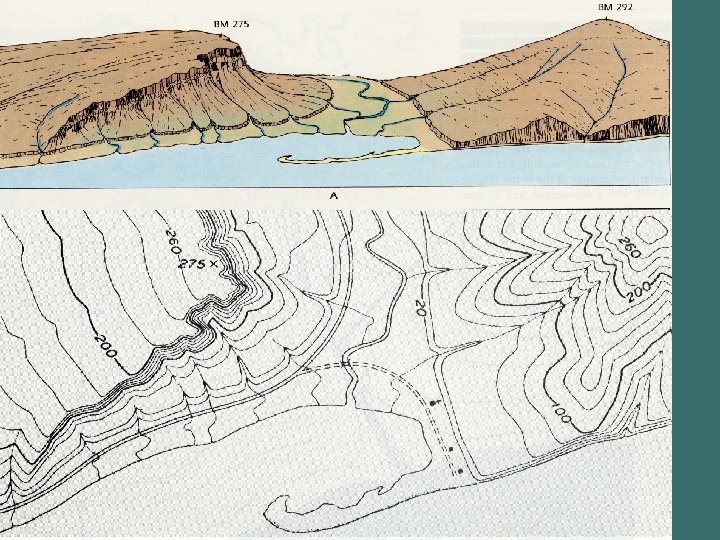
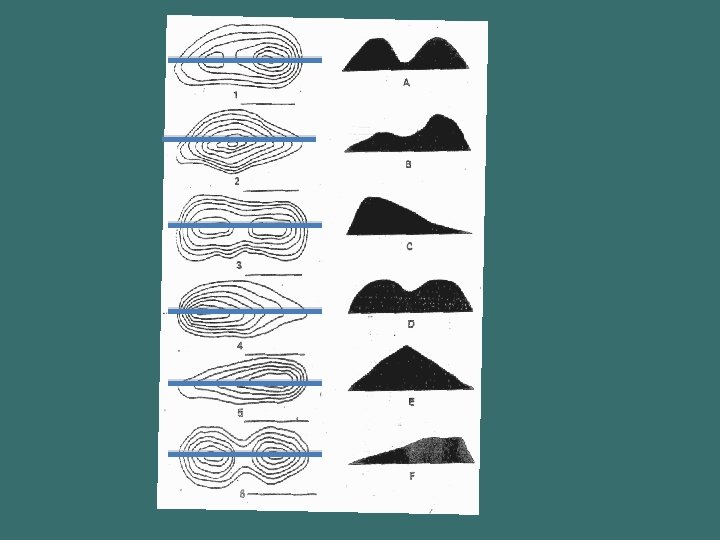
Profiles Profile – a side view of an area showing elevation.
2. Finish the mountain diagram below the topographic map, completing Oak Hill and drawing Ash Hill with proper elevations. 3. Approximately how tall is Ash Hill? _______ 4. Approximately how tall is Oak Hill? _____ 5. Which mountain is taller? __________ 6. How many meters of elevation are there between contour lines on the topographic map? _______ What is the value called? __________ 7. Are the contour lines closer together on Ash