Topographic Map Notes FIELD Area where a value

")


- Slides: 42
Topographic Map Notes FIELD- Area where a value is measured. ISOLINES- a line connecting points of equal value.
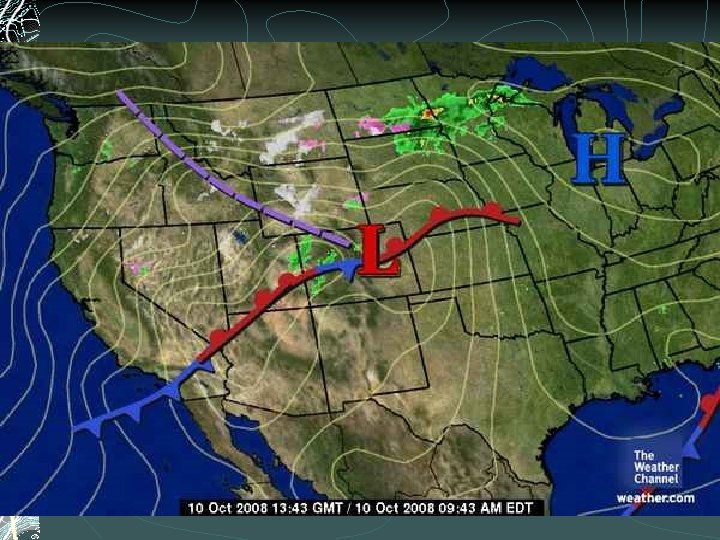
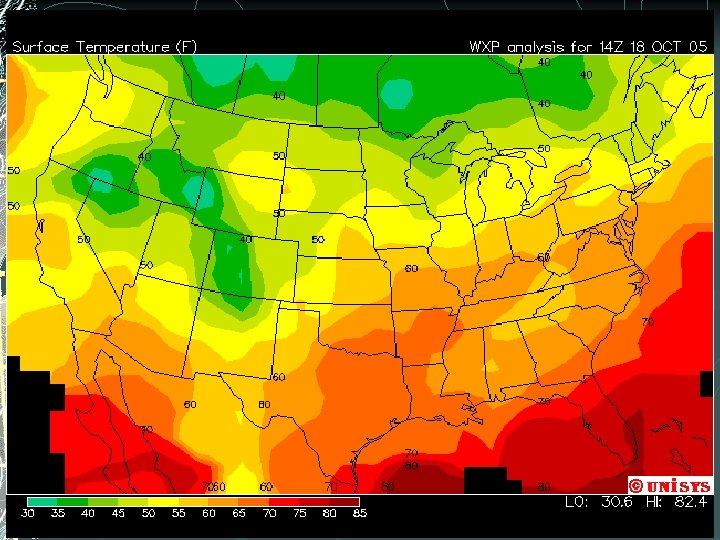
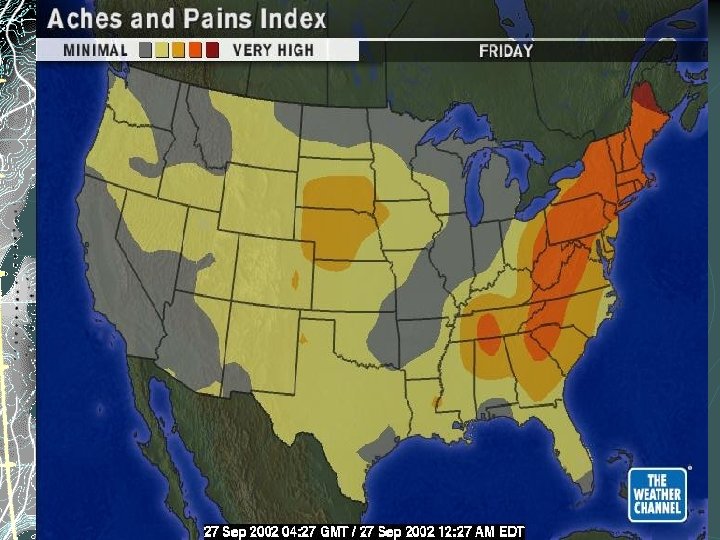
Examples of isolines: Isotherms: points of equal temperature Isobar: points of equal barometric (air) pressure Contour Lines: points of equal elevation Isohyet: Points of equal rainfall Anything else you can get a value for. (The weather channel loves isolines!)
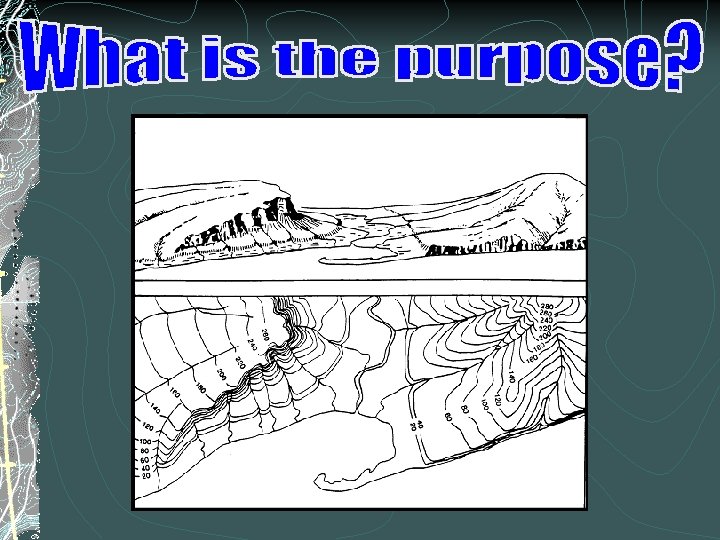
When might someone use a topographic map?
Rules for Drawing Isolines: 1. All points on the line MUST have the same value 5 5 10 10 10 15 15
2. Isolines are gentle, curving lines- no sharp corners. 5 5 10 10 10 15 15
3. Isolines are always closed curves even though the map might only show part of it.
4. Isolines NEVER cross- this would mean that one point has two different values. 40 ° 50 ° 30 ° 60 ° X 20° Y Z
5. Isolines usually have a parallel trend
6. The interval between 2 isolines must stay constant 30 40 50 60
25
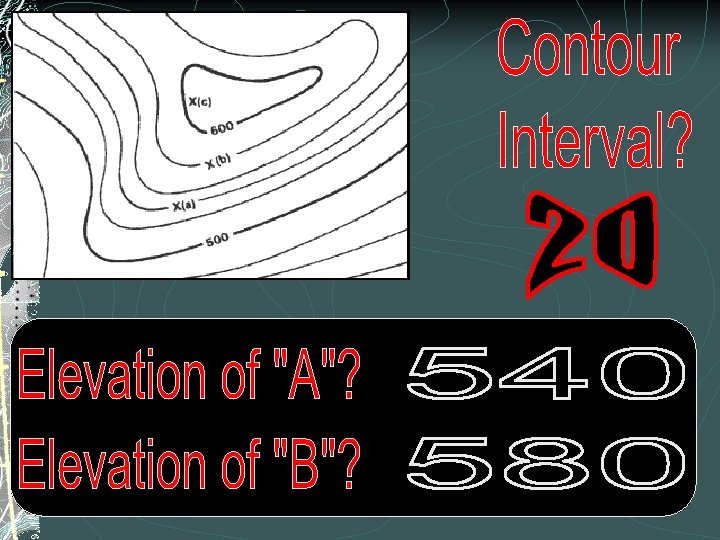
6. We can infer any value that exists between 2 lines 20 *Z 30 *X *Y
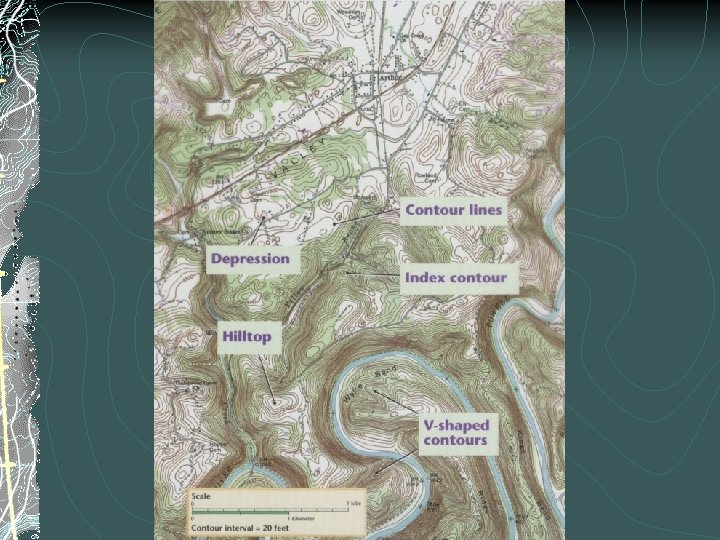
8. Index Contour Lines Every 4 th or 5 th contour line is thicker and bolder and the elevation is shown on the line
9. Depression contour lines show areas where land sinks downrepresented by…
What are the rules concerning hachured lines?
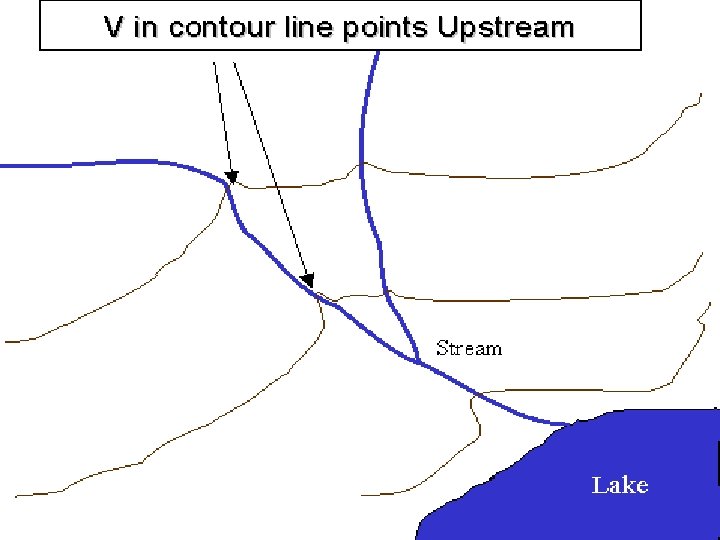
10. Rivers / Streams When a contour line crosses a river or stream they bend upstream Towards where the water comes from!!
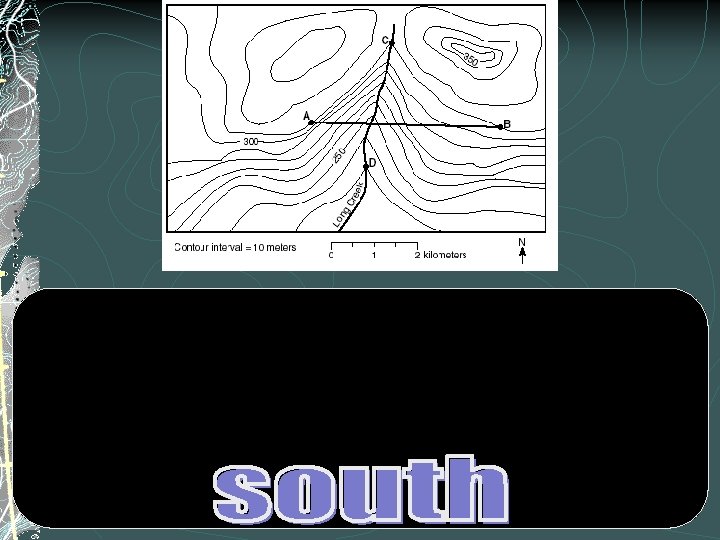
11. Gradient shows how quickly the value changes from one point to another. How STEEP the hill or mountain is A steep (high) gradient- lines are close together. A gentle (low) gradient - lines are far Gentle area Steep area apart.
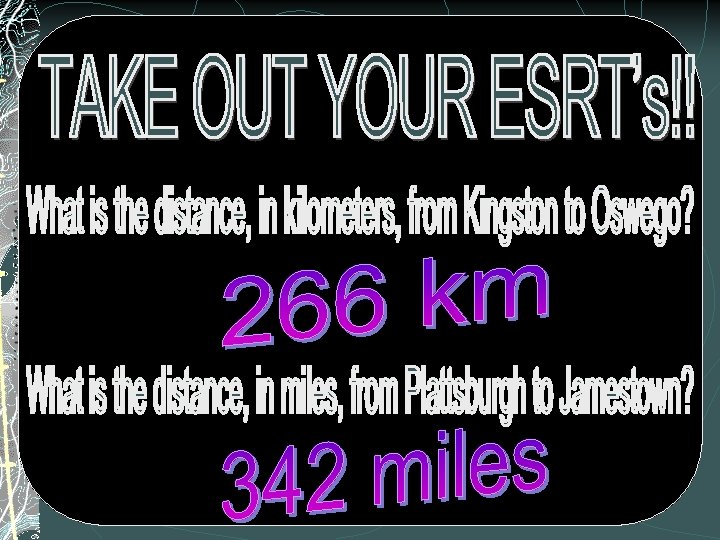
Gradient can be calculated using the formula
The elevation of Albany is 282 feet. The elevation at Binghamton is 1634 feet. Calculate the gradient to the nearest tenth of a ft/mi. Show all work. gradient = change in elevation distance = 1634 -282 115 miles = 11. 8 ft/mile = 1352 ft 115 miles
The elevation of Watertown is 99 m. The elevation at Oswego is 144 m. Calculate the gradient to the nearest tenth of a m/km. Show all work. gradient = change in elevation distance = 144 - 99 = 45 m 75 km = 0. 6 m/km
If the distance between the two circled cities is 425 km, calculate the temperature gradient to the nearest hundredth? Show all work. gradient = change in temperature distance = 82 -48 = 34 = 0. 08 °F/km 425
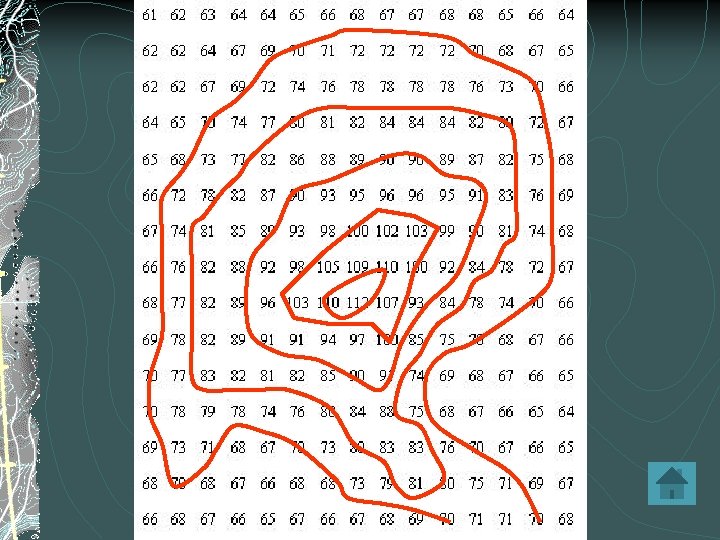
Practice drawing isolines
Highlight all the data points with the same value.
Fill in gaps in data.
Connect the dots.
Go on to the next value.
Now try Practice 2!!!!!
Topographic Profiles show the side view of the land
Please match the contour map on the left with the profile on the right.
What are the steps to draw a topographic profile place a piece of SCRAP paper between the 2 points MARK where every contour line touches the edge of the paper determine the elevation of each mark place the paper on the graph and PLOT the elevation of each contour line