Topic Quadrats and random sampling techniques Outcomes 1


- Slides: 11
Topic Quadrats and random sampling techniques Outcomes 1. 2. Information for teachers Level GCSE (or any course for students aged 14 -16) To understand how to use a quadrat to estimate the population size of a plant species in a specific area To use a running mean to justify your sample size This lesson introduces students to random sampling and estimation of population sizes. www. thescienceteacher. co. uk | resources for science teachers who like to think
Estimate how many daisies are in this field? You have 20 seconds only.
• How did you estimate the number of daisies? • Did you try to count them all? Was this easy? • Is there another method? Write your first estimate down.
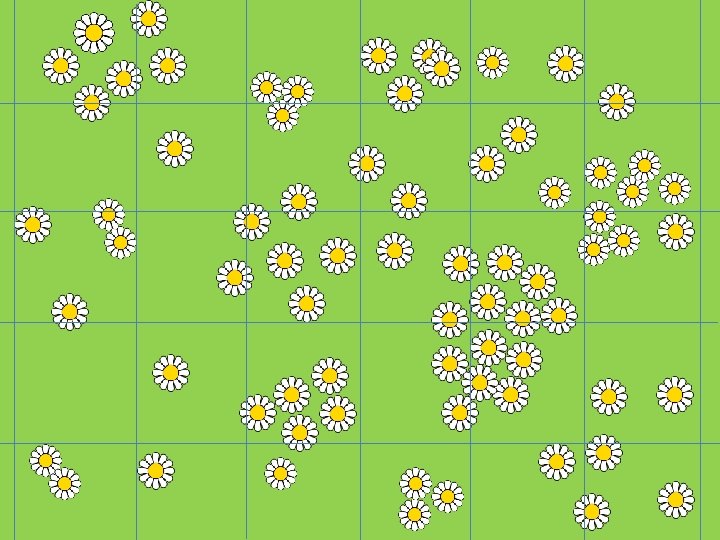
Estimate how many daisies are in this field? You have 20 seconds only.
How did you use the grid to estimate the number of daisies? Did it help? There are 73 daisies We use a technique called random sampling with a piece of equipment called a quadrat to help us estimate the number of organisms in an area when it is too impractical to count them all. How many quadrats would you need to count? !
http: //www. theseashore. org. uk/theseashore/Stats%20 fo r%20 twits/How%20 big%20 a%20 sample. html
Let’s see how good our estimation can be using a random sampling technique. 1. Place a ruler or tape measure along the two sides of the area being studied. Divide up your study area into non-overlapping quadrat-sized rectangles. 2. Write x and y co-ordinates along the sides of your paper (or field) at regular distances. 3. Randomly identify x and y coordinates to place down your quadrat. 4. Count and record the number of daisies inside the quadrat Record this data in the table and calculate the running mean. Plot a graph of sample number against running mean. 5. Repeat sets 3 -4 until you have a large enough sample size Think! How will you know this from looking at your graph? 6. The field has an area of 30 m 2. How many daisies do you estimate are in the field? 7. Is your estimation the same as the true value? If not, why not? How could you improve the accuracy of your estimation?
1 1 2 3 4 5 6
Sample number 1 2 3 4 5 6 7 8 9 10 Coordinates of the quadrat Number of daisies in a 1 m 2 quadrat Running mean number of daisies per 1 m 2 quadrat