TOPIC POPULATION IN UNITED STATES OF AMERICA PART


- Slides: 14

TOPIC: POPULATION IN UNITED STATES OF AMERICA PART -II B. A/B. Sc. IV Semester Paper name: Regional Geography of Developed and Developing World (USA and China) Paper code: GRB/GRA 401 Prepared and Compiled by, Dr. Sabina Bano Assistant Professor Mahila Maha Vidyalaya BHU- Varanasi

LESSON PLAN: 04 TIME DURATION: 02 HOURS OBJECTIVE AND OUTCOMES: EXPECTED LEARNING �To develop an overview on demographic characteristics of USA �To generate an idea of issues and concern associated with Population of USA

SUB TOPICS Dear Students in the second part of the population in United States of America we would be discussing demographic characteristics of it. For e. g. age- structure, race and Hispanic population, life expectancy , Urbanization, fertility and infant mortality and median age. Beside this we will be developing understanding of population issues and concerns of the country. So lets begin the topic as: � Recapitulating Population in UNITED STATES Under theme DEMOGRAPHIC CHARACTERISTICS: -----� � � � Age Structure Rural Urban Population Religion Race & Ethnicity Fertility and Mortality Life Expectancy Median Age � POPULATION ISSUES AND CONCERNS

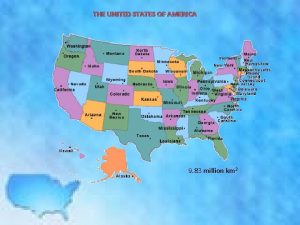
Recapitulating Population in U. S. A � By population, the USA is the third largest country in the world, after China (1. 39 billion) and India (1. 31 billion). � The United States population (331 million-2020) is equivalent to 4. 25 percent of the total world’s population and which concentrated 29. 4 percent of the total wealth of the world. � Area wise USA is fourth (9. 37 million sq. km) largest country in the world after Russia, Canada and China. Average population density is 36 person per sq. km. � The United States population grows an average 0. 9% every year. � The Capital is Washington D. C , and the most populous city is New York � White population constitute the majority of the U. S population with a total of about 73 % (234 million) of the population as of 2017 � The population is highly urbanized, with 82. 3 percent of the population residing in cities and suburbs. � The life expectancy is 79. 11 where as median age in the United States is 38. 3 years. � It is highly developed country with largest economy by nominal GDP, the second largest by purchasing power parity, and accounts for approximately a quarter of global GDP. � It is the world’s largest importer and second largest exporter of goods by value. � The census Bureau projected as U. S. population of 417 million in 2060.

USA Population by Age Structure • • The given population pyramid illustrates the age and sex structure of the country which provide insights about social, economical and political stability. As per given diagram of pyramid it is Constructive type of population pyramid. Constructive Pyramid can be identified with a narrow base i. e. lesser share of younger people (shown in pie diagram), indicating declining birth rates with each succeeding age group getting smaller than previous one. The male female populations are broken down into five years groups represented as horizontal bars along the vertical axis. The youngest age groups are placed at bottom where as the oldest one at the top. Finally the shape of population pyramid gradually evolves over time based on fertility, mortality an international migration trends Distribution of population in under various age group in percentage (2018) 16. 03 18. 62 12. 94 Age group in years 13. 12 0 -14 15 -24 25 -54 39. 29 55 -64 65 & above

� The urban percentage of USA was only 6. 1 in 1800. � Till 1910 the rural population was more than urban population that is clearly visible through given data. � 1920 onwards the country has been transformed from predominately agricultural nation to one of the leading and developed industrial country. � This was largely due to the Industrial revolution started in late eighteenth and early nineteenth century. � Time to time The United States Census Bureau changed its classification and definition of urban areas. � Urbanisation was fastest in the North eastern region. As per census 2010 the north east region, mid -west region, south and western region of USA has 85%, 75. 9%, 75. 8% and 89. 8% of urban population respectively. Percent RURAL URBAN POPULATION IN USA 90 80 70 60 50 40 30 20 10 0 Population of rural and urban USA (1990 -2020) Urban Population Rural Population 1900 1910 1920 1930 1940 1950 1960 1970 1980 199020002010 2020 Year YEAR URBAN (%) RURAL (%) 1900 39. 6 60. 4 1910 45. 6 54. 4 1920 51. 2 48. 8 1930 56. 1 43. 9 1940 56. 6 43. 4 1950 64. 0 36 1960 69. 9 30. 1 1970 73. 6 26. 4 1980 73. 7 26. 3 1990 78. 0 22. 0 2000 79. 0 21. 0 2010 80. 7 19. 3 2020 82. 3 17. 7

RELIGION IN UNITED STATES � The pie diagram depicts major share of population belongs to Protestantism religion i. e 48. 5 % followed by 22. 7 % of Catholicism according to 2017. � In 2017, the US census Bureau reported that about 21. 3 % of the population did not identify themselves as a member of religion. � It was assessed that if this current growth rate continues, by 2050, around 51% of Americans will not fall in No Religion. � 2. 9 % population of US constitute by Hinduism, Buddhism and Sikhism falls into other Non Abrahamic category of religion. RELIGION IN UNITED STATES Protestantism Catholicism Mormonism No Religion Judaism Islam Other non. Abrahamic

RACE AND ETHNICITY IN USA � Race and Ethnicity in the USA is not new. It is a complex in nature as USA has racially and ethnically diverse population. � Federal government has kept both categories separately. � In 1970, the US population was nearly entirely classified as either White or Black, and the population of races other than white or black was only 2. 9 percent. By 2000, the number of people in the US who were of races other than white or black had grown to 35 million, comparable in size and share to the Black population. � White Americans are racial majority in 1900 and onwards. African American are the largest racial minority, comprising approximately 12. 7 percent of the population. � Hispanic or Latino American shares largest ethnic minority comprising 17. 8 per cent of the population.

FIRTILITY AND INFANT MORTILITY IN USA INFANT MORTILITY RATE: � Infant Mortality is the death of an infant before his/her one year. The Infant Mortality Rate is the no. of infant deaths for every 1000 live births. It is an important indicators of the overall health of the society. � From 1950 onwards it shows the declining trend to reflect the healthy society of USA. � In 2020 the rate of infant mortality is 5. 48 for per 1000 live births. Live births per woman TFR in USA (1960 - 2020) 4 3. 5 3 2. 5 2 1. 5 1 0. 5 0 3. 6 2. 5 1. 9 1. 8 1960 1970 1980 1990 YEAR 2. 1 2 2000 2010 1. 8 2020 Mortality Rate (1950 -2020) Per 1000 live births FIRTILITY RATE: � A total Fertility Rate (TFR) of 2. 1 represents the replacement level fertility that means the average number of children per women needed for each generation to exactly replace itself without needing international immigration. A value below 2. 1 will cause the native population to decline. � From 1960 to 2020 the TFR changes from 3. 6 to 1. 8 births per woman USA. 35 30 25 20 15 10 5 0 30. 16 25. 14 17. 81 11. 43 8. 67 6. 99 5. 96 5. 48 1950 1960 1970 1980 1990 2000 2010 2020

LIFE EXPECTANCY 80 Life Expectancy in USA 78. 9 78 75. 7 74. 4 74 72 70 79. 1 77. 2 76 Age � The life expectancy of USA is 79. 1 where females and male life expectancy is 81. 7 years and 76. 6 years respectively. � Out of 191 countries ranking which ranges from 85. 29 years age in Hong Kong to 54. 36 of Central African Republic united States ranked 46 with the 79. 11 age just after the country Cuba. � The United States had been improving steadily in terms of life expectancy. � Through the line graph we can see the life expectancy increased by nearly 10 years over the last half century from 71. 4 years in 1970 to 79. 1 years in 2020. 71. 4 70. 1 68 66 64 1960 1970 1980 1990 Years 2000 2010 2020

MEDIAN AGE IN USA DECADAL MEDIAN AGE OF POPULATION IN USA 45 40 32. 9 35 AGE IN YEARS � Median age is the age that divides a population into two numerically equal sized groups that is, half the people are younger than this age and half are older. It is single index that summarizes the age distribution of a population for any country. � To determine the median age in each state, the US Census Bureau conducts the American Community Survey (ACS), an annual survey of millions of Americans about social, economic and demographic attributes in all states. It help local officials, community leaders and business to develop the understanding of community from their perspectives. � The given bar diagram depicts the growing median age of the population of USA which reflect its bifurcation of the total population. � The median age rose gradually from 23 in 1900 to 26 in the 1930 and then rose more rapidly to 29 in 1940 with relatively small no. of births during the 1930 s. After increasing to 30 in 1950, the median age fells, as a result of baby boom, to 28. 1 in 1970. � 1970 onwards gradually the median age in USA tend to increase. � The median age of the population regionally differs. States of the western half of the country tend to have a lower median age than the eastern half of USA. 30 29. 5 28. 1 35. 3 37. 2 38. 3 30 25 20 15 10 5 0 1960 1970 1980 1990 2000 2010 2020 DECADAL YEARS

POPULATION ISSUES AND CONCERN IN USA � As noted by the population Reference Bureau, the US is getting more bigger, older and diverse. Bigger in terms of population growth. Older in terms of rapid ageing of its population. Diverse in terms of racially and ethnically. � Demographers at the United Nations estimate that the people living in the country side moved to the cities, pushing urban areas far beyond their capacity. � Increasing population of rich country like USA gives immense pressure on fuels and the resultant pollution of air and water. � The U. S population growth rate of 0. 62 percent for 2017 -18 is the lowest registered in 80 years. The current rate reflects a further dip in a trend toward a lower level of growth. � The decline in births may leading to loosing the population of some state in US. � Rural Urban Migration tends to more and more concentration in urban and sub urban areas � Emphasis on consistent and workable U. S. immigration policy because of the future contributions that migrants will make to growing America’s society and economy.

REFERENCES � https: //u-s-history. com/pages/ � Arreola D. D, Deal M. S, Peterson J. F. Sanders R. (2007) World Geography, Mc Dougal Little � Tikha, R. N. , Bali, P. K. and Sekhon M. S. (2009) World Regional Geography, New Academic Publishing Co. � Guha J. L. & Chattoraj P. R (1998) A New Approach to Economic Geography, The World Press Private Limited Calcutta � Srivastava V. K. & Srivastava K. R. (2009) Sayunktay Rajya America ka bhogolik swaroop, basundhara prakashan � https: //en. m. wikipedia. org � Demographic trends in the 20 the century, Census special Report (United States Census 2000), issued Nov. 2002, U. S. Census Bureau � https: //www. worldometers. info/demographics/lifeexpectancy/#countries ranked-by-life expectancy

THANK YOU & YOU MAY CALL FOR QUERRIES
 Fort bragg population pyramid
 What is the southeast region of the united states
 Expansion of the united states of america 1607 to 1853 map
 United postmasters and managers of america
 Was the united states on the axis powers or allied powers?
 Mediterranean climate in us
 Slave state
 Us pro soccer organization
 United states v. nixon significance
 United states student association
 The united states ought to provide a universal basic income
 Preamble
 The united states in the caribbean 1776-1985
 Why did truman believe greece needed aid
 Gadsden purchase date acquired
