Topic Epidemiology of DM Diagnosis of DM Classification


 (mg/d. L) Normal IFG")

 Diabetes Mellitus Not")


 Decline of -Cell Function in the")

 Who? People > 45 years old 2. People < 45")

 > 126 mg/dl or.")


 - Hyperosmolar Nonketotic")


 Steno-2: effect of intensive versus conventional treatment on cardiovascular complications")


")


 90 -130 - Peak postprandial")


- Slides: 49
Topic • • Epidemiology of DM Diagnosis of DM Classification & pathogenesis of DM Screening of diabetes Metabolic syndrome Complication of DM Goal in management of DM
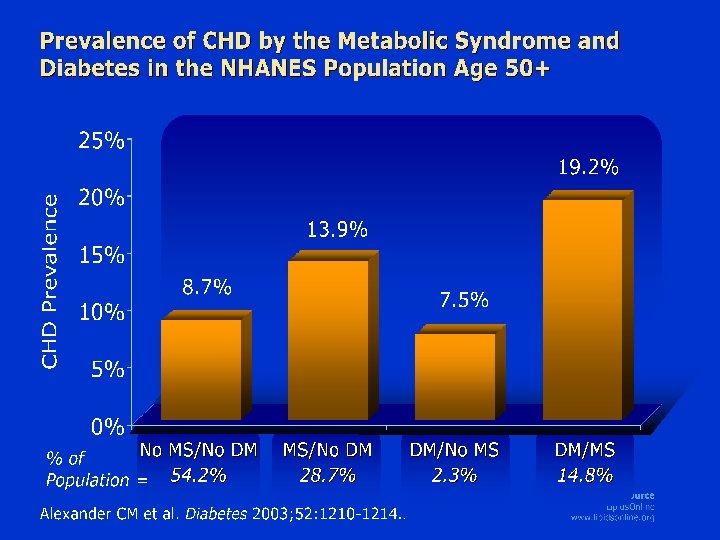
Type 2 Diabetes is a CHD Risk Factor Diabetes and Prior MI Predict Mortality Equally No Diabetes or MI Diabetes without MI MI without Diabetes Survival (%) 100 80 60 Diabetes and MI 40 20 0 0 1 2 3 4 5 6 7 8 Year Haffner SM, et al. N Engl J Med 1998; 339: 229 -34.
Global projections for the diabetes epidemic: 2003– 2025 48. 4 58. 6 17. 4 % 23. 0 36. 2 36% 15. 6 22. 5 44% 39. 3 81. 6 52% 7. 1 15. 0 52. 6 % World 2003 = 194 million (5. 1%) 2025 = 333 million (6. 3%) Increase of 42% 43. 0 75. 8 43. 3% Adapted from IDF Diabetes atlast 2005
Countries with the highest numbers of estimated cases of diabetes for 2030 Egypt Philippines Japan Bangladesh Brazil Pakistan Indonesia USA China India 0 20 40 60 80 100 People with diabetes (millions) Adapted from Wild SH et al. Diabetes Care 2004; 27: 2569– 70.
Prevalence of DM in Thais the National Health Survey 1997 & 2004 Population Survey for CHD Risk 2000 population age >35 yr 1997 DM prevalence = 4. 8% Males = 4. 3% Females = 5. 3% Urban = 6. 9% Males = 6. 2% Females = 7. 6% Rural = 3. 8% Males = 3. 5% Females = 4. 2% 2000 = 9. 6% = 9. 1% = 10. 0% = 11. 9% = 11. 1% = 12. 6% = 8. 5% = 8. 2 % = 8. 8 % 2004 = 10. 8% = = = =
Topic • • Epidemiology of DM Diagnosis of DM Classification & pathogenesis of DM Screening of diabetes Metabolic syndrome Complication of DM Goal in management of DM
Criteria for Diagnosis of DM Stage Fasting Plasma Glucose (FPG) (mg/d. L) Normal IFG < 100 Random Plasma Glucose (mg/d. L)* < 140 100 - 125 Pre-diabetes IGT DM 140 -199 > 126 > 200** * Testing must be repeated on separate day. FPG is the preferred test ** Symptoms of DM IFG = Impaired fasting glucose IGT = Impaired glucose tolerance Diabetes care 2004; 20 : 7
Topic • • Epidemiology of DM Diagnosis of DM Classification & pathogenesis of DM Screening of diabetes Metabolic syndrome Complication of DM Goal in management of DM
Normoglycaemia Hyperglycaemia Stages Normal glucose IGT and/or IFG tolerance Types (Pre-diabetes) Diabetes Mellitus Not Insulin insulin requiring for control survival Type 1 • Autoimmune • Idiopathic Type 2 • Predominantly insulin resistance • Predominantly insulin secretory defects Other specific type Gestational diabetes DIABETIC MEDICINE, 1998 ; 15 : 535 -553
Natural History of Type 1 Diabetes Relative Measure of insulin /insulin action Glucose Fasting Glucose Autoimmune B Cell destruction begins Islet cell antibodies appear Genetic background At risk for Type 1 diabetes Insulin Level Time (Age dependent)
Targeting the underlying factors in type 2 diabetes: IR and -cell dysfunction Genetic susceptibility obesity, sedentary lifestyle IR glucose uptake -cell dysfunction Impaired insulin secretion hepatic glucose production Type 2 diabetes Adapted from De. Fronzo RA. Diabetes 1988; 37: 667– 87.
Conversion to type 2 diabetes stratified by baseline IR and insulin secretion Insulin resistant good insulin secretion Insulin sensitive good insulin secretion 1. 5% 28. 5% 16% Insulin sensitive low insulin secretion 54% Insulin resistant low insulin secretion San Antonio Heart Study: baseline status for insulin resistance and insulin secretion in those converted to type 2 diabetes during 7 -year follow up; n = 195 Adapted from Haffner SM et al. Circulation 2000; 101: 975– 80.
IR and -cell dysfunction are fundamental to type 2 diabetes Obesity 350 – Postprandial glucose 300 – Glucose (mg/dl) Uncontrolled hyperglycaemia Diabetes IFG 250 – Fasting glucose 200 – 150 – 100 – 50 – 250 – Relative function (%) IR 200 – 150 – 100 – Clinical diagnosis 50 – Insulin secretion 0– -10 -5 0 5 10 15 Years of diabetes 20 25 30 Adapted from Burger HG et al. 2001. Diabetes Mellitus, Carbohydrate Metabolism, and Lipid Disorders. In Endocrinology. 4 th ed. Edited by LJ De. Groot and JL Jameson. Philadelphia: W. B. Saunders Co. , 2001. Originally published in Type 2 Diabetes BASICS. International Diabetes Center, Minneapolis, 2000.
Progression of type 2 diabetes Preclinical state Normal IGT IFG Primary prevention Clinical state Type 2 DM Secondary prevention Complications Tertiary prevention Disability Death
Decline in -cell function is associated with loss of glycaemic control 9 Hb. A 1 c (%) Conventional 8 Intensive 7 6 0 4. 5– 6. 2% = normal range of Hb. A 1 c 0 3 6 9 12 15 Years from randomisation Adapted from UKPDS Group. UKPDS 33. Lancet 1998; 352: 837– 53.
-Cell function (% of normal by HOMA) Decline of -Cell Function in the UKPDS Illustrates Progressive Nature of Diabetes 100 Time of diagnosis ? 80 60 40 Pancreatic function = 50% of normal 20 0 – 10 – 9 – 8 – 7 – 6 – 5 – 4 – 3 – 2 – 1 0 1 Time (y) UKPDS=United Kingdom Prospective Diabetes Study; HOMA=homeostasis model assessment. Adapted from Holman RR. Diabetes Res Clin Pract. 1998; 40(suppl): S 21 -S 25. U. K. Prospective Diabetes Study Group. Diabetes. 1995; 44: 1249 -1258. 2 3 4 5 6
Topic • • Epidemiology of DM Diagnosis of DM Classification & pathogenesis of DM Screening of diabetes Metabolic syndrome Complication of DM Goal in management of DM
SCREENING FOR DM (ADA) Who? People > 45 years old 2. People < 45 yo. , obesity ( BMI > 25 kg/m 2) with risk factors : 1. Frequency : Every 3 years How ? : Fasting plasma glucose ADA 2006
Screening for diabetes in adult • Age > 45 yr • Overweight (BMI >25 kg/m 2) • Family of diabetes (1 st degree relative) • Members of a high-risk ethnic population • Hypertension ( BP >140/90 mm. Hg) • HDL<35 mg/dl or TG >250 mg/dl • Previous IFG or IGT • Previous GDM or baby > 4 kg • Polycystic ovarian syndrome • History of vascular disease • Habitually physically inactive ADA 2006
การวนจฉยโรคเบาหวาน ประกอบดวยอยางนอย 1 ขอ และตองตรวจซำในวนตอมา. 1 Fasting plasma glucose (FPG) > 126 mg/dl or. 2 Casual plasma glucose (CPG) > 200 mg/dl + Symptoms or 2 -hour glucose concentration. 3> 200 mg/dl at 75 gram oral glucose tolerance test (OGTT( WHO 1998 ADA 2005
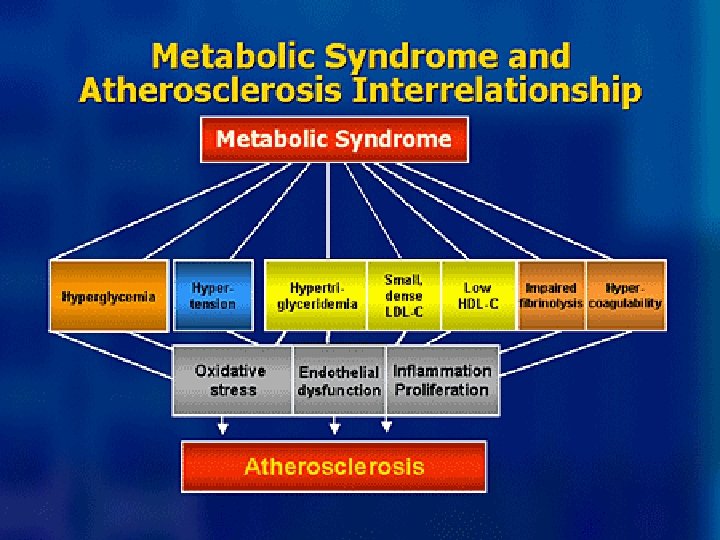
The Metabolic Syndrome • In 1988, Reaven proposed the existence of a metabolic syndrome • Constellation of risk factors for CVD • Use the term • • • Metabolic syndrome Syndrome X Insulin resistance syndrome Definition of Metabolic Syndrome. Circulation 2004; 109: 433 -438
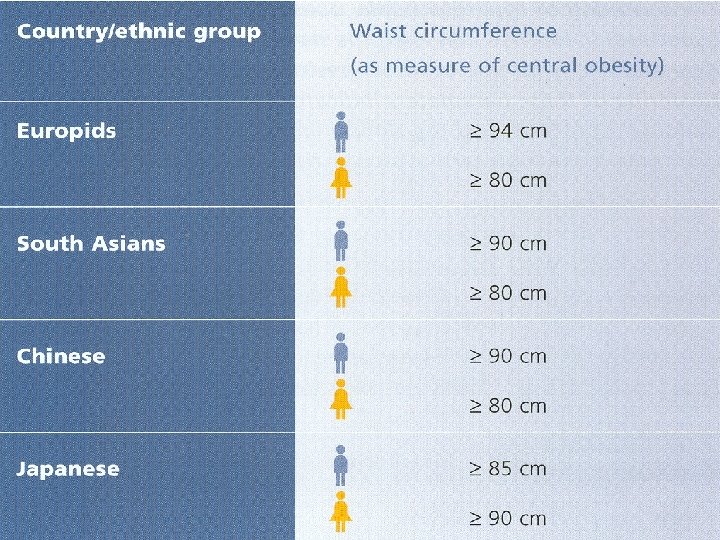
Metabolic syndrome IDF 2005 • Central obesity (BMI>30, waist circ. need not to be measured) waist circumference* 94 cm for Europid men 80 cm for Europid women, * with ethnicity specific values for other groups + > 2 criteria • Plasma glucose • Hypertriglyceridemia • Low HDL > 100 mg/dl > 150 mg/dl < 40 mg/dl (men); < 50 mg/dl (women) • Hypertension ≥ 130/85 mm. Hg IDF Consensus Worldwide Definition of the Metabolic Syndrome. www. idf. org.
Topic • • Epidemiology of DM Diagnosis of DM Classification & pathogenesis of DM Screening of diabetes Metabolic syndrome Complication of DM Goal in management of DM
Acute Complications of Diabetes Mellitus - Hypoglycemia - Diabetic Ketoacidosis (DKA) - Hyperosmolar Nonketotic Diabetic coma (HONK) Hyperosmolar hyperglycemic state - Infection (HHS)
50% of type 2 diabetes patients have complications at the time of diagnosis 1 MICROVASCULAR MACROVASCULAR Retinopathy, glaucoma or cataracts Cerebrovascular disease Nephropathy Coronary heart disease Neuropathy Peripheral vascular disease 1 UK Prospective Diabetes Study Group. UKPDS 33. Lancet 1998; 352: 837– 53.
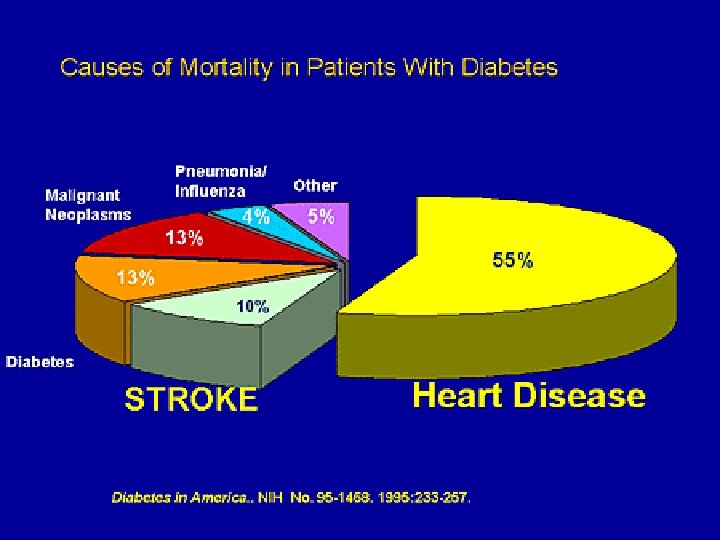
Diabetes Is Associated With Significant Global Morbidity and Mortality Morbidity 1, 2 • • CVD • 2 -4 times more likely to develop myocardial infarction or stroke Neuropathy • Up to 50% of persons with diabetes • A leading cause of amputation Retinopathy • A leading cause of blindness • After 15 years of diabetes • 2% blindness • 10% severe visual handicap Nephropathy • A leading cause of kidney failure • Accelerates CVD Mortality 2 • Annual diabetesassociated deaths worldwide • >800, 000 directly attributed to diabetes • ~4 million attributed to complications of diabetes • 50% of deaths in persons with diabetes in industrialised countries are due to CVD=cardiovascular disease. 1. International Diabetes Federation. Available at: http: //www. idf. org/home/index. cfm? node=201. Accessed 15 May 2004. 2. World Health Organization. Available at: http: //www. who. int/hpr/NPH/docs/gs_diabetes. pdf. Accessed 11 April 2004.
A 1% decrease in Hb. A 1 c significantly reduces microvascular and macrovascular complications Percentage reduction in relative risk corresponding to a 1% fall in Hb. A 1 c Any Diabetesdiabetes-related endpoint death All cause mortality MI Stroke 14% 12% * * Peripheral vascular Microvascular Cataract disease* extraction 0 – 5 – 10 21% – 15 43% 37% ** – 20 – 25 * 19% * * – 30 – 35 – 40 – 45 * * – 50 Lower extremity amputation or fatal peripheral vascular disease *P < 0. 0001; **P = 0. 035 Adapted from Stratton IM et al. UKPDS 35. BMJ 2000; 321: 405– 12.
Tight BP Control
UKPDS: Risk Factors for Coronary Artery Disease in Type 2 Diabetes Identified 5 major risk factors for CAD: Dyslipidemia (High LDL, Low HDL) Hyperglycemia Hypertension Smoking Turner, RC et al. BMJ 316: 823 -8, 1998
Multifactorial Intervention and Cardiovascular Disease in Patients with Type 2 Diabetes
Multifactorial Intervention and Cardiovascular Disease in Patients with Type 2 Diabetes ( STENO 2 ) • Randomized study to evaluate effect on CVD of an intensified, targeted, multifactorial intervention in T 2 DM with microalbuminuria • 160 patients follow up means 7. 8 years • Interventions: dietary, exercise, ACEI or ARB, vitamin mineral supplement, 150 mg ASA, tight glycemic, BP and lipid control
Primary composite endpoint* (%) Steno-2: effect of intensive versus conventional treatment on cardiovascular complications 60 50 Conventional therapy 40 ~50% reduction 30 20 10 Intensive therapy 0 0 12 24 36 48 60 72 Months of follow-up 84 96 Conventional 80 72 70 63 59 50 44 42 13 Intensive 78 74 71 66 63 61 59 19 n 80 *Primary composite endpoint of death from cardiovascular causes, non -fatal MI, CABG, percutaneous coronary intervention, non-fatal stroke, amputation or surgery for peripheral atherosclerotic artery disease Gaede P et al. N Engl J Med 2003; 348: 383– 93.
Percentage of patients who reached the intensive-treatment goals at a mean of 7. 8 y Patients % P <0. 001 P =0. 21 P =0. 19 P =0. 001 P=0. 06
DCCT/EDIC: Glycaemic control reduces the risk of non-fatal MI, stroke or death from CVD in type 1 diabetes Hb. A 1 C (%) 9 Conventional treatment 8 Intensive treatment 7 0 Cumulative incidence of non-fatal MI, stroke or death from CVD 1 2 3 4 5 6 7 8 DCCT (intervention period) 9 10 11 12 13 14 15 16 17 EDIC (observational follow-up) • Concept of Glucose memory: the better the control of glucose early in disease, the 57% risk reduction less the risk of complications later even in non-fatal MI, stroke or CVD death* control is less satisfactory. … in type (P =when 0. 02; 95% CI: 12– 79%) 1 diabetes without insulin resistance etc 0. 06 0. 04 0. 02 Years Conventional treatment Intensive treatment 0. 00 0 1 2 3 4 5 6 7 8 DCCT (intervention period) *Intensive versus conventional treatment 9 10 11 12 13 14 15 16 17 18 19 20 21 EDIC (observational follow-up) Years Adapted from DCCT. N Engl J Med 1993; 329: 977– 986. DCCT/EDIC. JAMA 2002; 287: 2563– 2569. DCCT/EDIC. N Engl J Med 2005; 353: 2643– 2653.
UKPDS: Risk Reduction: Glucose Control Study (After median 8. 5 yr. post-trial follow- up) 1997 2002 2007 Legacy 12% 10% effect P=0. 033 P=0. 029 Any diabetes related end point Microvascular disease 9% P=0. 040 25% 28% 24% p = 0. 009 p = 0. 001 Myocardial infarction 16% 14% p = 0. 052 p = 0. 042 15% P=0. 014 All cause mortality 6% 11% p = 0. 440 p = 0. 071 13% P=0. 007 Concept of glucose? memory: valid in type 2 diabetes
Topic • • Epidemiology of DM Diagnosis of DM Classification & pathogenesis of DM Screening of diabetes Metabolic syndrome Complication of DM Goal in management of DM
• Prevention of S/S of hyper/hypoglycemia • Prevention of acute and chronic complications • Good quality of life
Current recommendations of the Canadian and American Diabetes Associations “Diabetes must be. . . diagnosed earlier. And once diagnosed, all types of diabetes must then be managed much more aggressively” Canadian Diabetes Association “Therefore, the results of the UKPDS mandate that treatment of type 2 diabetes include aggressive efforts to lower blood glucose levels as close to normal as possible” ADA Canadian Diabetes Association. Can J Diabetes 2003; 27 (Suppl 2): 1– 163; ADA. Diabetes Care 2003; 26: S 28– 32.
GOAL Goal Plasma glucose - Average pre-prandial PG (mg/dl) 90 -130 - Peak postprandial PG (mg/dl) <180 - Hb. A 1 C (%) <7 (6. 5%) Lipid - Total Chol (mg/dl) <200 (180) - Triglyceride (mg/dl) <150 - HDL-C (mg/dl) M>40, F>50 - LDL-C : - age <40, total chol + 135<risk factor < 100 mg/dl - age >40, total chol , 135< 30 -40% of LDL-C ( (100 > -overt CVD ( very high risk) <70 BP (mm. Hg) <130/<80 ADA 2006
Goals of Glycemic Control ADA ACCE EASD IDF Hb. A 1 c (4. 0 -6. 0%) < 7. 0% 6. 5% FPG (preprandial) < 130 110 110 Postprandial < 180 140 Bedtime PG < 150 ? 135 ? 1. ADA. Diabetes Care 2004; 27: S 15– 35; 2. ADA Diabetes Care 2002; 25: S 35– 49; 3. Feld S. Endocrine Pract 2002; 8 (Suppl 1): 40– 82; 4. Asian-Pacific Type 2 Diabetes Policy Group. Type 2 diabetes: Practical targetsand treatment. 3 rd Edn; Hong Kong: Asian-Pacific Type 2 Diabetes Policy Group, 2002.
2008
2008