Topic 32 TwoWay Mixed Effects Model Outline Twoway


 • Yijk = μ + i + j + (")
 • Yijk = μ + i + j + (")


 • • • E(MSA) = σ2 + bnΣ i 2 /(a-1)+ nσ")
 • • • E(MSA) = σ2 + bnΣ i 2 /(a-1)+ nσ")
 • H 0 A: σ 2 = 0; H 1 A: σ")
 • H 0 A: σ 2 = 0; H 1 A: σ")


- Slides: 29
Topic 32: Two-Way Mixed Effects Model
Outline • Two-way mixed models • Three-way mixed models
Data for two-way design • Y is the response variable • Factor A with levels i = 1 to a • Factor B with levels j = 1 to b • Yijk is the kth observation in cell (i, j) k = 1 to nij • Have balanced designs with n = nij
Two-way mixed model • Two-way mixed model has – One fixed effect – One random effect • Tests: – Again use EMS as guide – Two possible models • Unrestricted mixed model (SAS) • Restricted mixed model (Text)
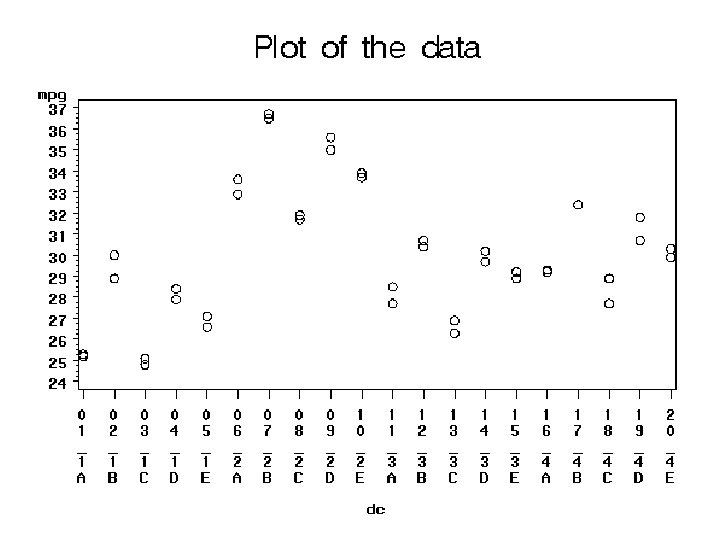
KNNL Example • KNNL Problem 25. 15, p 1080 • Y is fuel efficiency in miles per gallon • Factor A represents four different drivers, a=4 levels • Factor B represents five different cars of the same model , b=5 • Each driver drove each car twice over the same 40 -mile test course
Read and check the data a 1; infile 'c: . . . CH 25 PR 15. TXT'; input mpg driver car; proc print data=a 1; run;
The data Obs 1 2 3 4 5 6 7 8 9 10 mpg 25. 3 25. 2 28. 9 30. 0 24. 8 25. 1 28. 4 27. 9 27. 1 26. 6 driver 1 1 1 1 1 car 1 1 2 2 3 3 4 4 5 5
Prepare the data for a plot data a 1; set a 1; if (driver eq 1)*(car eq 1) then dc='01_1 A'; if (driver eq 1)*(car eq 2) then dc='02_1 B'; ⋮ if (driver eq 4)*(car eq 5) then dc='20_4 E';
Plot the data title 1 'Plot of the data'; symbol 1 v=circle i=none c=black; proc gplot data=a 1; plot mpg*dc/frame; run;
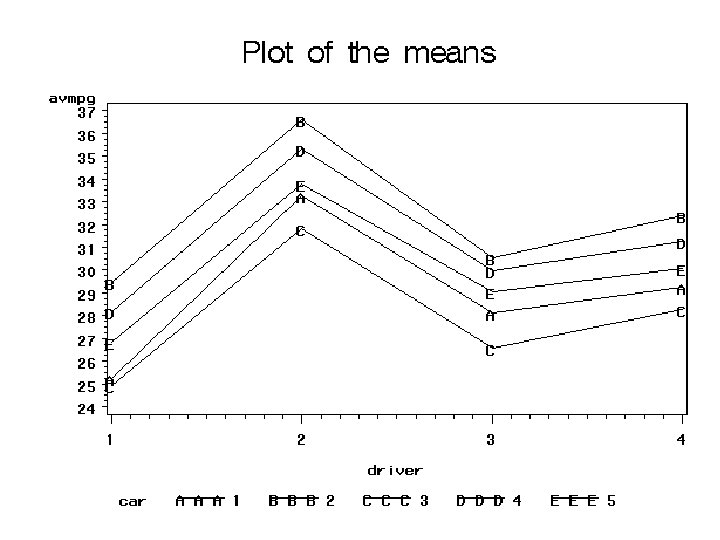
Find the means proc means data=a 1; output out=a 2 mean=avmpg; var mpg; by driver car;
Plot the means title 1 'Plot of the means'; symbol 1 v='A' i=join c=black; symbol 2 v='B' i=join c=black; symbol 3 v='C' i=join c=black; symbol 4 v='D' i=join c=black; symbol 5 v='E' i=join c=black; proc gplot data=a 2; plot avmpg*driver=car/frame; run;
Example Revisited • Suppose that the four drivers were not randomly selected and there is interest in comparing the four drivers in the study • Driver (A) is now a fixed effect • Still consider Car (B) to be a random effect
Mixed effects model (unrestricted) • Yijk = μ + i + j + ( )ij + εijk • Σ i =0 (unknown constants) • j ~ N(0, σ 2) • ( )ij ~ N(0, σ 2) • εij ~ N(0, σ2) • σY 2 = σ 2 + σ2
Mixed effects model (restricted) • Yijk = μ + i + j + ( )ij + εijk • Σ i =0 (unknown constants) • • Σ( b)ij =0 for all j • εij ~ N(0, σ2) • σY 2 = σ 2 + ((a-1)/a)σ 2 + σ2
Parameters • There a+3 parameters in this model – a fixed effects means – σ 2 – σ2
ANOVA table • The terms and layout of the ANOVA table are the same as what we used for the fixed effects model • The expected mean squares (EMS) are different and vary based on the choice of unrestricted or restricted mixed model
EMS (unrestricted) • • • E(MSA) = σ2 + bnΣ i 2 /(a-1)+ nσ 2 E(MSB) = σ2 + anσ 2 + nσ 2 E(MSAB) = σ2 + nσ 2 E(MSE) = σ2 Estimates of the variance components can be obtained from these equations, replacing E(MS) with table value, or other methods such as ML
EMS (restricted) • • • E(MSA) = σ2 + bnΣ i 2 /(a-1)+ nσ 2 E(MSB) = σ2 + anσ 2 Diff 2 2 E(MSAB) = σ + nσ here 2 E(MSE) = σ Estimates of the variance components can be obtained from these equations, replacing E(MS) with table value, or other methods such as ML
Hypotheses (unrestricted) • H 0 A: σ 2 = 0; H 1 A: σ 2 ≠ 0 – H 0 A is tested by F = MSA/MSAB with df a -1 and (a-1)(b-1) • H 0 B: σ 2 = 0; H 1 B : σ 2 ≠ 0 – H 0 B is tested by F = MSB/MSAB with df b -1 and (a-1)(b-1) • H 0 AB : σ 2 = 0; H 1 AB : σ 2 ≠ 0 – H 0 AB is tested by F = MSAB/MSE with df (a-1)(b-1) and ab(n-1)
Hypotheses (restricted) • H 0 A: σ 2 = 0; H 1 A: σ 2 ≠ 0 – H 0 A is tested by F = MSA/MSAB with df a -1 and (a-1)(b-1) • H 0 B: σ 2 = 0; H 1 B : σ 2 ≠ 0 – H 0 B is tested by F = MSB/MSE with df b 1 and ab(n-1) • H 0 AB : σ 2 = 0; H 1 AB : σ 2 ≠ 0 – H 0 AB is tested by F = MSAB/MSE with df (a-1)(b-1) and ab(n-1)
Comparison of Means • To compare fixed levels of A, std error is • Degrees of freedom for t tests and CIs are then (a-1)(b-1) • This is true for both unrestricted and restricted mixed models
Using Proc Mixed proc mixed data=a 1; class car driver; model mpg=driver; random car*driver / vcorr; lsmeans driver / adjust=tukey; run; SAS considers unrestricted model only…results in slightly different variance estimates
SAS Output Covariance Parameter Estimates Cov Parm Estimate car 2. 9343 car*driver 0. 01406 Residual 0. 1757 Type 3 Tests of Fixed Effects Num Den Effect DF DF F Value Pr > F driver 3 12 458. 26 <. 0001
SAS Output Effect driver driver 1 2 3 4 Least Squares Means Standard Estimate Error DF t Value Pr > |t| 26. 9300 0. 7793 12 34. 56 <. 0001 34. 1500 0. 7793 12 43. 82 <. 0001 28. 8500 0. 7793 12 37. 02 <. 0001 30. 2600 0. 7793 12 38. 83 <. 0001
SAS Output Differences of Least Squares Means Effect driver _driver 1 2 driver 1 3 driver 1 4 driver 2 3 driver 2 4 driver 3 4 Standard Estiate Error DF t Value Pr > |t| Adjustment Adj P <. 0001 -7. 2200 0. 2019 12 -35. 76 <. 0001 Tukey. Kramer <. 0001 -1. 9200 0. 2019 12 -9. 51 <. 0001 Tukey. Kramer <. 0001 -3. 3300 0. 2019 12 -16. 49 <. 0001 Tukey. Kramer <. 0001 5. 3000 0. 2019 12 26. 25 <. 0001 Tukey. Kramer <. 0001 3. 8900 0. 2019 12 19. 26 <. 0001 Tukey. Kramer <. 0001 -1. 4100 0. 2019 12 -6. 98 <. 0001 Tukey. Kramer
Three-way models • We can have zero, one, two, or three random effects • EMS indicate how to do tests • In some cases the situation is complicated and we need approximations of an F test, e. g. when all are random, use MS(AB)+MS(AC)MS(ABC) to test A
Last slide • Finish reading KNNL Chapter 25 • We used program topic 32. sas to generate the output for today