Topic 2 5 Investigating Ecosystems Investigating Ecosystems Review


 FACTORS • Once the abiotic conditions within an environmental gradient have")


 explained")

 Find three identical (ish)")


")


, however one")

 Flower Species Sample 1 Sample 2 Daisy")
 Lepidoptera (butterfly) Coleoptera (beetle) Hymenoptera (wasp) Hymenoptera (bee)")


 Lepidoptera (butterfly) Coleoptera (beetle) Hymenoptera (wasp) Hymenoptera (bee)")


- Slides: 60
Topic 2. 5: Investigating Ecosystems
Investigating Ecosystems • Review Zonation and Succession on your notes
How do we know what is going on inside an ecosystem? • In order to understand an ecosystem properly we need to measure various biotic and abiotic factors.
Monitoring Abiotic Factors • Ecosystems can be roughly divided into: • Marine • Freshwater and • Terrestrial systems
Monitoring Abiotic Factors • Complete the diagram in your notes
MONITORING BIOTIC (LIVING) FACTORS • Once the abiotic conditions within an environmental gradient have been measured, we can begin to ask questions about the distribution of organisms within the study area: • • Which species are present The size of a particular population of organisms The productivity in a particular area The diversity of a particular area
IB Animal Experimentation Policy • You may not perform an experimentation using animals that involves: • Pain, undue stress, damage to health of animal • Death of animal • Drug intake or dietary change beyond those easily tolerated by the animal • Consider: • Using cells, plants or simulations instead • If using humans you MUST have written permission • AISD safety contracts apply at ALL times during ALL labs • No experiments may be done that have any risk of transferring blood-borne pathogens
COLLECTING DATA • It is almost impossible to collect every possible data point • Use sampling methods to make estimations • Use random sample from an entire ecosystem • In order to avoid bias it is important that these methods are truly random. • All organisms must have an equal chance of being captured.
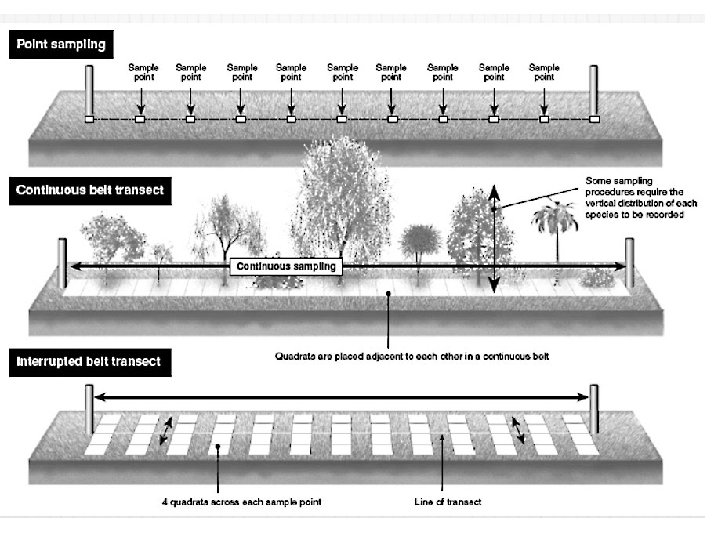
COLLECTING DATA • Two methods used in ecology to determine where to collect a sample are: • Quadrats • Transects.
Assumptions Made When Sampling • The sample is representative of the whole system • It is necessary to take enough samples so that an accurate representation is obtained • It is important to avoid bias when sampling
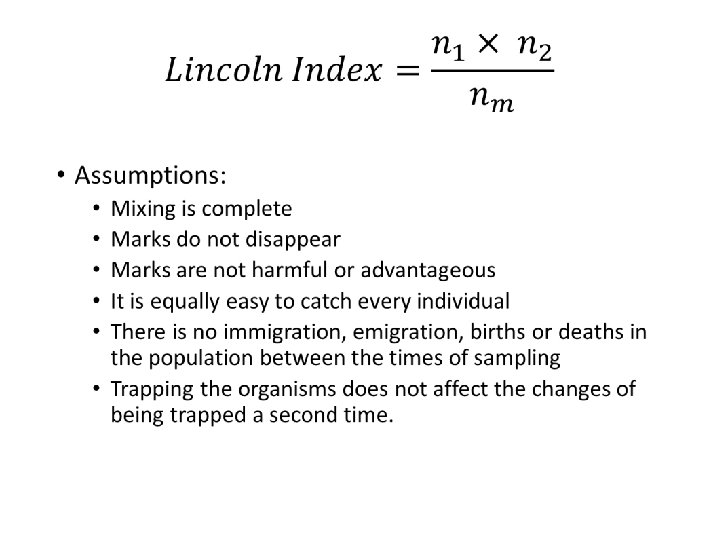
Common Sampling Methods • Abundance of Non-motile Organisms • Transects and Quadrants • Abundance of Motile Organism • Actual Count (very difficult if large system) • Lincoln Index • Capture – Mark - Recapture • Species Diversity • Simpson Diversity Index • For comparing 2 habitats or the change in one habitat over time
Homework: Measuring abiotic factors • Choose a one factor from each type of ecosystem and research how it is measured. • Produce a detailed methodology with supporting diagrams if necessary. Marine: Salinity, p. H, temperature, dissolved oxygen, wave action. Freshwater: Turbidity, flow velocity, p. H, temperature, dissolved oxygen. Terrestrial: Temperature, light intensity, wind speed, particle size, slope, soil moisture, drainage, mineral content.
How do we decide where to measure? • Quadrats • Transects
Estimating Populations of Plants • Quadrat Estimation • Population Density- The • number of plants within the • given area of the quadrat (m 2) • Percentage Coverage • How much of the area of a • quadrat is covered by plants? • Frequency- How often does a plant occur in each quadrat? • Acacia senegalensis was present in 47 of 92 quadrats, for a frequency of 51%
Grid Quadrate • Measures percent frequency – the % of quadrats in which the species is found • OR • Measures percent coverage –the % of area within a quadrat covered by a single species • NOTE: When you are looking at one species at a time • If not using a 10 x 10, you must turn into a percentage (squares covered/total # of squares)
Percent Frequency •
Percent Coverage • Percent Coverage 18 1 m • Find the percent coverage • Count full squares • Now combine pieces to make full squares • Calculate percentage coverage 1 m 14 22 24 24 1 2 14 15 3 4 15 17 21 23 19 20 12 13 13 17 18 5 6 12 16 7 8 9 10 11 22 16 19 21 23 20 12
How choose quadrat size? • Think about the size of the organism. • Think about the area of the system. • The smaller the quadrat the more accurate, however the smaller the sample size • Larger quadrats increase inaccuracy but allow for broader sample of an area
How do we know where to place the quadrat/sample? • “Throw it over your shoulder” • Draw a grid over your sample area. • Use a random number generator. • This is the square that you sample. • If your habitat has two (or more) different habitats/vegetation types then samples should be taken in each area.
Transects • A TRANSECT - A line, strip or profile of vegetation which has been selected for study. measure any of these abiotic and/or biotic components of an ecosystem along an environmental gradient
Transects • Look at changes over an environmental gradient e. g. zonation • Need more than 1 for a valuable results. (At least 3)
Where to transect? • Random number generator. • Random direction. • Unless you want to particularly follow a gradient. • Complete a transect of your ecosystem.
What to measure? • Biotic and Abiotic Factors • You have (for HW) explained how to measure various abiotic factors, we are going to discuss some of the biotic factors.
Measuring Biomass • Get a sample of the organisms, dry them out completely in a dehydrating oven (to remove all water!), find the mass and extrapolate : • If you collect 10 plants, dry them out and find their average dry biomass to be 20 g, what would the biomass of a population of 2500 plants be? • 50, 000 g • Remember – biomass can be used to create pyramids of biomass when looking at energy transfers and is needed for many productivity calculations!
Primary Productivity Different methods for terrestrial and aquatic habitats. 1) Find three identical (ish) areas 2) Dig up one and calculate its biomass. 3) Cover one with black plastic, and leave one open. 4) A set amount of time later measure the biomass of the two site. 5) Initial – Light = NPP 6) Initial – Dark = Respiration 7) Light – Dark = GPP
Secondary Productivity • GSP = food eaten – faecal loss • NSP = GSP – Respiration • Take the mass of herbivore. • Measure all the food it eats and its faeces. • After a certain amount of time measure the mass of the animal again.
Catching motile organisms
Terrestrial • Pitfall Traps • Sweep nets • Tree Beating • Tullgren Funnels (invertebrates) Aquatic • Kick sampling
Pitfall Trap • Insects and other small invertebrates • Placed in a transect • Number of each species recorded • No fluid in the bottom
Sweep nets
Tree Beating
Kick sampling
Estimating abundance of motile organisms • Direct methods: actual counts and sampling • Indirect methods: Lincoln index
Percentage cover
Capture – Mark – Recapture • Capture organisms and count • Mark organisms with non-toxic, semi-permanent, substance that will not increase the likelihood of harm to the organism • Release organism back into environment • The time before you do another capture will depend on; the mobility of the organism, r or K strategists
Lincoln Index •
Your Turn Use the Lincoln Index to monitor this mountain gorilla population over time: Year n 1 n 2 nm 2003 23 25 18 2004 26 30 22 2005 27 35 21 2006 16 18 15 2007 18 19 16 2008 17 24 17 P Gorilla hunting is illegal in some regions and carefully controlled in others, though there is a high demand for illegal bush-meat. • Deduce between which two years illegal hunters were active in the forest. • Explain the long recovery time for the population.
Some Possible Sources of Error with Capture – Mark – Recapture • Emigration & Immigration • Natural disaster or disturbance between captures • Trap happy or trap shy individuals • Organisms did not have enough time to disperse back into ecosystem • Animals lost marks between recapture
Species richness and diversity • Richness is the number of species • Diversity is number of species and the individuals in each species.
Species Diversity • The two main factors taken into account when measuring species diversity • 1. Richness • A measure of the number of different species present in a particular area. • The more species present in a sample, the 'richer' the sample. • Takes no account of the number of individuals of each species present. It gives as much weight to those species which have very few individuals as to those which have many individuals. • 2. Relative Abundance • The relative number of individuals of each species present http: //www. countrysideinfo. co. uk/simpsons. htm
Simpson diversity index • D = Simpson diversity index • N = total number of organisms of all species found • n = number of individuals of a particular species Number of individuals of species A B C Ecosystem 1: 25 24 21 Ecosystem 2: 65 3 4 • Calculate the diversity index for both ecosystems
Simpson diversity index • Both ecosystems have the same species richness (3), however one is far more diverse. • High D-values associated with stable ancient sites • Low D-values associated with disturbed ecosystems • Crop fields will have very low D-value (farmers do not want other species competing with there crops) • NOTE: low values for D in Artic tundra may represent ancient stable sites as growth is so slow there and diversity is low.
Analyzing Simpson’s Index • Used to compare 2 different ecosystems or to monitor an ecosystem over time • D values have no units and are used as comparison to each other • High D Value Indicates: • Stable and ancient site • More diversity • Healthy habitat • Low D Value Indicates: • Dominance by one species • Environmental stress • Pollution, colonization, agriculture
Using Simpson’s Index: Numbers of individuals (n) Flower Species Sample 1 Sample 2 Daisy 300 20 Dandelion 335 49 Buttercup 365 931 Total (N) 1000 Find the diversity index for sample 1:
YOUR TURN Solution Organism Orthoptera (grasshopper) Lepidoptera (butterfly) Coleoptera (beetle) Hymenoptera (wasp) Hymenoptera (bee) Description Green with red legs Meadow 1 16 Meadow 2 25 Brown with yellow stripe. Large, blue Small, blue Red & Blue Black Purple Striped 5 2 26 3 12 17 9 12 4 5
• Sample 1 has a higher Simpson’s Biodiversity index than Sample 2 even though it has the same number of species present and the same number of total individuals because there is more even distribution of the organisms through the species.
YOUR TURN The insects in two meadows are being investigated. The following data was collected. Compare the diversity of the two meadows Organism Description Orthoptera (grasshopper) Lepidoptera (butterfly) Coleoptera (beetle) Green with red legs Brown with yellow stripe. Large, blue Hymenoptera (wasp) Hymenoptera (bee) Black Small, blue Red & Blue Purple Striped Meadow 1 Meadow 2 16 5 26 3 12 25 2 17 9 12 4 5
YOUR TURN Solution Organism Orthoptera (grasshopper) Lepidoptera (butterfly) Coleoptera (beetle) Hymenoptera (wasp) Hymenoptera (bee) Description Green with red legs Meadow 1 16 Meadow 2 25 Brown with yellow stripe. Large, blue Small, blue Red & Blue Black Purple Striped 5 2 26 3 12 17 9 12 4 5
How do you identify what you have found?
Dichotomous Keys • Method of identifying an organism • Dichotomous = divided in two parts • Numbered series of pairs of descriptors • One matches the species, the other is clearly wrong • Each pair leads to another pair of descriptors OR to an identification • Features chosen for descriptors should be easily visible and observable
Why do we classify? • Identify organisms • Compare organisms • Identify relationships among organisms • Communicate with others (universal language) • Identify evolutionary relationships
Why do we classify? �What am I? �Firefly �Lightning bug �Glow Fly �Blinkie � Golden Sparkler �Moon bug �Glühwürmchen �Luciérnaga �Luciole �We all have different names for the same organism…this is a problem for communication.
Dichotomous keys
Dichotomous Keys http: //gottalovebio. wikispaces. com/file/view/candy_class. _key. jpg/162207257/candy_class. _key. jpg http: //www. field-studies-council. org/publications/resources/ks 3/images/Liqorice-key. jpg
Creating Dichotomous Keys • REMEMBER: • There always only 2 choices (1 a or 1 b) • You may start with a branching diagram but this must be turned into a outline form for final draft • It is easiest to start by grouping all objects into 2 groups, then take one group and divide into 2 again until you get to individual items. • Traits should be used that ANYONE would be able to observe and come to the same conclusion • When naming your organisms they should have a Genus species name
Create your own key • Using the species in front of you create a dichotomous key for 8 species. • Avoid using words like “big”. • Use quantitative, comparative descriptors. • Don’t over complicate things.
Alternatives • Photos and illustrations • DNA analysis • Field guide • Consider habitat • Even though two things looks similar they may live in different habitats. • Allows certain species to be eliminated.