Topic 13 Functions how can we model relationships


- Slides: 17
Topic 13 Functions: how can we model relationships between quantities?
8. 4. 1 Representing Relationships A linear equation is an equation with a graph that is a straight line. Some equations contain more than one variable.
8. 4. 2 Relations A relation is any set of ordered pairs. Relations can be represented as a table and as a graph. The domain of the relation is the set of x-coordinates. The range of the relation is the set of y -coordinates.
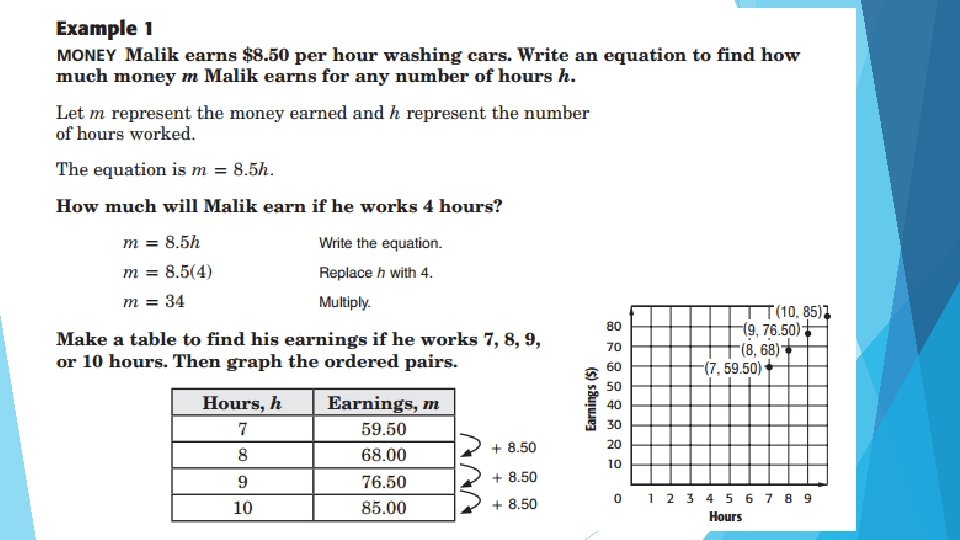
Example 1
8. 4. 3 Functions A function is a relation in which each member of the domain (input value) is paired with exactly one member of the range (output value). You can organize the input, rule, and output of a function using a function table.
8. 4. 4 Linear Functions A function in which the graph of the solutions forms a line is called a linear function. A linear function can be represented by an equation, a table, a set of ordered pairs, or a graph.
8. 4. 5 Compare Properties of Functions can be represented by a table, a graph, an equation, or words. You can compare two functions represented in different forms.
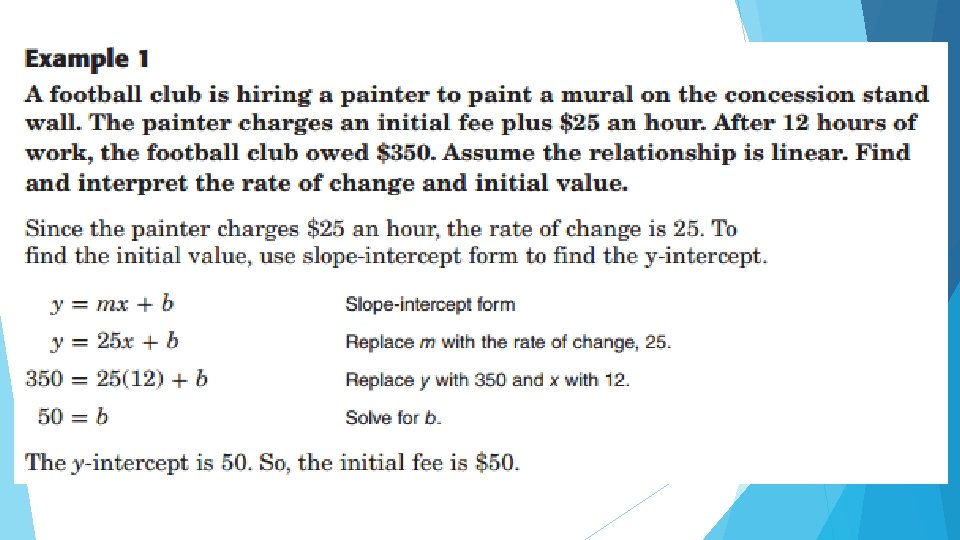
8. 4. 6 Construct Functions The initial value of a function is the corresponding y-value when x equals 0. You can find the initial value of a function from graphs, words, and tables.
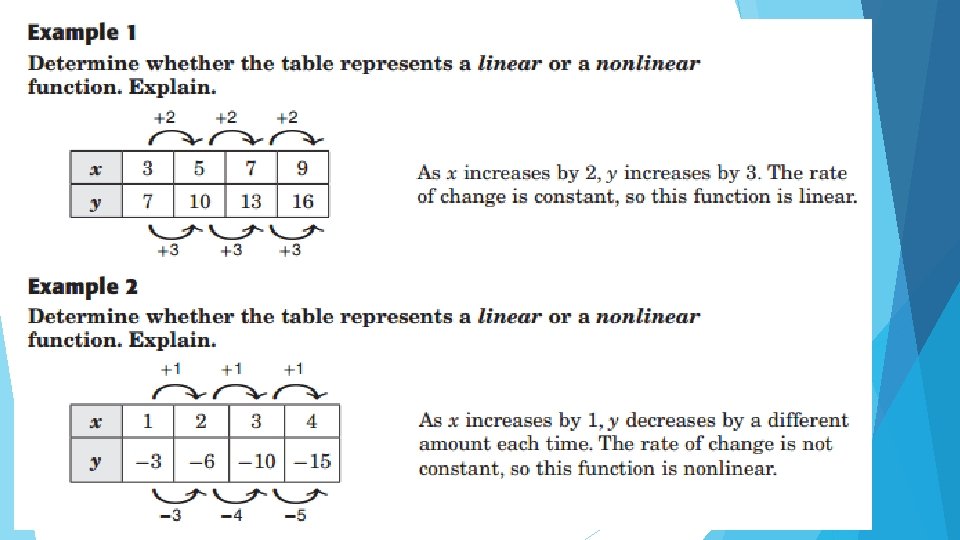
8. 4. 7 Linear and Nonlinear Functions Linear functions represent constant rates of change. Their graphs are straight lines. For nonlinear functions, the rate of change for is not constant. That is, the values do not increase or decrease at the same rate. Therefore, their graphs are not straight lines. You can use a table to determine if the rate of change is constant.
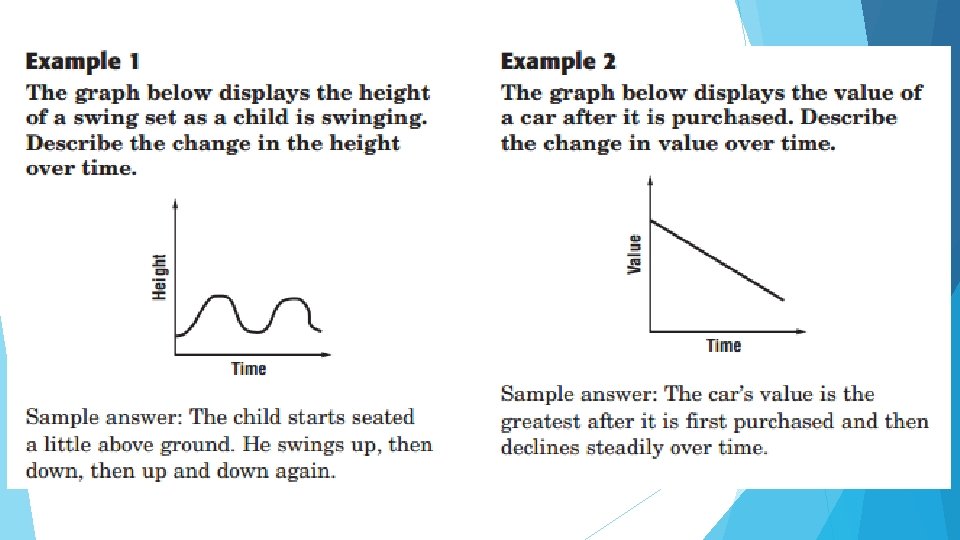
8. 4. 9 Qualitative Graphs Qualitative graphs are graphs used to represent situations that may not have numerical values or graphs in which numerical values are not included. Axes are labeled but do not include numerical values. You can see the relationship between time and the number of students.