TOPIC 1 Tools of the Biology Lab Exercise

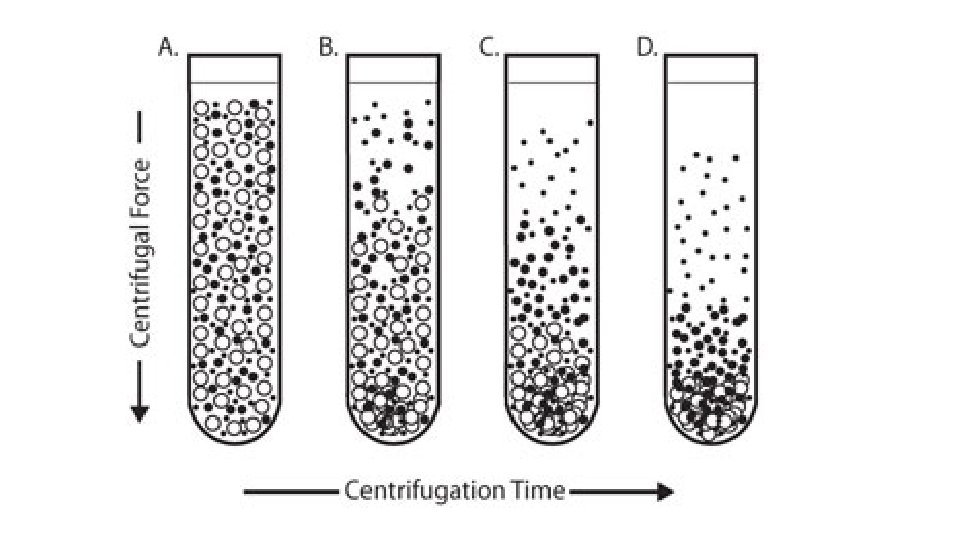
TOPIC 1: Tools of the Biology Lab. Exercise 1: Spectrophotometer Exp. 1: concentration of unknown dye. Exp. 2: Absorption spectra of dyes. Exercise 2: Liquid maesurements Exp. 1: accuracy of 100 ml cylinder. Exp. 2: accuracy of 10 ml serological pipette. Exp. 3: accuracy of 1 ml micropipettor. Exercise 3: Sedimentation and centrifugation.

Main Menu.
 Measurement Mode. Use left-and-right key to")
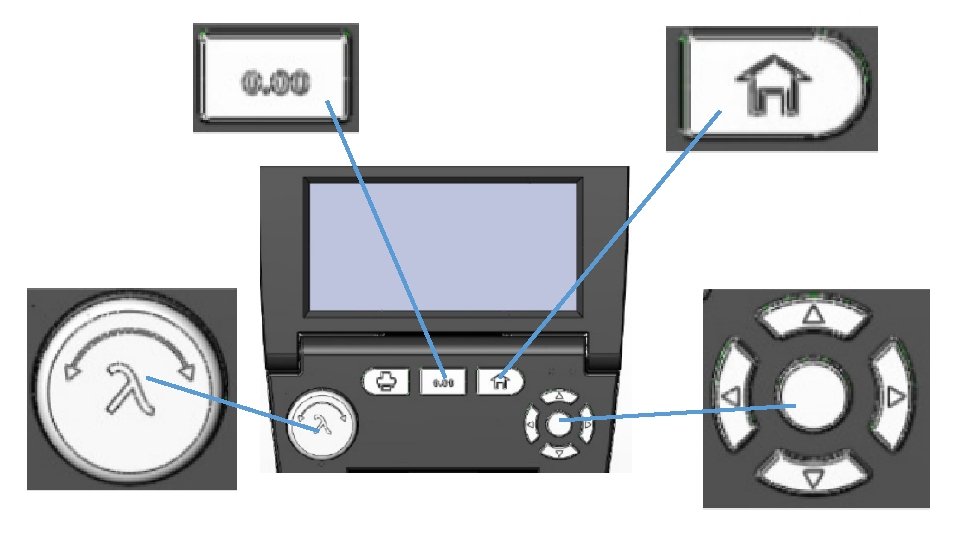
Use up-and-down key to select (text turns green) Measurement Mode. Use left-and-right key to toggle between %T or Abs. Select Abs.

Select Measuremtn and use leftand-right key or l knob to set your measurement wavelength. Use the arrow keys to select GO. Press return.
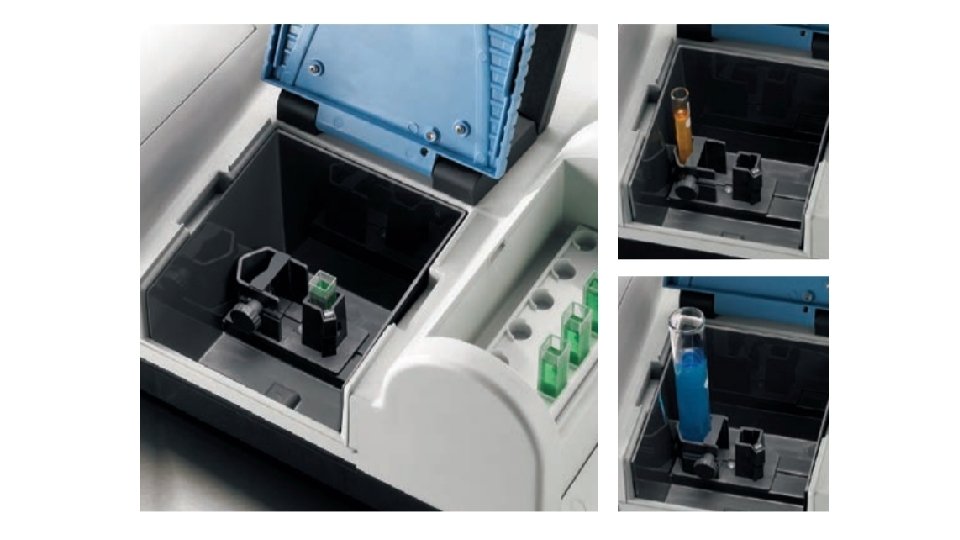

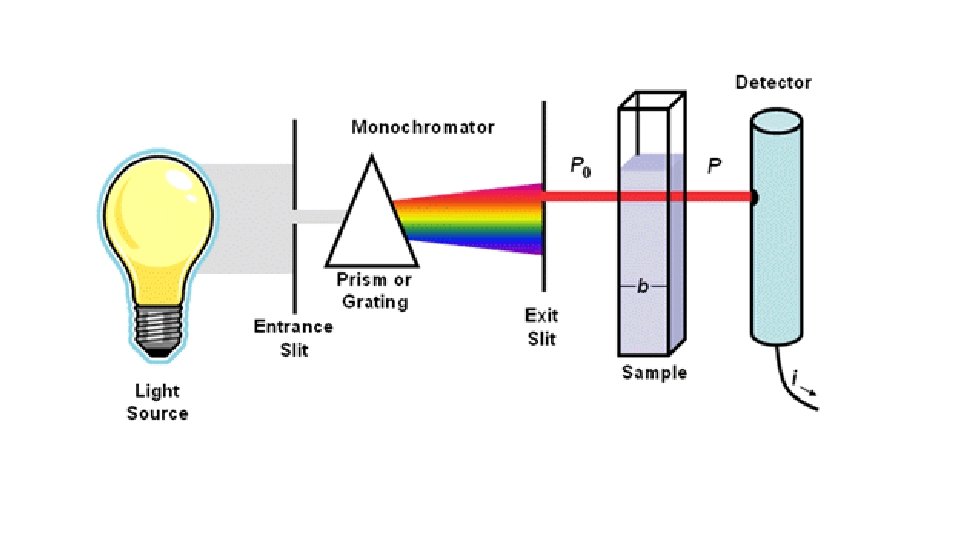
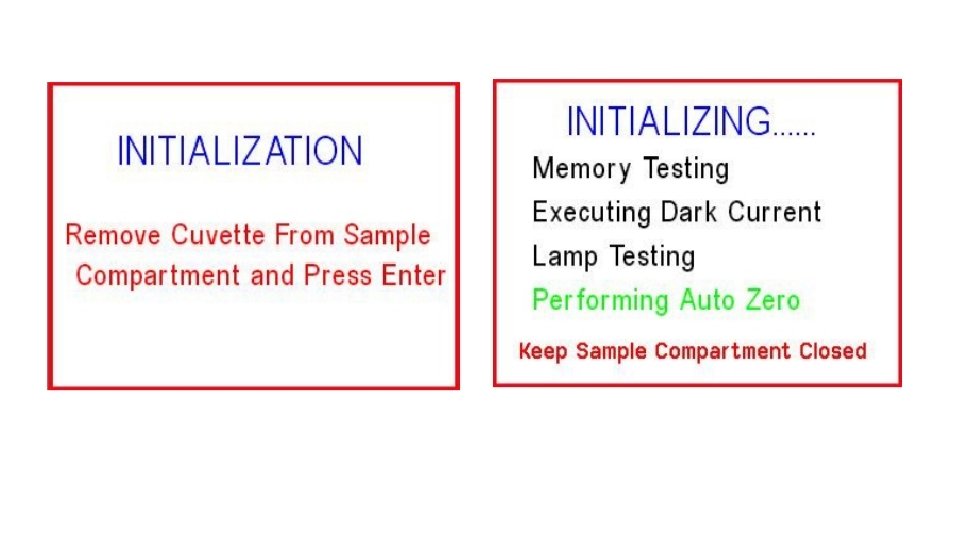
Place a cuvette containing a blank solution in the sample stage and press 0. 00 and wait until the screen displays the message “Performing Auto Zero”. The instrument will restart live display readings as soon as the auto zero measurement is complete. To freeze the display, press Enter.

Replace blanc cuvette with sample cuvette. Press Enter to measure and freeze display by pressing Enter again.
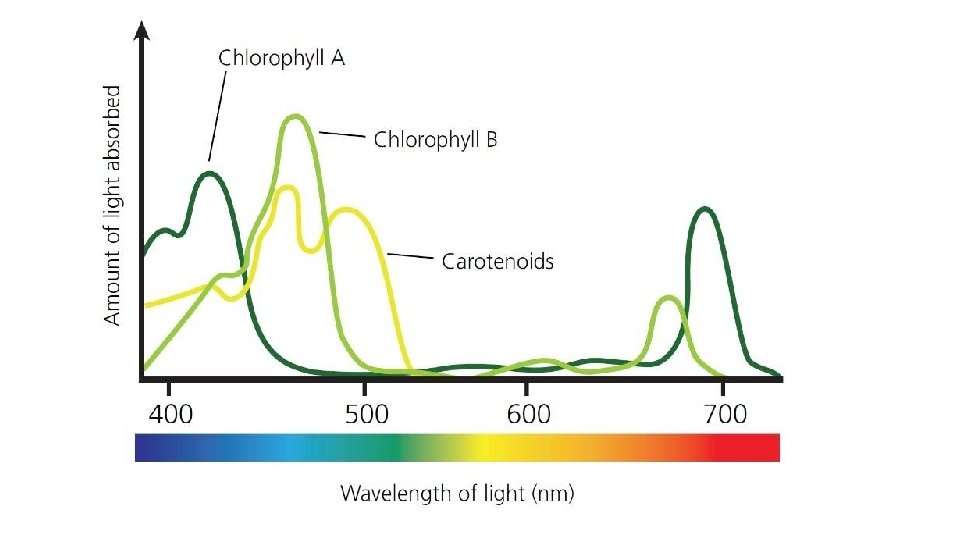

Figure 1. Absorbance spectra of red, blue, and purple dye. Measure the absorbance of a red, blue, and purple dyes from 400 nm to 700 nm in 20 nm increments at room temperature using a Spectronix 21 spectrophotometer. The red dye had an absorbance maximum at 500 nm and the blue dye had a maximum at 620 nm. The purple dye was a combination of the red and blue dye.
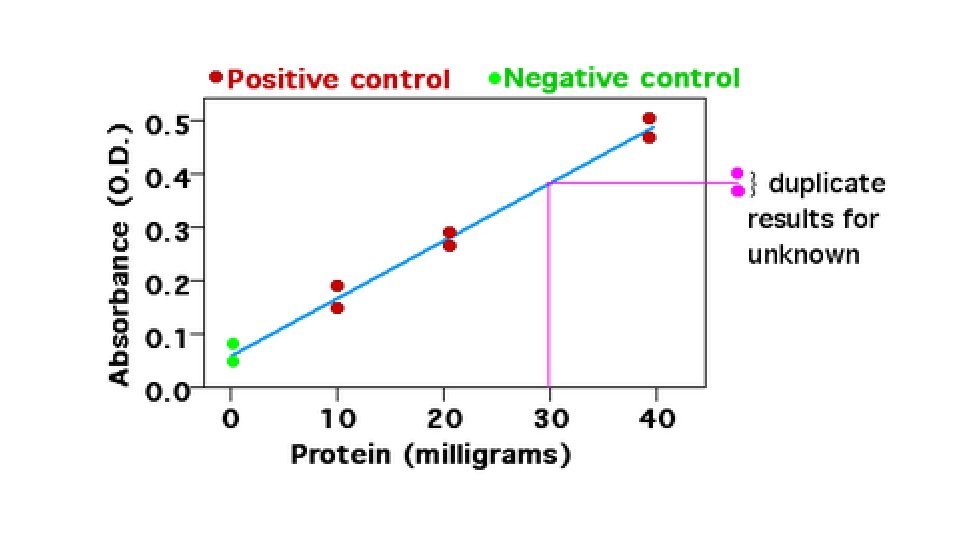
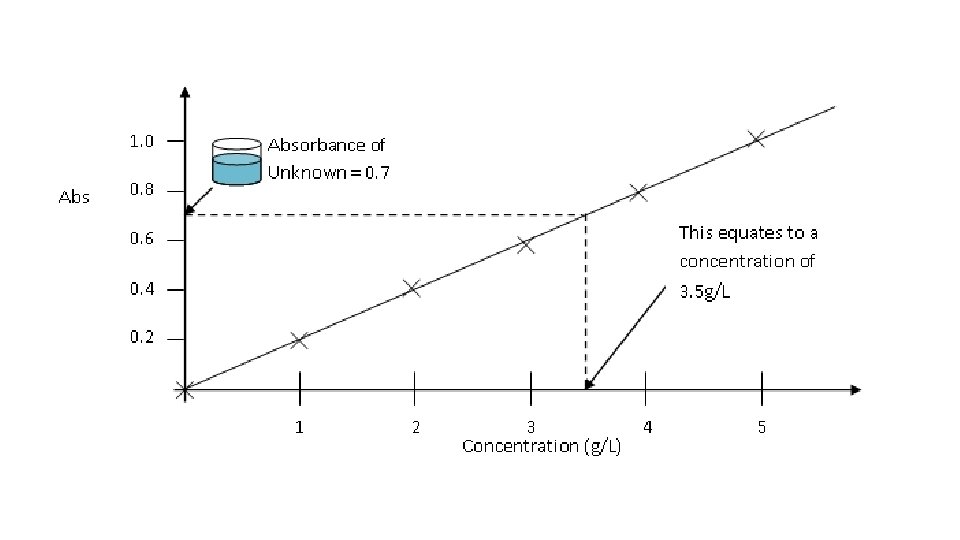

Figure 1. Standard curve of yellow dye at 420 nm. We measured the optical density at 420 nm of four concentrations of yellow dye (1, 2, 3, and 4 drops per sample) using a Spectronic 200 E spectrophotometer at RT. The OD of standard 1 (0. 217 + 0. 0070) was significantly smaller (P<0. 05, student’s t-test) than that of standard 2 (0. 410 + 0. 0057), the OD of standard 2 was significantly smaller (P<0. 05) than that of standard 3 (0. 619 + 0. 0045) and the OD of standard 3 was significantly smaller (P<0. 05) than that of standard 4 (0. 806 + 0. 087). We calculated the standard curve (linear regression y=0. 1977 x + 0. 0186, R 2= 0. 9996). We measured the OD at 420 nm of the unknown sample of the yellow dye(0. 699 + 0. 0054) and used the standard curve to determine its concentration (3. 44 drops per sample).

Topic 1: Tools of the laboratory. Exercise I, Experiment 2. Goal: Determine the absorbance spectrum of a dye. Method: Measure the absorbance of a red, blue, and purple solution from 400 nm to 700 nm in 20 nm increments at room temperature using a Spectronic 200 E spectrophotometer. Results: The spectrum of the red dye showed one large peak with maximum at 500 nm (Figure 1). The spectrum of the blue dye had a single broad peak with maximum at 620 nm. The spectrum of the purple dye had two peaks one with maximum at 500 nm and one with maximum at 620 nm. Conclusion: The red dye had an absorbance maximum at 500 nm and the blue dye had a maximum at 620 nm. The purple dye was a combination of the red and blue dye. Explanation: The red dye absorbs blue light; the blue dye absorbs red light.
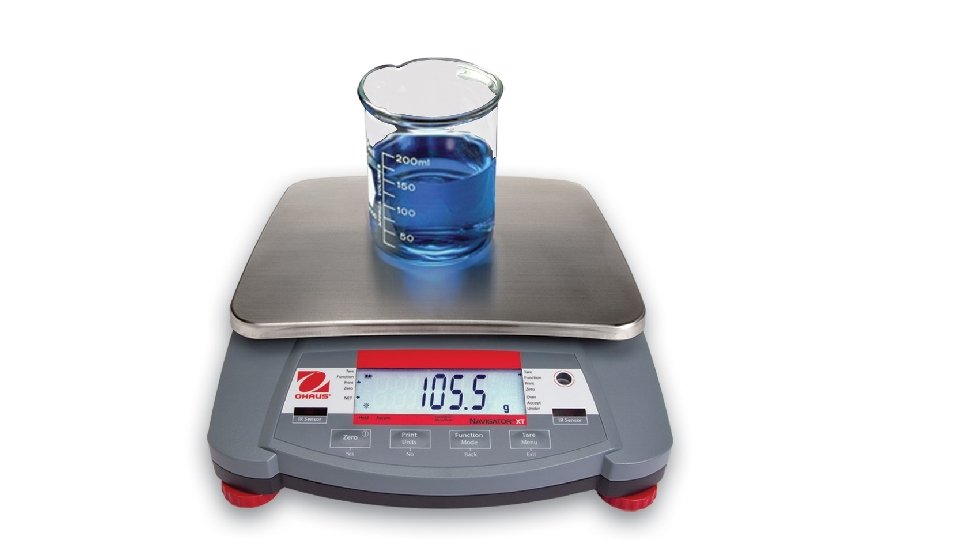

Measure by mass 100 ml and 10 ml of water.

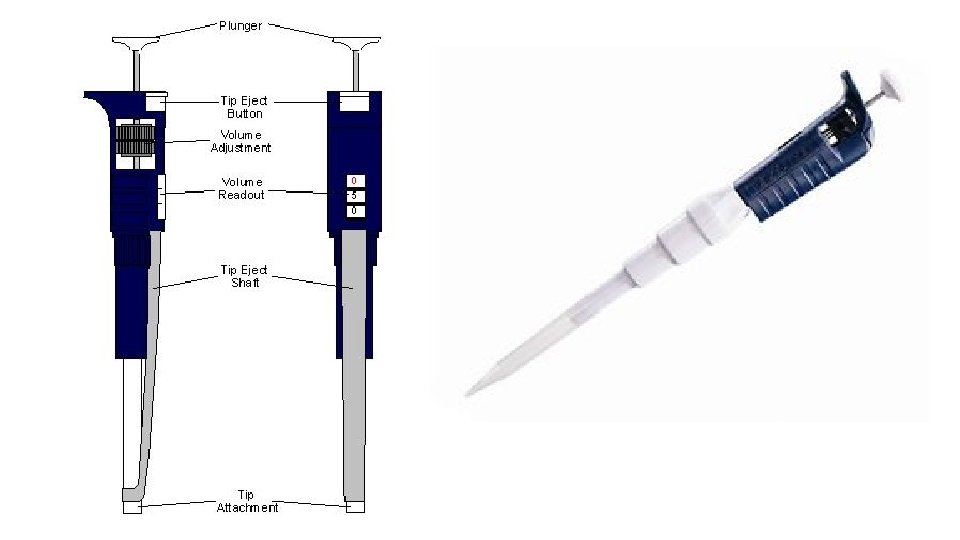
Measure 10 ml and 1 ml of water by mass.

- Slides: 27