Tools of the Astronomer Magnitudes and Spectra The


 must always be the same •")


- Slides: 34
Tools of the Astronomer: Magnitudes and Spectra
The magnitude system: how bright is a star? • The ancients recognized that the brightest and faintest stars were very different in appearance • They wanted a way to catalog stars by brightness • Hipparchus (Greek, ~ 100 BC) used 6 categories, 1— 6, which we now call “magnitudes”, typically m=1, m=2, etc.
More than 2, 000 years later, we still use the identical system! • (And boy, are most people we sorry we do!) • Hipparchus apparently thought the brightest stars were the most important, “Class 1”, so m=1 stars are brighter than m=2. So the system runs backwards; higher numbers are less bright.
Today we can measure the brightness of stars very precisely: “photometry” “Charge Coupled Device” “CCD”
Our ability to do very accurate photometry reveals all kinds of problems with the magnitude system! • It’s not linear: a m=1 star is not twice as bright as an m=2 star; it’s about 2. 5 x as bright • Hipparchus’s catalog got some of the brightest stars wrong; a few are brighter than m=1. So we have to call them m=0, and even m=-1. • We can measure some brighter things than stars in the sky: Jupiter (-3), Venus (-4), full Moon (-12), Sun (-27)!
Our ability to do very accurate photometry reveals all kinds of problems with the magnitude system! • The faintest object visible to the naked eye on a dark night are about m=6 • The faintest objects detectable by photometry with the largest telescopes are about m=28
The magnitude system turns out not to be linear • The response of the human eye turns out not to be linear with increasing brightness, which fooled Hipparchos • If you show someone 2 stars, “a” and “c”, and ask them to find a star halfway in between in brightness, called “b”, they will find an object with a/b=b/c, not a=2 b, b=2 c • Modern photometry does reveal that m=1 stars are almost exactly 100 x brighter than m=6 stars
An accurate way to calculate magnitudes The difference in magnitude between any two objects (1 and 2) is: m 2 – m 1 = 2. 5 x log (brightness 1/brightness 2) Example: If star 1 is 100 x brighter than star 2, m 2 – m 1 = 2. 5 x log (100) = 2. 5 x 2 = 5 mag difference
Photometers today are so sensitive that they can measure differences of 1% • If we can easily tell the difference between a m=2 and m=3 star, what do we call it? m=2. 5 • We can measure differences as small as 1% m 2 – m 1 = 2. 5 x log (brightness 1/brightness 2) m 2 – m 1 = 2. 5 x log (1. 01/1. 00) = 2. 5 x 0. 004 = 0. 01 mag A 1% brightness difference is 0. 01 mag, 2% is 0. 02 mag • So sometimes we have to use 2 decimal places, e. g. , we can measure the difference between a m=2. 50 star and a m=2. 51 star.
The spectrum of light: extracting information from little dots
What is Light? • It’s not made of atoms; it has no mass • It has a dual personality: sometimes it behaves like a massless “particle” carrying some energy, but sometimes it behaves like a wave, with a wavelength • The light wave can travel through – nothing! (How do we know that light waves actually can travel through a vacuum? What’s an example? )
Measuring light in the wave version. A wave has two characteristics, a wavelength and a frequency • Measuring the wavelength is simple: • Measuring the frequency is also pretty simple, how many waves go by each second • A pretty obvious relation for the speed (velocity) of the wave: Velocity = wavelength x frequency
Einstein realized that the speed of light (“c”) must always be the same • Velocity = wavelength x frequency • c = wavelength x frequency • So, for light waves, if we know either the wavelength or frequency, we can immediately calculate the other • With electronic equipment, we can accurately measure with the frequency or wavelength of light, but, they are measuring the same thing • “How old are you? ” “I was born in 2001. ” “I’m 16 years old. ” Different units, same measurement, same answer
There is a huge range of possible wavelengths and frequencies of light Units to measure frequency: “cycles per second”, now called “Hertz” Units to measure wavelength: any length unit, e. g. , meters The entire range of all possible wavelengths/frequencies is called “the electromagnetic spectrum”
Our eyes can detect only a tiny fraction of the possible wavelengths of light 3 x 10 -7 m 10 x 10 -7 m These wavelength units are so small that they’re clumsy, so we typically use the length unit “Ångstrom” (Å) instead of meters 1 Å = 10 -10 meters “visible light” is then 3, 000 Å – 10, 000 Å Anders Ångstrom
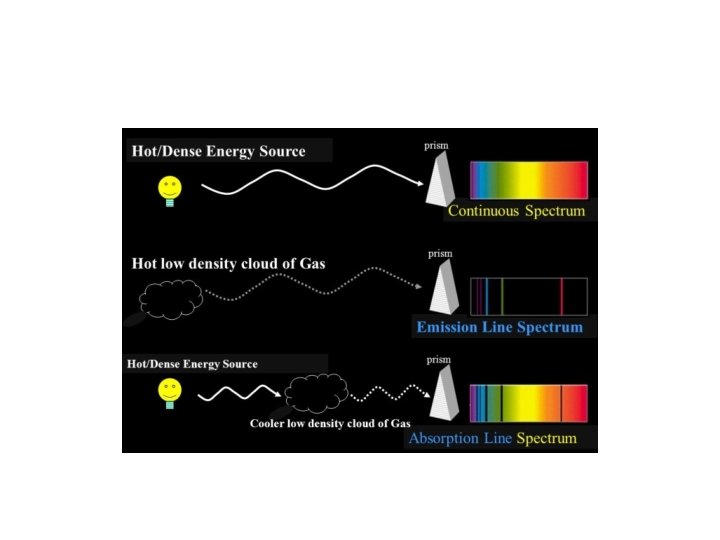
Dispersing light into wavelengths: light from warm bodies
Dispersing light into wavelengths: light from dilute gases
Dispersing light into wavelengths: light from dilute gases
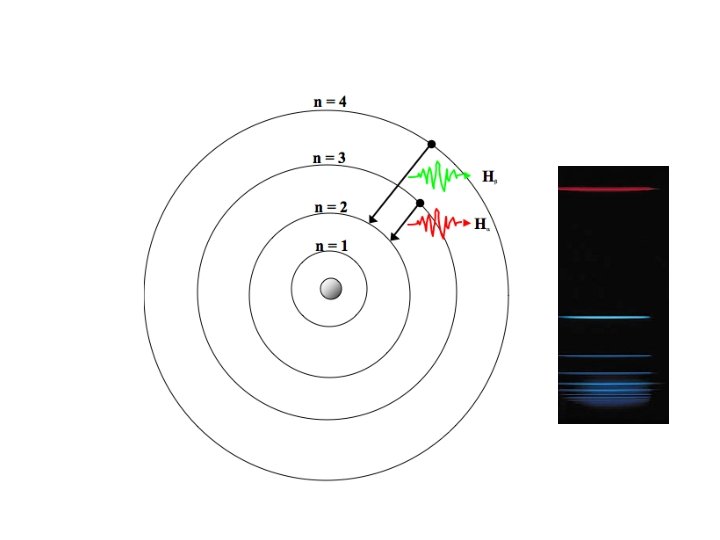
Dispersing light into wavelengths: light from dilute gases “Emission Lines”
Emission line spectra • These emission lines from a hot gas prove to be fingerprints of the specific chemical element • They cannot be explained by the wave model of light, but they can be understood in the particle model • Discovery of these emission lines motivated the particle explanation of light
Light as a Particle • The particle of light is usually called a “photon” (completely unrelated to the proton!) • The photon carries some energy – it can actually do work • The amount of energy of a photon in the particle model is very simply related to the frequency of light in the wave model, photon energy = constant x wave frequency • The constant is tiny, so the amount of energy in a photon is miniscule
A Model for the Atom Niels Bohr
The Bohr Atom • Electrons are permitted to be only in certain orbits, not just anywhere – the orbits are “quantized” • The orbits closest to the nucleus have the least energy • The orbits are not equally spaced in energy • The allowed orbits are specific to each chemical element • The atom “prefers” to minimize its total energy
Collisions of Bohr Atoms • The energy of the collision can kick an electron to an upper state: “excitation” • Very quickly (10 -18 seconds!) the atom notices this, and pushes the electron back down (“deexcitation”): it prefers the lower energy • Excess energy is now available, and a new photon is created to carry this excess away, thereby balancing the energy books
Spectra of Astronomical Objects
Spectra of Astronomical Objects • Spectra of stars, planets, galaxies, gaseous nebula often show these same emission lines, and always at the same familiar wavelengths as seen in a lab test tube • Therefore we can identify which atoms are in these astronomical objects, even though we can’t go there • We see no atoms in cosmic objects that we don’t recognize: “their” periodic table is exactly the same as ours!
The Spectrum of the Orion Nebula Blue Green Red
The Amazing Bottom Line • The orbital spacings in atoms depend on fundamental physical constants (the mass of the proton and neutron, the charge on the electron, etc. ) • The fact that the observed spectral lines in other stars are always at those same wavelengths tell us those physical constants and laws are identical in those objects as on Earth • Since the light from distant objects took a long time to get to us, those laws were also the same a long time ago • PHYSICS WORKS EVERYWHERE, AND DOESN’T CHANGE WITH TIME!!
Many stars show a continuous spectrum, plus absorption lines. Stars must have a cool layer on top of a hot dense center!!
Different stars show absorption lines of different elements Blue Green Red Are the chemical compositions of different stars different? No, most stars have the same mix of elements. It’s a temperature effect. Stellar spectra are thermometers!
There’s lots of information in those little dots! The majority of the observing time at large telescopes is used to take spectra, not to take images.