Tools for High Performance Network Monitoring Les Cottrell


- Slides: 44

Tools for High Performance Network Monitoring Les Cottrell, Presented at the Internet 2 Fall members Meeting, Philadelphia, Sep 2005 www. slac. stanford. edu/grp/scs/net/talk 05/i 2 -toolssep 05. ppt Partially funded by DOE/MICS for Internet End-to-end Performance Monitoring (IEPM) 1

Outline • Data intensive sciences (e. g. HEP) needs to move large volumes of data worldwide – Requires understanding and effective use of fast networks – Requires continuous monitoring • Outline of talk: – – What does monitoring provide? Active E 2 E measurements today and challenges Visualization, forecasting, problem ID Passive monitoring • Netflow, • SNMP, • Conclusions 2

Uses of Measurements • Automated problem identification & trouble shooting: – Alerts for network administrators, e. g. • Bandwidth changes in time-series, iperf, SNMP – Alerts for systems people • OS/Host metrics • Forecasts for Grid Middleware, e. g. replica manager, data placement • Engineering, planning, SLA (set & verify) • Security: spot anomalies, intrusion detection • Accounting 3

Active E 2 E Monitoring 4

Using Active IEPM-BW measurements • Focus on high performance for a few hosts needing to send data to a small number of collaborator sites, e. g. HEP tiered model • Makes regular measurements with tools – – Ping (RTT, connectivity), traceroute pathchirp, ABw. E, pathload (packet pair dispersion) iperf (single & multi-stream), thrulay, Bbftp, bbcp (file transfer applications) • Looking at Grid. FTP but complex requiring renewing certificates • Lots of analysis and visualization • Running at major HEP sites: CERN, SLAC, FNAL, BNL, Caltech to about 40 remote sites – http: //www. slac. stanford. edu/comp/net/iepmbw. slac. stanford. edu/slac_wan_bw_tests. html 5

Ping/traceroute • Ping still useful (plus ca reste …) – Is path connected? – RTT, loss, jitter – Great for low performance links (e. g. Digital Divide), e. g. AMP (NLANR)/Ping. ER (SLAC) – Nothing to install, but blocking • OWAMP/I 2 similar but One Way – But needs server installed at other end and good timers • Traceroute – Needs good visualization (traceanal/SLAC) – Little use for dedicated λ layer 1 or 2 – However still want to know topology of paths 6

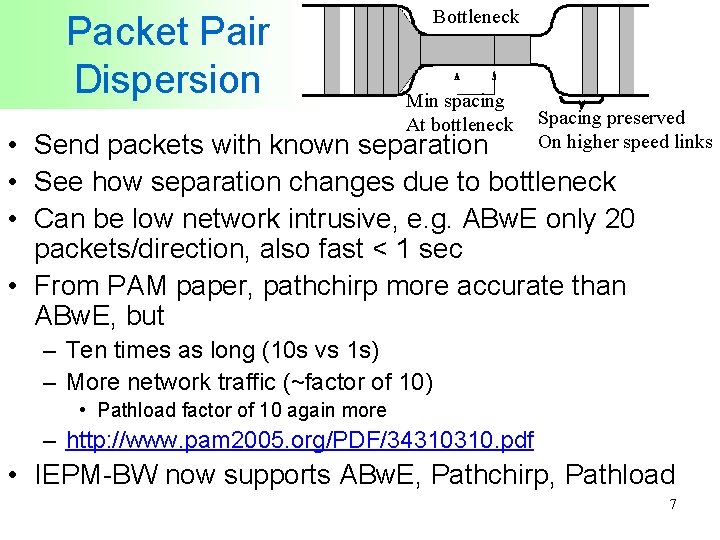
Packet Pair Dispersion Bottleneck Min spacing At bottleneck Spacing preserved On higher speed links • Send packets with known separation • See how separation changes due to bottleneck • Can be low network intrusive, e. g. ABw. E only 20 packets/direction, also fast < 1 sec • From PAM paper, pathchirp more accurate than ABw. E, but – Ten times as long (10 s vs 1 s) – More network traffic (~factor of 10) • Pathload factor of 10 again more – http: //www. pam 2005. org/PDF/34310310. pdf • IEPM-BW now supports ABw. E, Pathchirp, Pathload 7

BUT… • Packet pair dispersion relies on accurate timing of inter packet separation – At > 1 Gbps this is getting beyond resolution of Unix clocks – AND 10 GE NICs are offloading function • Coalescing interrupts, Large Send & Receive Offload, TOE • Need to work with TOE vendors – Turn offload (Neterion supports multiple channels, can eliminate offload to get more accurate timing in host) – Do timing in NICs – No standards for interfaces 8

Achievable Throughput • Use TCP or UDP to send as much data as can memory to memory from source to destination • Tools: iperf (bwctl/I 2), netperf, thrulay (from Stas Shalunov/I 2), udpmon … • Pseudo file copy: Bbcp and Grid. FTP also have memory to memory mode 9

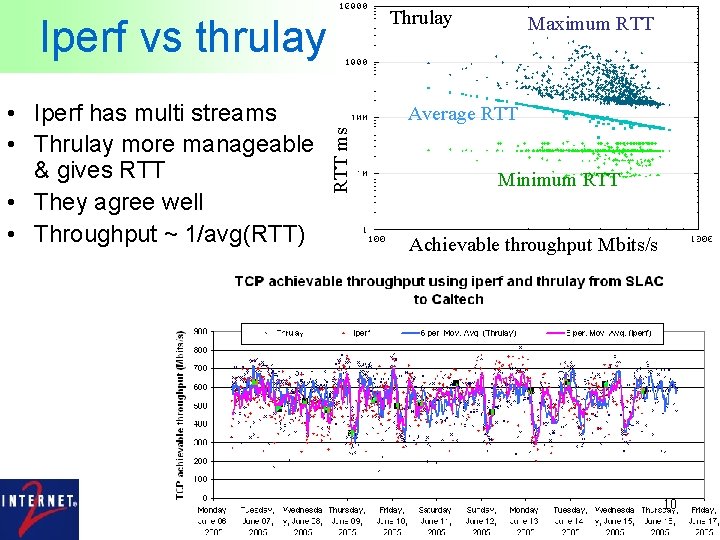
Thrulay Iperf vs thrulay Average RTT ms • Iperf has multi streams • Thrulay more manageable & gives RTT • They agree well • Throughput ~ 1/avg(RTT) Maximum RTT Minimum RTT Achievable throughput Mbits/s 10

BUT… • At 10 Gbits/s on transatlantic path Slow start takes over 6 seconds – To get 90% of measurement in congestion avoidance need to measure for 1 minute (5. 25 GBytes at 7 Gbits/s (today’s typical performance) • Needs scheduling to scale, even then … • It’s not disk-to-disk or application-to application – So use bbcp, bbftp, or Grid. FTP 11

AND … • For testbeds such as Ultra. Light, Ultra. Science. Net etc. have to reserve the path – So the measurement infrastructure needs to add capability to reserve the path (so need API to reservation application) – OSCARS from ESnet developing a web services interface (http: //www. es. net/oscars/): • For lightweight have a “persistent” capability • For more intrusive, must reserve just before make measurement 12

Visualization & Forecasting 13

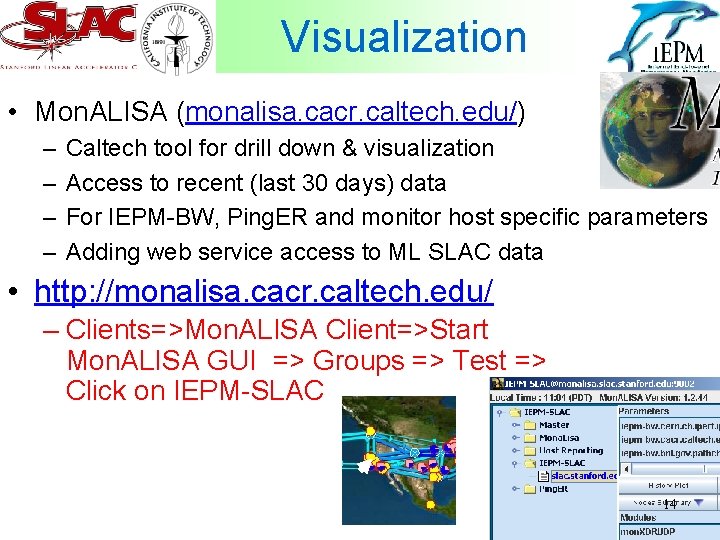
Visualization • Mon. ALISA (monalisa. cacr. caltech. edu/) – – Caltech tool for drill down & visualization Access to recent (last 30 days) data For IEPM-BW, Ping. ER and monitor host specific parameters Adding web service access to ML SLAC data • http: //monalisa. cacr. caltech. edu/ – Clients=>Mon. ALISA Client=>Start Mon. ALISA GUI => Groups => Test => Click on IEPM-SLAC 14

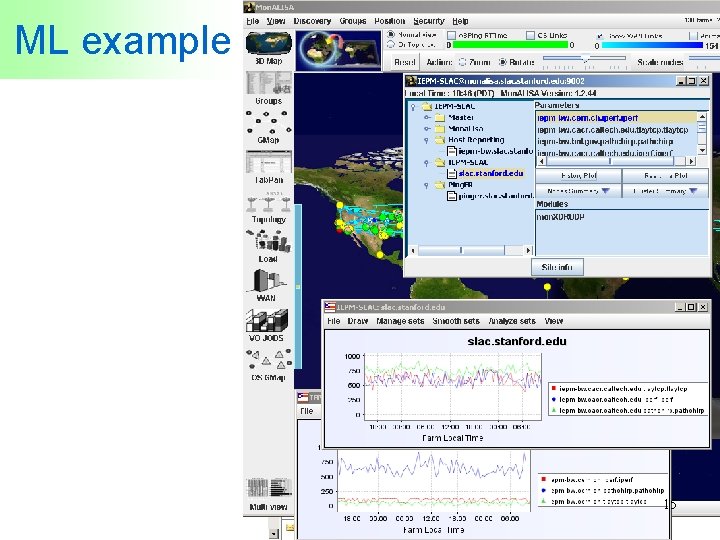
ML example 15

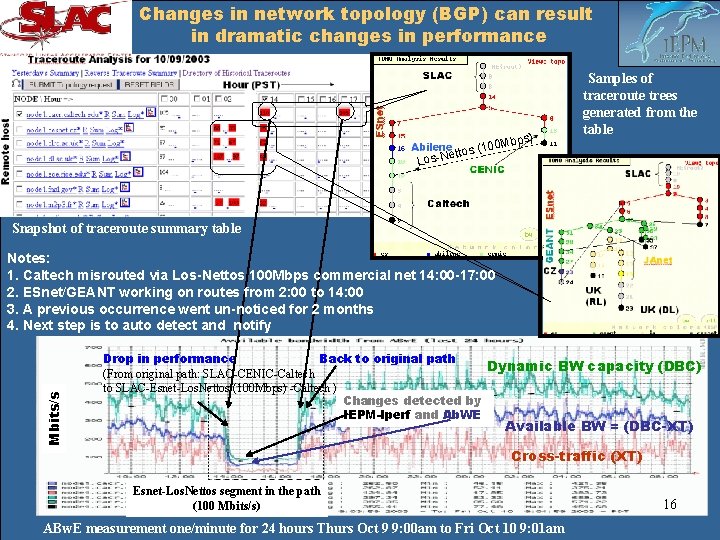
Changes in network topology (BGP) can result in dramatic changes in performance Remote host Hour s) bp (100 M s o t t e Los-N Samples of traceroute trees generated from the table Snapshot of traceroute summary table Mbits/s Notes: 1. Caltech misrouted via Los-Nettos 100 Mbps commercial net 14: 00 -17: 00 2. ESnet/GEANT working on routes from 2: 00 to 14: 00 3. A previous occurrence went un-noticed for 2 months 4. Next step is to auto detect and notify Drop in performance Back to original path Dynamic BW capacity (DBC) (From original path: SLAC-CENIC-Caltech to SLAC-Esnet-Los. Nettos (100 Mbps) -Caltech ) Changes detected by IEPM-Iperf and Ab. WE Available BW = (DBC-XT) Cross-traffic (XT) Esnet-Los. Nettos segment in the path (100 Mbits/s) ABw. E measurement one/minute for 24 hours Thurs Oct 9 9: 00 am to Fri Oct 10 9: 01 am 16

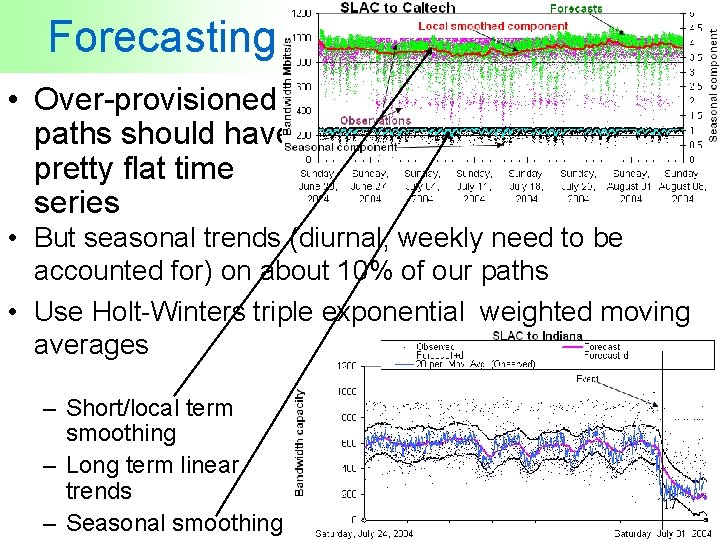
Forecasting • Over-provisioned paths should have pretty flat time series • But seasonal trends (diurnal, weekly need to be accounted for) on about 10% of our paths • Use Holt-Winters triple exponential weighted moving averages – Short/local term smoothing – Long term linear trends – Seasonal smoothing 17

Alerting • Have false positives down to reasonable level, so sending alerts • Experimental • Typically few per week. • Currently by email to network admins – Adding pointers to extra information to assist admin in further diagnosing the problem, including: • Traceroutes, monitoring host parms, time series for RTT, pathchirp, thrulay etc. • Plan to add on-demand measurements (excited about perf. SONAR) 18

Integration • Integrate IEPM-BW and Ping. ER measurements with Mon. ALISA to provide additional access • Working to make traceanal a callable module – Integrating with AMP • When comfortable with forecasting, event detection will generalize 19

Passive - Netflow 20

Netflow et. al. • Switch identifies flow by sce/dst ports, protocol • Cuts record for each flow: – src, dst, ports, protocol, TOS, start, end time • Collect records and analyze • Can be a lot of data to collect each day, needs lot cpu – Hundreds of MBytes to GBytes • • • No intrusive traffic, real: traffic, collaborators, applications No accounts/pwds/certs/keys No reservations etc Characterize traffic: top talkers, applications, flow lengths etc. Internet 2 backbone – http: //netflow. internet 2. edu/weekly/ • SLAC: – www. slac. stanford. edu/comp/net/slac-netflow/html/SLAC-netflow. html 21

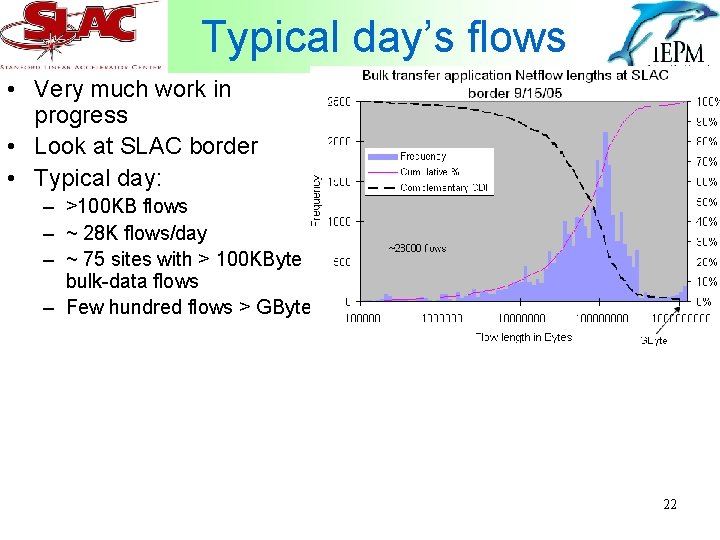
Typical day’s flows • Very much work in progress • Look at SLAC border • Typical day: – >100 KB flows – ~ 28 K flows/day – ~ 75 sites with > 100 KByte bulk-data flows – Few hundred flows > GByte 22

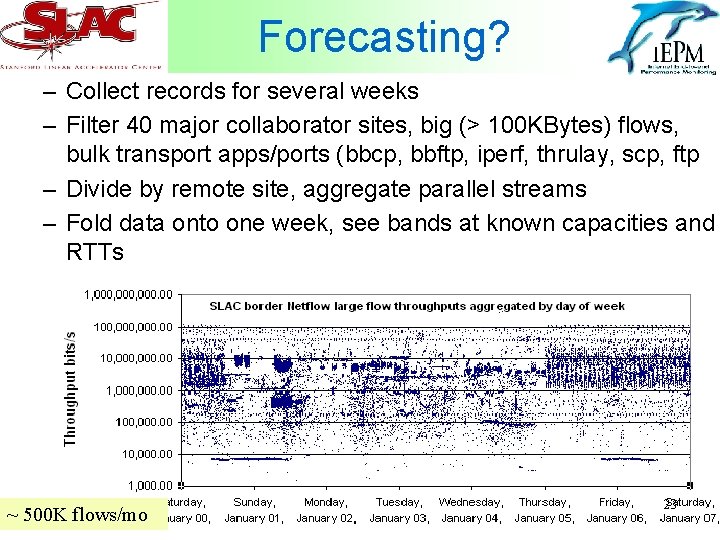
Forecasting? – Collect records for several weeks – Filter 40 major collaborator sites, big (> 100 KBytes) flows, bulk transport apps/ports (bbcp, bbftp, iperf, thrulay, scp, ftp – Divide by remote site, aggregate parallel streams – Fold data onto one week, see bands at known capacities and RTTs ~ 500 K flows/mo 23

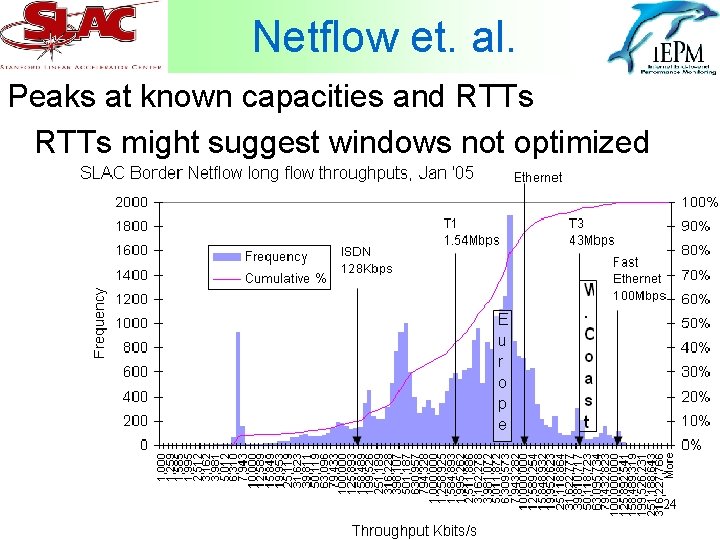
Netflow et. al. Peaks at known capacities and RTTs might suggest windows not optimized 24

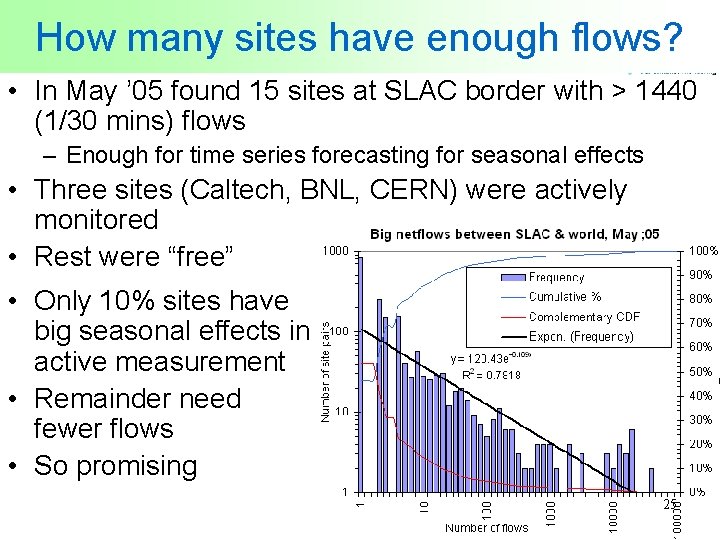
How many sites have enough flows? • In May ’ 05 found 15 sites at SLAC border with > 1440 (1/30 mins) flows – Enough for time series forecasting for seasonal effects • Three sites (Caltech, BNL, CERN) were actively monitored • Rest were “free” • Only 10% sites have big seasonal effects in active measurement • Remainder need fewer flows • So promising 25

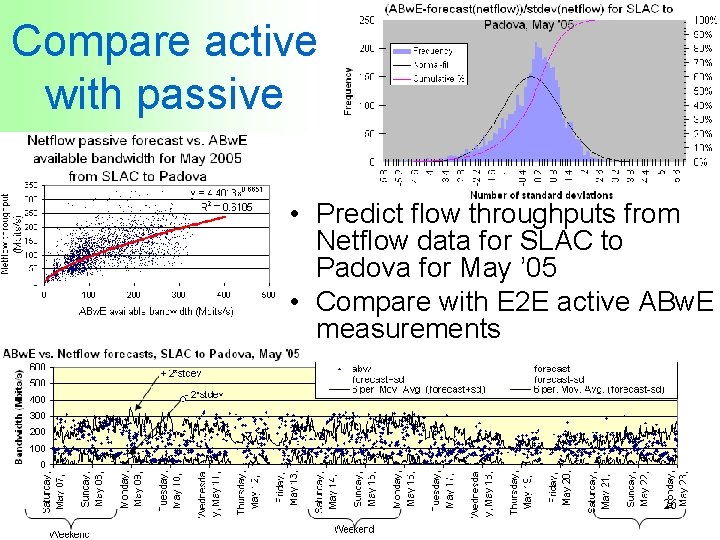
Compare active with passive • Predict flow throughputs from Netflow data for SLAC to Padova for May ’ 05 • Compare with E 2 E active ABw. E measurements 26

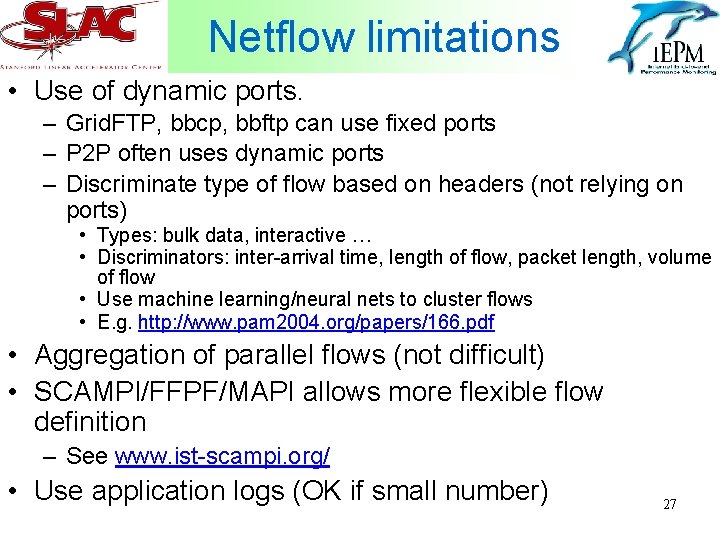
Netflow limitations • Use of dynamic ports. – Grid. FTP, bbcp, bbftp can use fixed ports – P 2 P often uses dynamic ports – Discriminate type of flow based on headers (not relying on ports) • Types: bulk data, interactive … • Discriminators: inter-arrival time, length of flow, packet length, volume of flow • Use machine learning/neural nets to cluster flows • E. g. http: //www. pam 2004. org/papers/166. pdf • Aggregation of parallel flows (not difficult) • SCAMPI/FFPF/MAPI allows more flexible flow definition – See www. ist-scampi. org/ • Use application logs (OK if small number) 27

More challenges • Throughputs often depend on non-network factors: – Host interface speeds (DSL, 10 Mbps Enet, wireless) – Configurations (window sizes, hosts) – Applications (disk/file vs mem-to-mem) • Looking at distributions by site, often multimodal • Predictions may have large standard deviations • How much to report to application 28

Conclusions • Traceroute dead for dedicated paths • Some things continue to work – Ping, owamp – Iperf, thrulay, bbftp … but • Packet pair dispersion needs work, its time may be over • Passive looks promising with Netflow • SNMP needs AS to make accessible • Capture expensive – ~$100 K (Joerg Micheel) for OC 192 Mon 29

More information • Comparisons of Active Infrastructures: – www. slac. stanford. edu/grp/scs/net/proposals/infra-mon. html • Some active public measurement infrastructures: – – www-iepm. slac. stanford. edu/ e 2 epi. internet 2. edu/owamp/ amp. nlanr. net/ www-iepm. slac. stanford. edu/pinger/ • Capture at 10 Gbits/s – www. endace. com (DAG), www. pam 2005. org/PDF/34310233. pdf – www. ist-scampi. org/ (also MAPI, FFPF), www. ist-lobster. org • Monitoring tools – www. slac. stanford. edu/xorg/nmtf-tools. html – www. caida. org/tools/ – Google for iperf, thrulay, bwctl, pathload, pathchirp 30

Extra Slides Follow 31

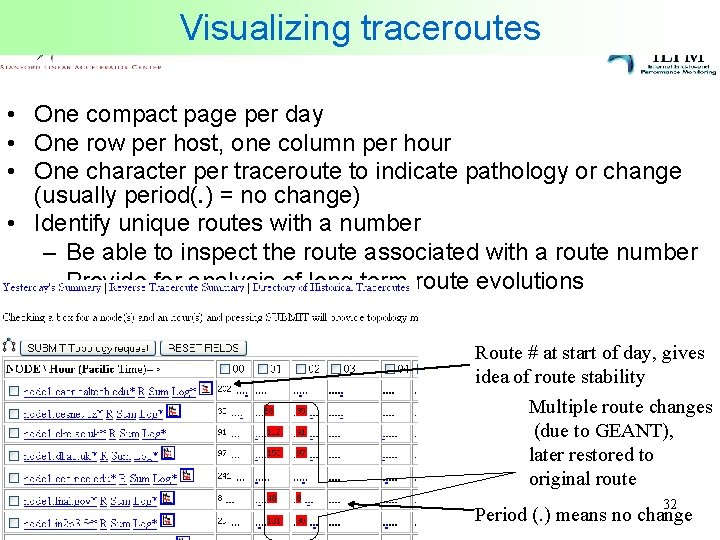
Visualizing traceroutes • One compact page per day • One row per host, one column per hour • One character per traceroute to indicate pathology or change (usually period(. ) = no change) • Identify unique routes with a number – Be able to inspect the route associated with a route number – Provide for analysis of long term route evolutions Route # at start of day, gives idea of route stability Multiple route changes (due to GEANT), later restored to original route 32 Period (. ) means no change

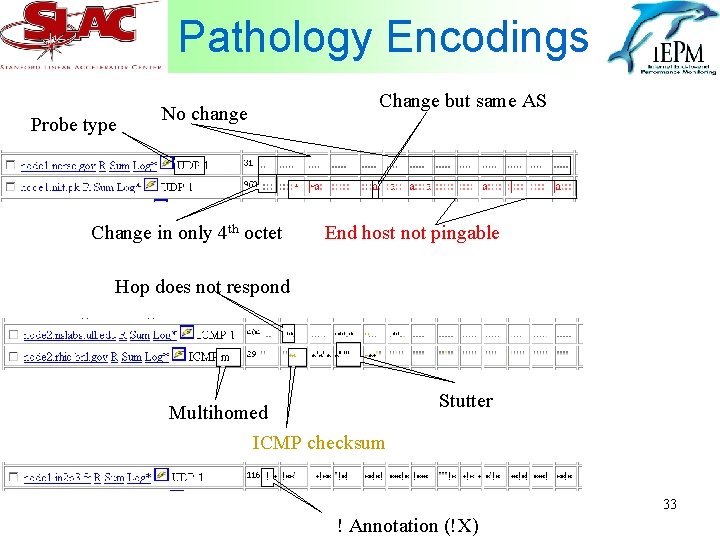
Pathology Encodings Probe type No change Change in only 4 th octet Change but same AS End host not pingable Hop does not respond Multihomed ICMP checksum Stutter 33 ! Annotation (!X)

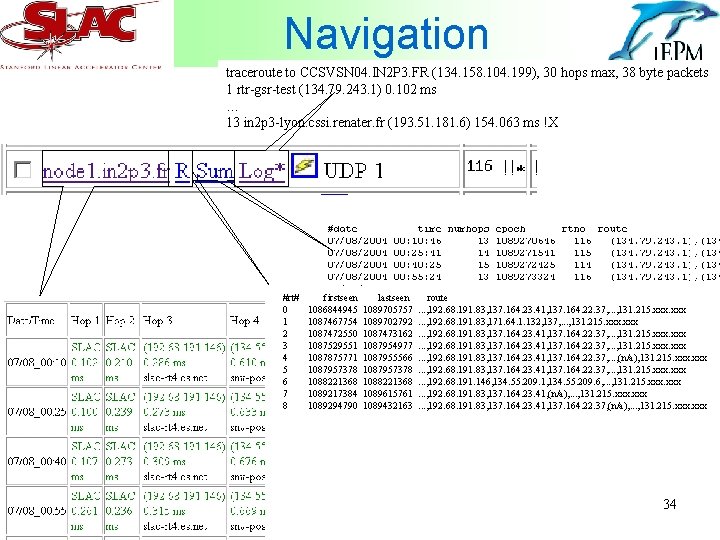
Navigation traceroute to CCSVSN 04. IN 2 P 3. FR (134. 158. 104. 199), 30 hops max, 38 byte packets 1 rtr-gsr-test (134. 79. 243. 1) 0. 102 ms … 13 in 2 p 3 -lyon. cssi. renater. fr (193. 51. 181. 6) 154. 063 ms !X #rt# 0 1 2 3 4 5 6 7 8 firstseen 1086844945 1087467754 1087472550 1087529551 1087875771 1087957378 1088221368 1089217384 1089294790 lastseen 1089705757 1089702792 1087473162 1087954977 1087955566 1087957378 1088221368 1089615761 1089432163 route. . . , 192. 68. 191. 83, 137. 164. 23. 41, 137. 164. 22. 37, . . . , 131. 215. xxx. . . , 192. 68. 191. 83, 171. 64. 1. 132, 137, . . . , 131. 215. xxx. . . , 192. 68. 191. 83, 137. 164. 23. 41, 137. 164. 22. 37, . . . , (n/a), 131. 215. xxx. . . , 192. 68. 191. 83, 137. 164. 23. 41, 137. 164. 22. 37, . . . , 131. 215. xxx. . . , 192. 68. 191. 146, 134. 55. 209. 1, 134. 55. 209. 6, . . . , 131. 215. xxx. . . , 192. 68. 191. 83, 137. 164. 23. 41, (n/a), . . . , 131. 215. xxx. . . , 192. 68. 191. 83, 137. 164. 23. 41, 137. 164. 22. 37, (n/a), . . . , 131. 215. xxx 34

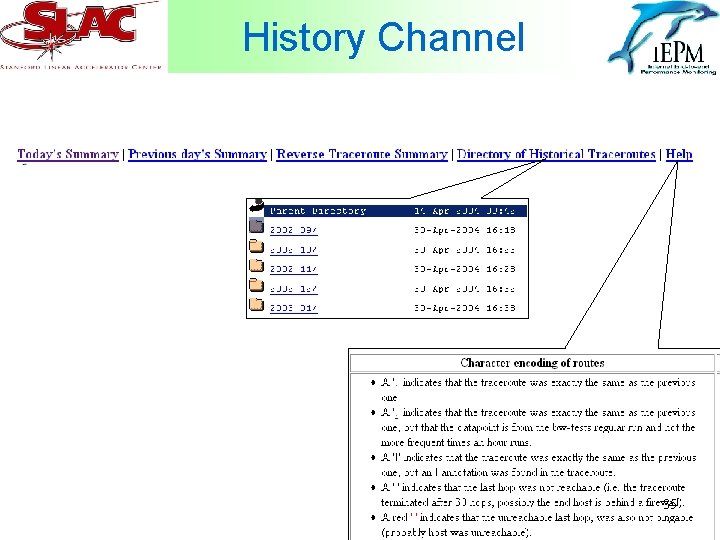
History Channel 35

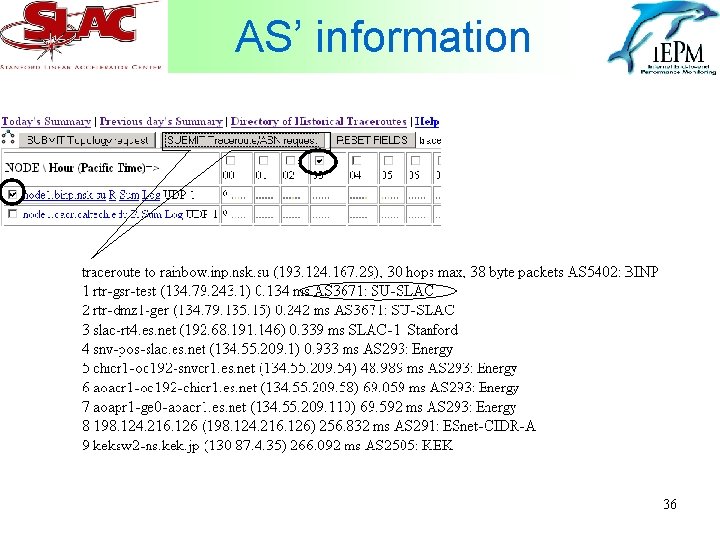
AS’ information 36

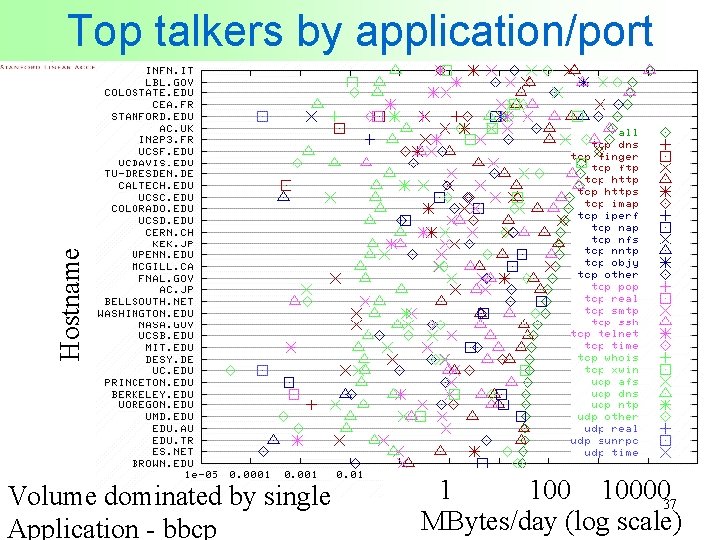
Hostname Top talkers by application/port Volume dominated by single Application - bbcp 1 1000037 MBytes/day (log scale)

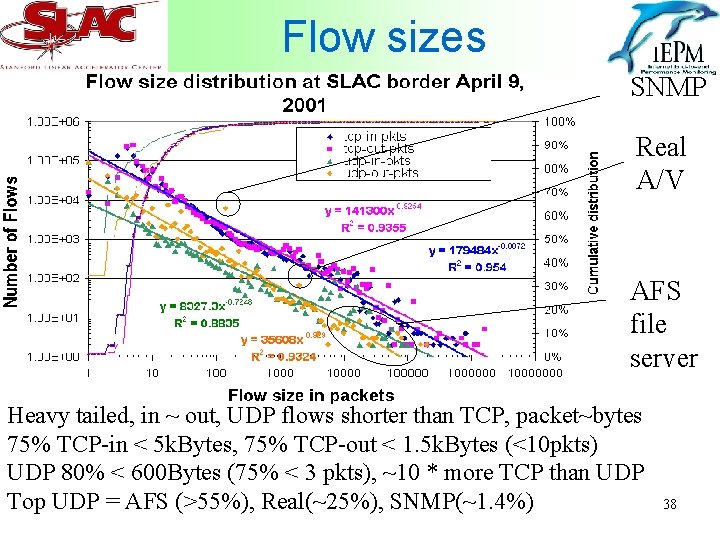
Flow sizes SNMP Real A/V AFS file server Heavy tailed, in ~ out, UDP flows shorter than TCP, packet~bytes 75% TCP-in < 5 k. Bytes, 75% TCP-out < 1. 5 k. Bytes (<10 pkts) UDP 80% < 600 Bytes (75% < 3 pkts), ~10 * more TCP than UDP Top UDP = AFS (>55%), Real(~25%), SNMP(~1. 4%) 38

Passive SNMP MIBs 39

Apply forecasts to Network device utilizations to find bottlenecks • Get measurements from Internet 2/ESnet/Geant perf. SONAR project – ISP reads MIBs saves in RRD database – Make RRD info available via web services • Save as time series, forecast for each interface • For given path and duration forecast most probable bottlenecks • Use MPLS to apply Qo. S at bottlenecks (rather than for the entire path) for selected applications • NSF proposal 40

Passive – Packet capture 41

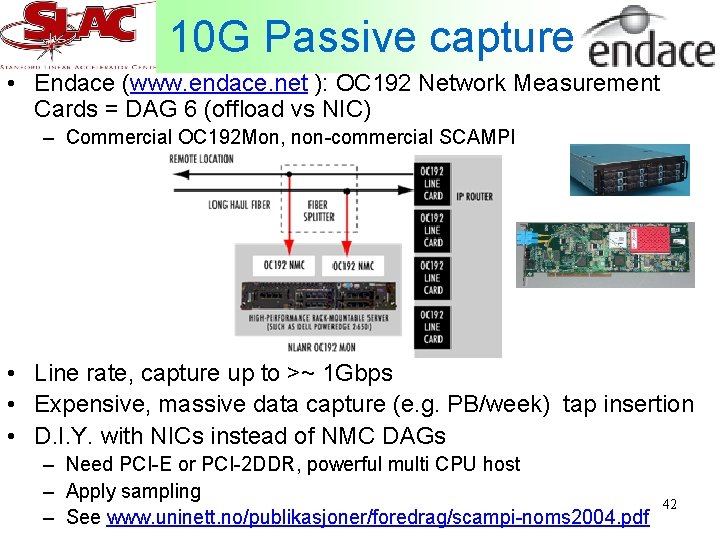
10 G Passive capture • Endace (www. endace. net ): OC 192 Network Measurement Cards = DAG 6 (offload vs NIC) – Commercial OC 192 Mon, non-commercial SCAMPI • Line rate, capture up to >~ 1 Gbps • Expensive, massive data capture (e. g. PB/week) tap insertion • D. I. Y. with NICs instead of NMC DAGs – Need PCI-E or PCI-2 DDR, powerful multi CPU host – Apply sampling – See www. uninett. no/publikasjoner/foredrag/scampi-noms 2004. pdf 42

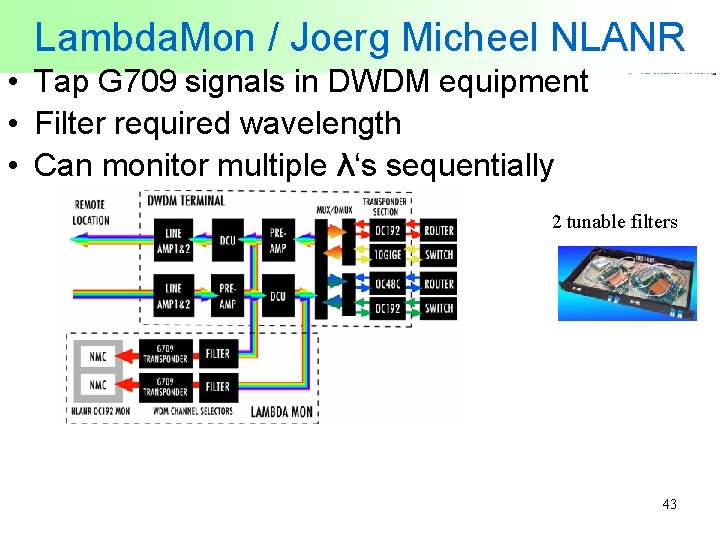
Lambda. Mon / Joerg Micheel NLANR • Tap G 709 signals in DWDM equipment • Filter required wavelength • Can monitor multiple λ‘s sequentially 2 tunable filters 43

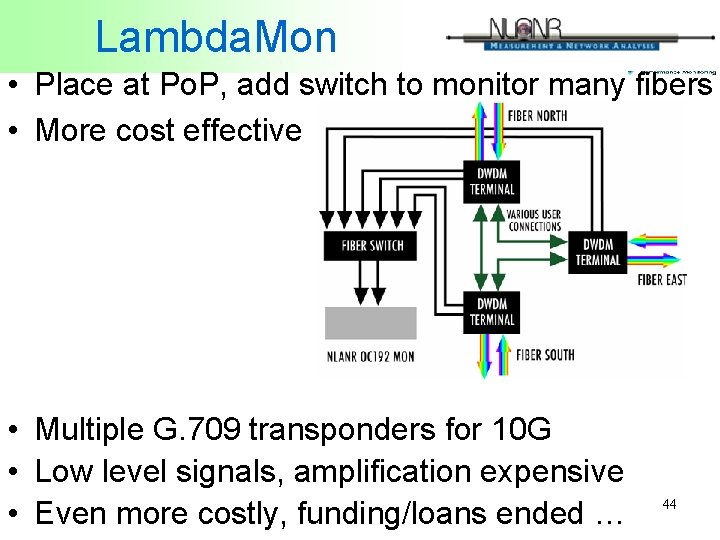
Lambda. Mon • Place at Po. P, add switch to monitor many fibers • More cost effective • Multiple G. 709 transponders for 10 G • Low level signals, amplification expensive • Even more costly, funding/loans ended … 44