
Tomasz Michaek Tomasz A Kowalewski NUMERICAL BENCHMARK BASED
Tomasz Michałek, Tomasz A. Kowalewski NUMERICAL BENCHMARK BASED ON NATURAL CONVECTION OF FREEZING WATER Institute of Fundamental Technological Research Polish Academy of Sciences, Dept. of Mechanics and Physics of Fluids, Poland.
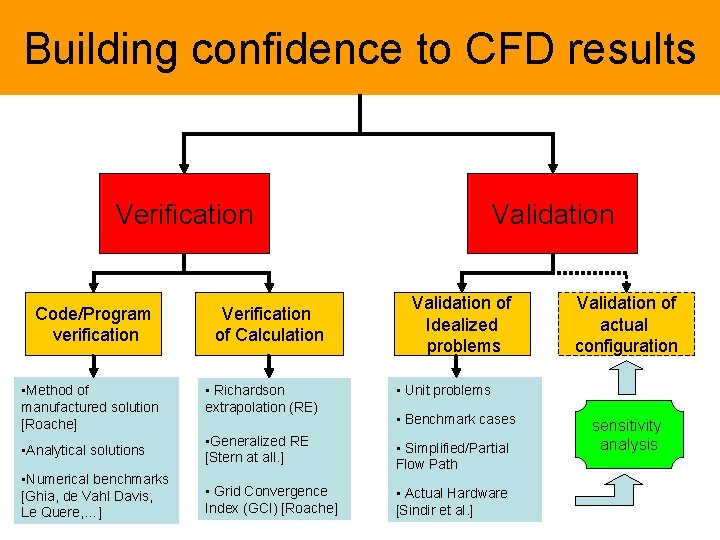
Building confidence to CFD results Verification Code/Program verification • Method of manufactured solution [Roache] Verification of Calculation • Richardson extrapolation (RE) Validation of Idealized problems Validation of actual configuration • Unit problems • Benchmark cases • Analytical solutions • Generalized RE [Stern at all. ] • Numerical benchmarks [Ghia, de Vahl Davis, Le Quere, …] • Simplified/Partial Flow Path • Grid Convergence Index (GCI) [Roache] • Actual Hardware [Sindir et al. ] sensitivity analysis
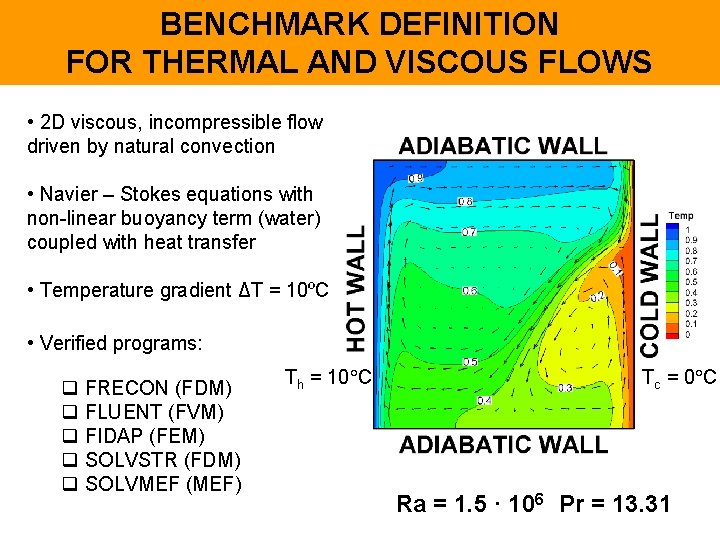
BENCHMARK DEFINITION FOR THERMAL AND VISCOUS FLOWS • 2 D viscous, incompressible flow driven by natural convection • Navier – Stokes equations with non-linear buoyancy term (water) coupled with heat transfer • Temperature gradient ΔT = 10ºC • Verified programs: q FRECON (FDM) q FLUENT (FVM) q FIDAP (FEM) q SOLVSTR (FDM) q SOLVMEF (MEF) Th = 10 C Tc = 0 C Ra = 1. 5 · 106 Pr = 13. 31
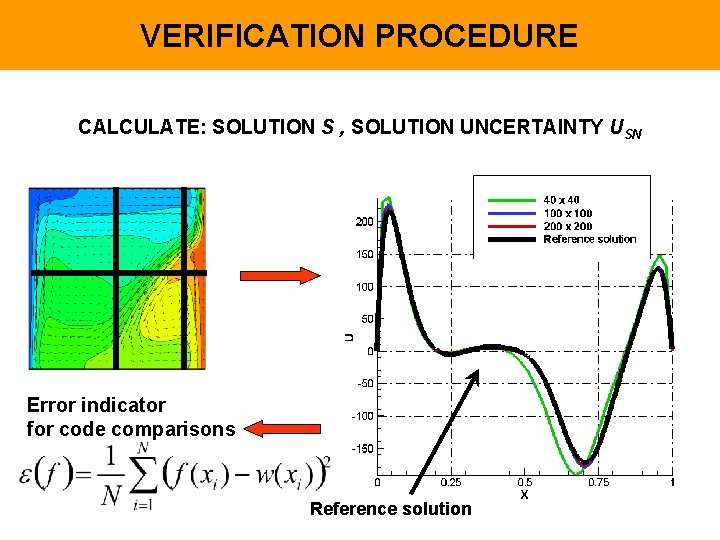
VERIFICATION PROCEDURE CALCULATE: SOLUTION S , SOLUTION UNCERTAINTY USN Error indicator for code comparisons Reference solution
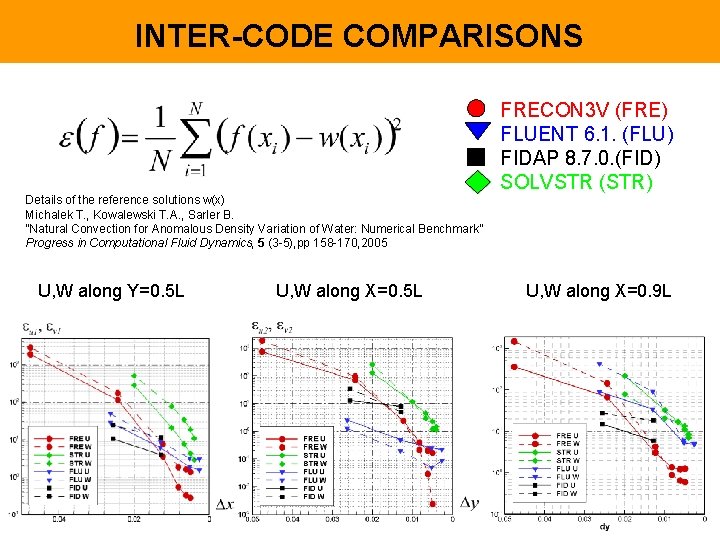
INTER-CODE COMPARISONS Details of the reference solutions w(x) Michalek T. , Kowalewski T. A. , Sarler B. ”Natural Convection for Anomalous Density Variation of Water: Numerical Benchmark” Progress in Computational Fluid Dynamics, 5 (3 -5), pp 158 -170, 2005 U, W along Y=0. 5 L U, W along X=0. 5 L FRECON 3 V (FRE) FLUENT 6. 1. (FLU) FIDAP 8. 7. 0. (FID) SOLVSTR (STR) U, W along X=0. 9 L
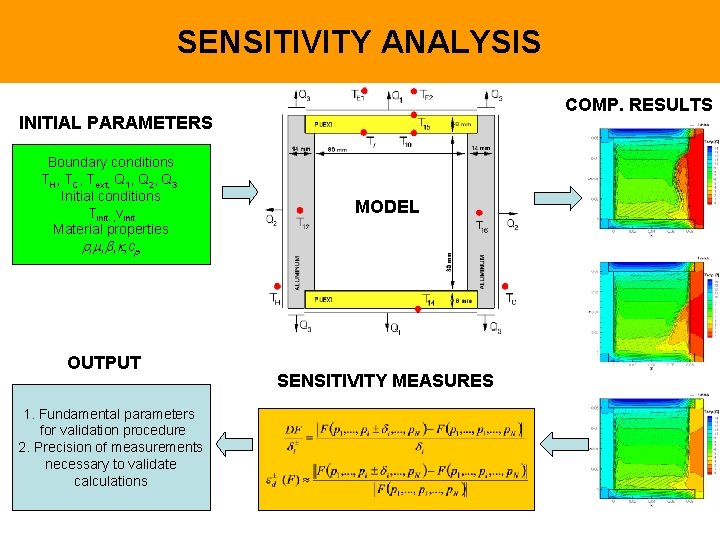
SENSITIVITY ANALYSIS COMP. RESULTS INITIAL PARAMETERS Boundary conditions TH, TC, Text, Q 1, Q 2, Q 3 Initial conditions Tinit. , vinit Material properties , , cp OUTPUT 1. Fundamental parameters for validation procedure 2. Precision of measurements necessary to validate calculations MODEL SENSITIVITY MEASURES
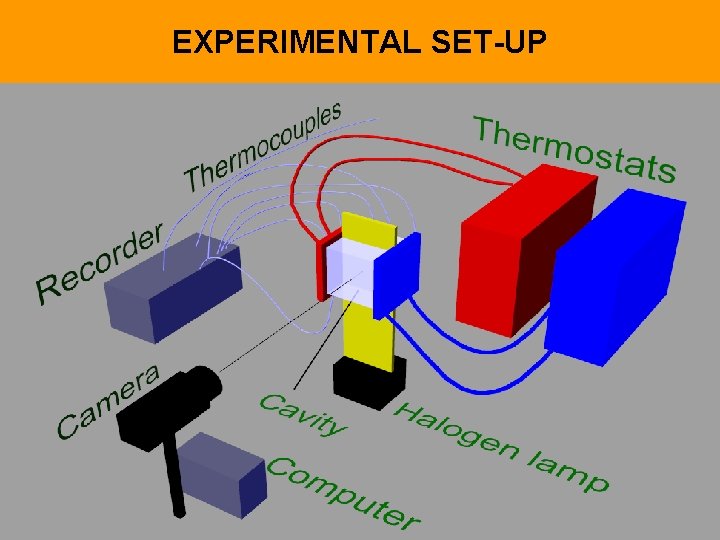
EXPERIMENTAL SET-UP
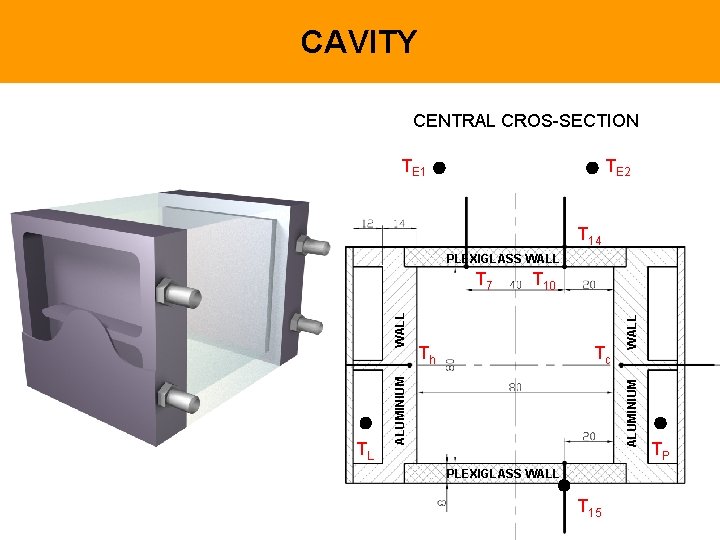
CAVITY CENTRAL CROS-SECTION TE 1 TE 2 T 14 PLEXIGLASS WALL Tc WALL Th ALUMINIUM TL T 10 ALUMINIUM WALL T 7 PLEXIGLASS WALL T 15 TP
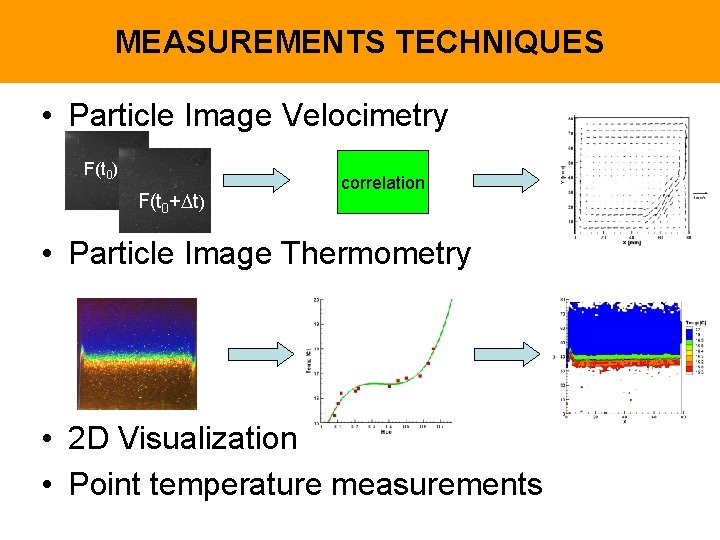
MEASUREMENTS TECHNIQUES • Particle Image Velocimetry F(t 0) F(t 0+ t) correlation • Particle Image Thermometry • 2 D Visualization • Point temperature measurements
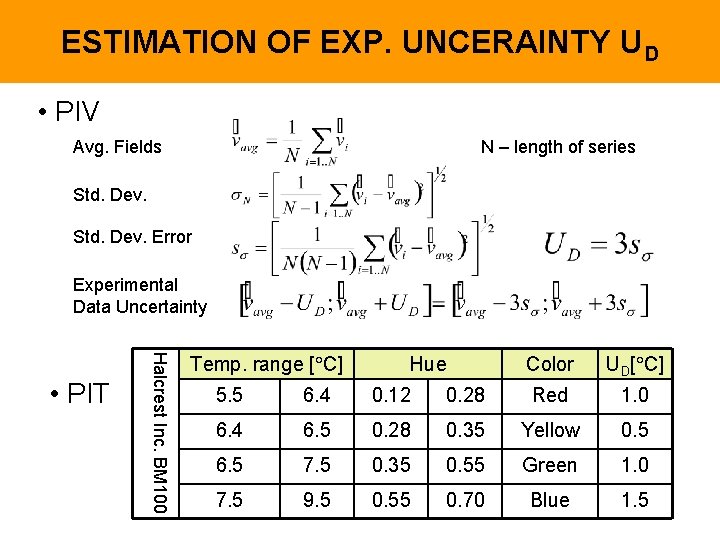
ESTIMATION OF EXP. UNCERAINTY UD • PIV Avg. Fields N – length of series Std. Dev. Error Experimental Data Uncertainty Halcrest Inc. BM 100 • PIT Temp. range [ C] Hue Color UD[ C] 5. 5 6. 4 0. 12 0. 28 Red 1. 0 6. 4 6. 5 0. 28 0. 35 Yellow 0. 5 6. 5 7. 5 0. 35 0. 55 Green 1. 0 7. 5 9. 5 0. 55 0. 70 Blue 1. 5
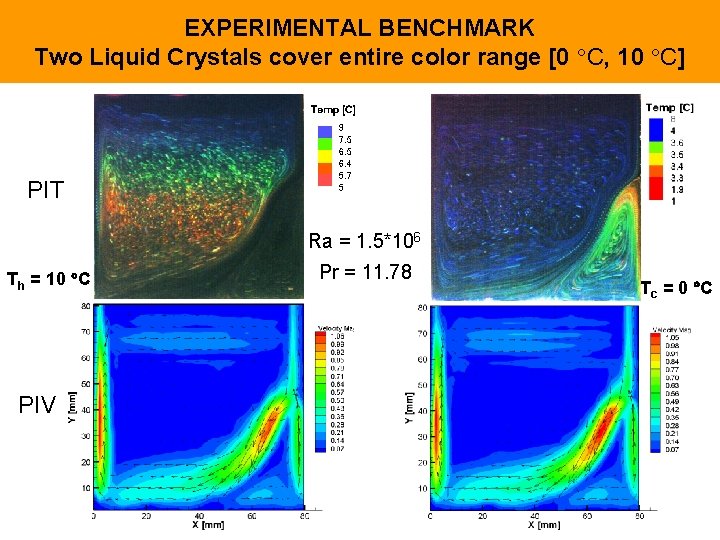
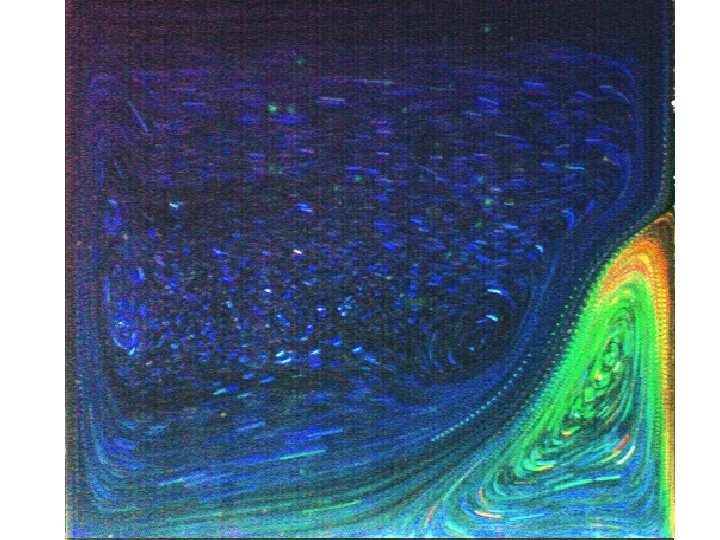
EXPERIMENTAL BENCHMARK Two Liquid Crystals cover entire color range [0 C, 10 C] PIT Ra = 1. 5*106 Th = 10 C PIV Pr = 11. 78 Tc = 0 C

EXPERIMENTAL BENCHMARK 2 D Temp. Field Temp. along Y = 0. 5 L W along Y = 0. 5 L U along X = 0. 5 L Temp. along X = 0. 9 L W along X = 0. 9 L
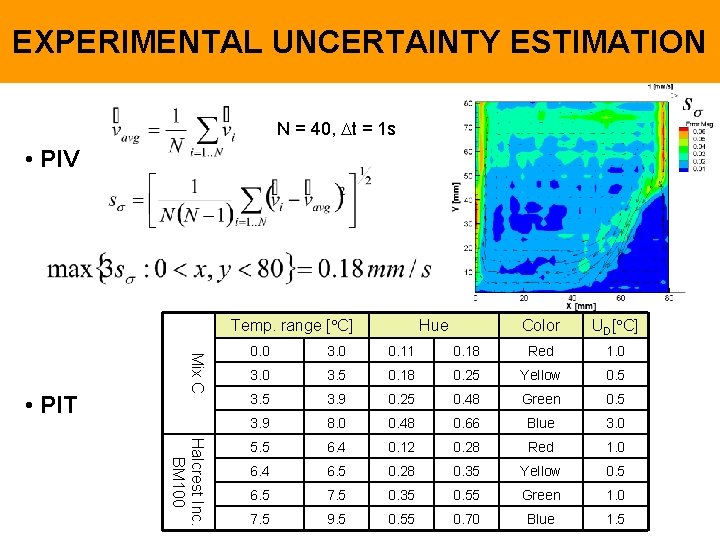
EXPERIMENTAL UNCERTAINTY ESTIMATION N = 40, t = 1 s • PIV Temp. range [ C] Mix C • PIT Hue Color UD[ C] Halcrest Inc. BM 100 0. 0 3. 0 0. 11 0. 18 Red 1. 0 3. 5 0. 18 0. 25 Yellow 0. 5 3. 9 0. 25 0. 48 Green 0. 5 3. 9 8. 0 0. 48 0. 66 Blue 3. 0 5. 5 6. 4 0. 12 0. 28 Red 1. 0 6. 4 6. 5 0. 28 0. 35 Yellow 0. 5 6. 5 7. 5 0. 35 0. 55 Green 1. 0 7. 5 9. 5 0. 55 0. 70 Blue 1. 5
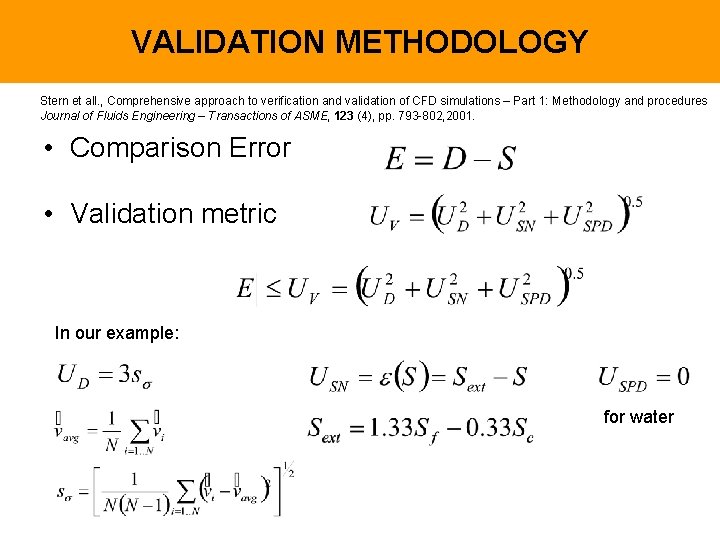
VALIDATION METHODOLOGY Stern et all. , Comprehensive approach to verification and validation of CFD simulations – Part 1: Methodology and procedures Journal of Fluids Engineering – Transactions of ASME, 123 (4), pp. 793 -802, 2001. • Comparison Error • Validation metric In our example: for water
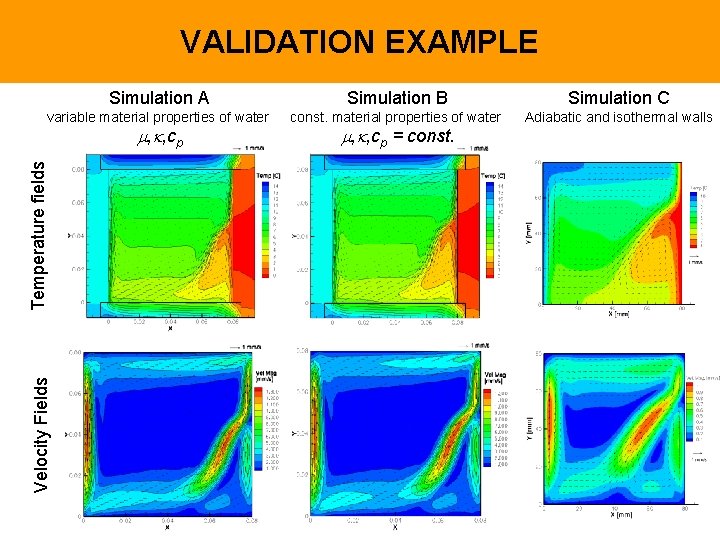
VALIDATION EXAMPLE Simulation A Simulation B Simulation C variable material properties of water const. material properties of water Adiabatic and isothermal walls Velocity Fields Temperature fields , , cp = const.
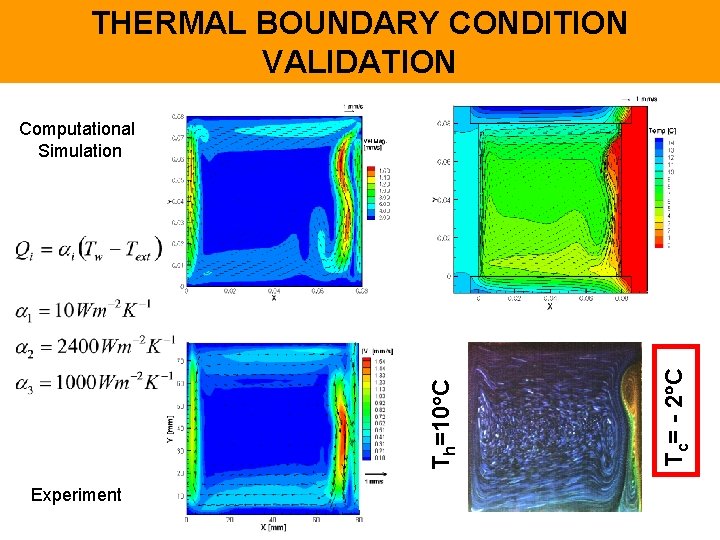
THERMAL BOUNDARY CONDITION VALIDATION Experiment Tc= - 2 C Th=10 C Computational Simulation
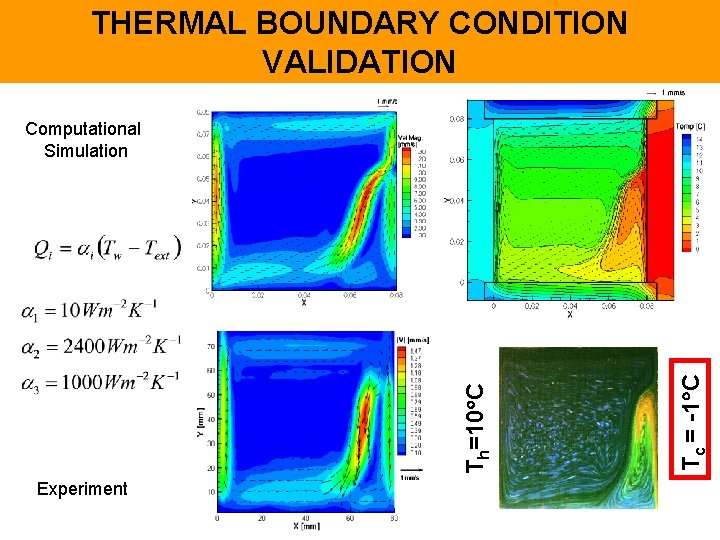
THERMAL BOUNDARY CONDITION VALIDATION Experiment Tc = -1 C Th=10 C Computational Simulation
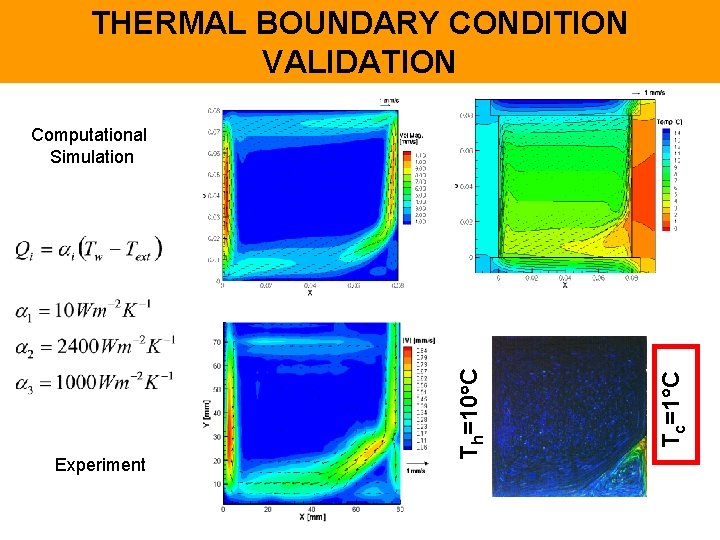
THERMAL BOUNDARY CONDITION VALIDATION Experiment Tc=1 C Th=10 C Computational Simulation
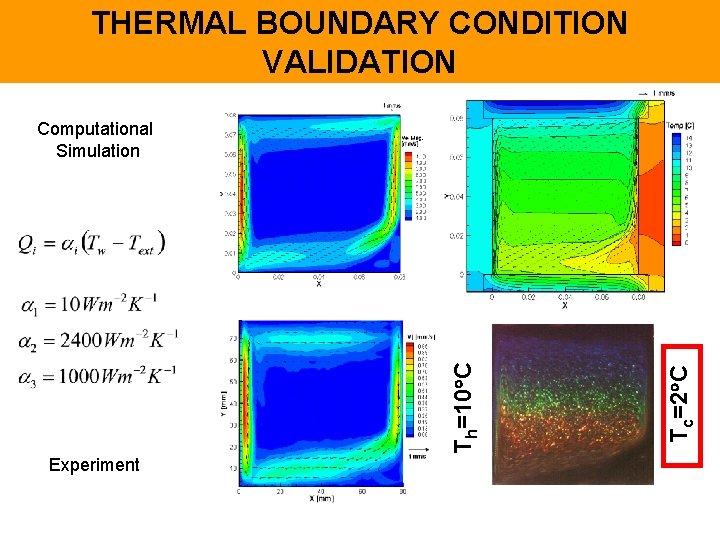
THERMAL BOUNDARY CONDITION VALIDATION Experiment Tc=2 C Th=10 C Computational Simulation
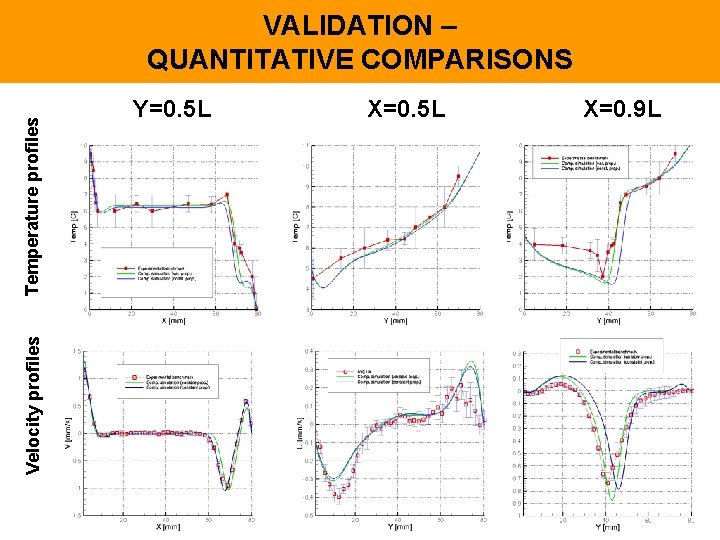
Velocity profiles Temperature profiles VALIDATION – QUANTITATIVE COMPARISONS Y=0. 5 L X=0. 9 L
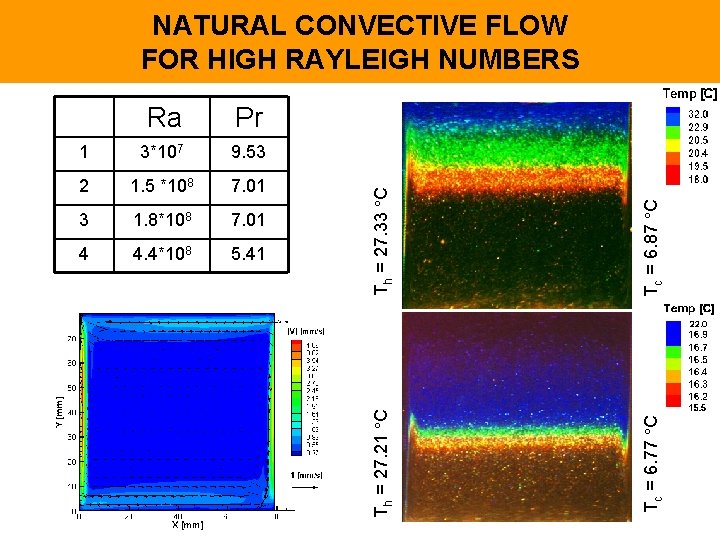
3*107 9. 53 2 1. 5 *108 7. 01 3 1. 8*108 7. 01 4 4. 4*108 5. 41 Tc = 6. 87 C 1 Tc = 6. 77 C Pr Th = 27. 33 C Ra Th = 27. 21 C NATURAL CONVECTIVE FLOW FOR HIGH RAYLEIGH NUMBERS
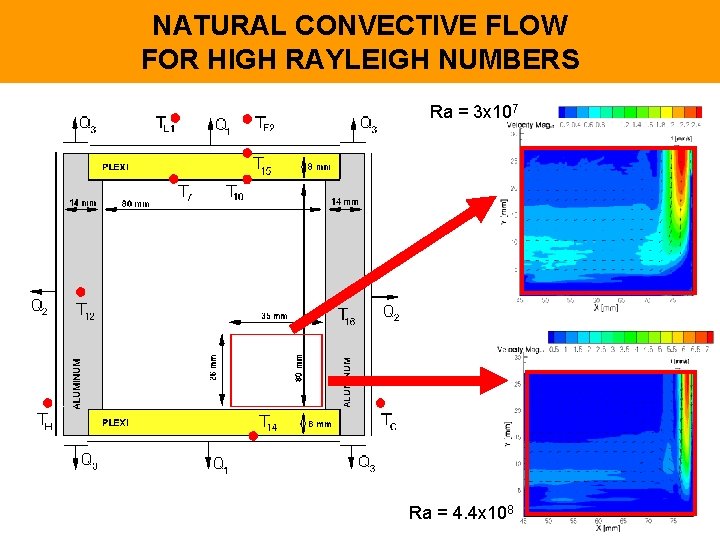
NATURAL CONVECTIVE FLOW FOR HIGH RAYLEIGH NUMBERS Ra = 3 x 10⁷ Ra = 4. 4 x 10⁸
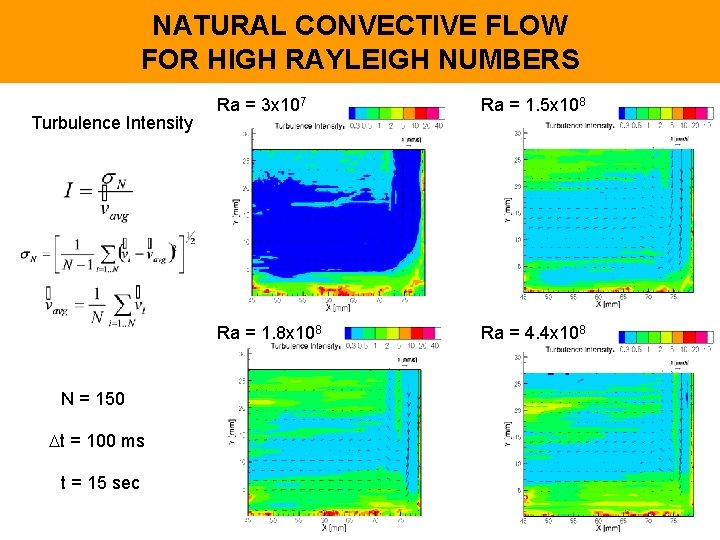
NATURAL CONVECTIVE FLOW FOR HIGH RAYLEIGH NUMBERS Turbulence Intensity N = 150 t = 100 ms t = 15 sec Ra = 3 x 10⁷ Ra = 1. 5 x 10⁸ Ra = 1. 8 x 10⁸ Ra = 4. 4 x 10⁸
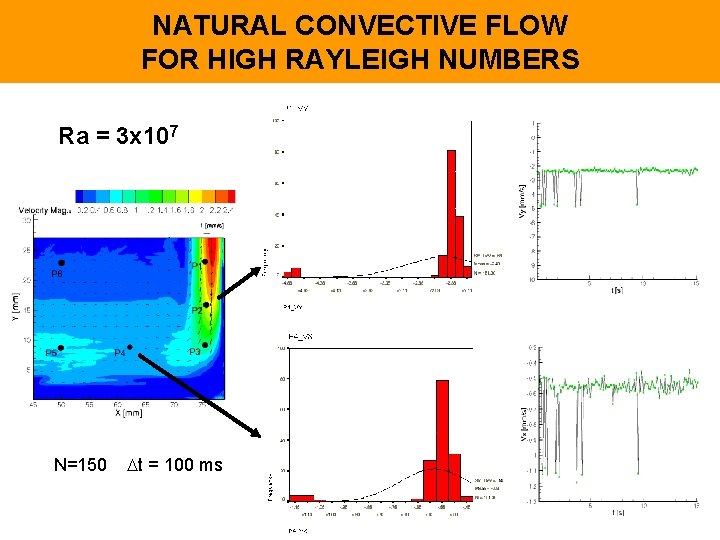
NATURAL CONVECTIVE FLOW FOR HIGH RAYLEIGH NUMBERS Ra = 3 x 10⁷ N=150 t = 100 ms
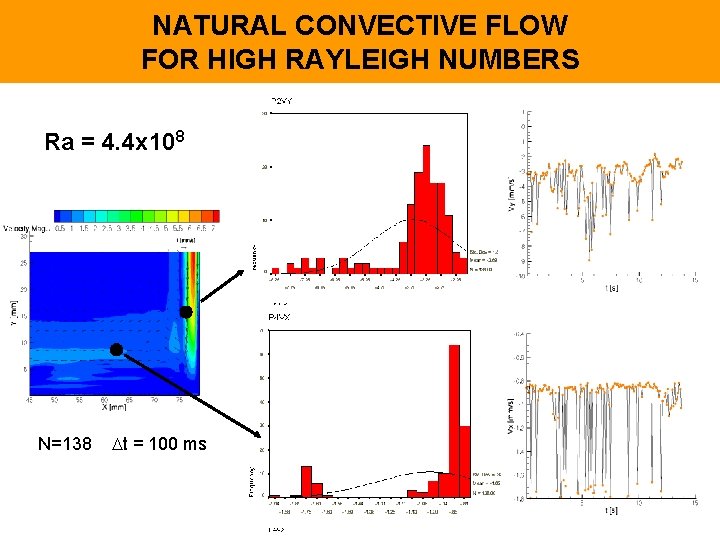
NATURAL CONVECTIVE FLOW FOR HIGH RAYLEIGH NUMBERS Ra = 4. 4 x 10⁸ N=138 t = 100 ms
CONCLUSIONS Numerical benchmark based on natural convection of freezing water was defined A method based on sensitivity analysis for the sake of initial parameters was devised for identification of fundamental (crucial) parameters and determination of necessary measurement’s precision needed in validation procedure. Experimental benchmark was defined for proposed configuration 2 D Temperature field, 2 D Velocity field, was obtained for defined configuration Uncertainty of experimental data were assessed Validation procedure for computational calculations was performed in order to quantitatively assess assumed modeling errors.
- Slides: 27