Todays Drake Student Using What We Know Drake


 Masters Business Admin (MBA) Data Analytics")


 • • • 2014 2015 2016 2017 2018 2019")


- Slides: 30
Today’s Drake Student – Using What We Know Drake Symposium 2019
Discussion Framework
DEGREE TRENDS
National Trends
Iowa Workforce Outlook in 2017
Drake Completion Trends Undergraduate Degrees Conferred 48 56 EDUCATION. HEALTH PROFESSIONS AND RELATED PROGRAMS. 50 38 7 ENGLISH LANGUAGE AND LITERATURE/LETTERS. 30 BIOLOGICAL AND BIOMEDICAL SCIENCES. 85 57 48 62 56 21 65 66 58 VISUAL AND PERFORMING ARTS. 83 70 74 SOCIAL SCIENCES. 106 108 109 COMMUNICATION, JOURNALISM, AND RELATED PROGRAMS. BUSINESS, MANAGEMENT, MARKETING, AND RELATED SUPPORT SERVICES. 333 265 0 2017 -18 50 2012 -13 100 150 2007 -08 200 250 300 357 400
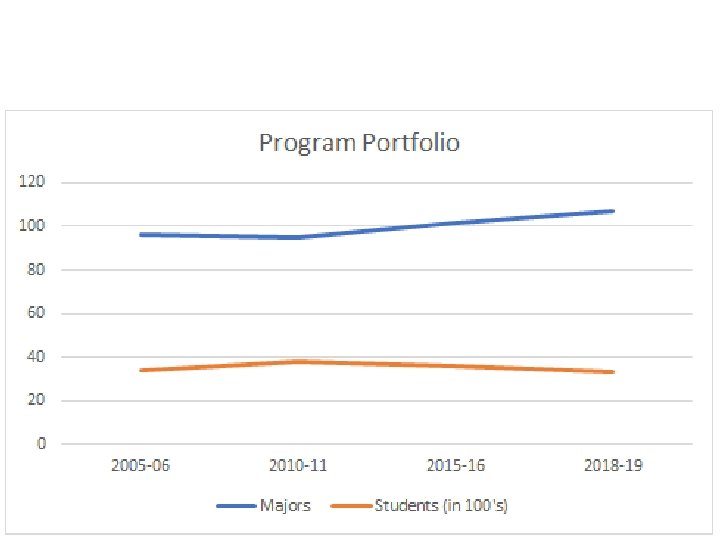
Drake Top Majors Chart Title Computer Science (CS) Masters Business Admin (MBA) Data Analytics (DATA) Finance (FIN) Law, Politics & Society (LPS) Marketing (MKTG) Psychology (PSY) Actuarial Science (ACTS) Law (LAW) Pharmacy (PHAR) 0 50 100 Fall 2018 150 Fall 2016 200 250 Fall 2014 300 350 400 450
New Majors National Data Drake Chart Title 160 140 120 100 80 60 40 20 0 Data Analytics (DATA) Occupational Therapy Doctorate (OTD) Fall 2014 Fall 2015 Fall 2017 Fall 2018 Fall 2016
CURRICULAR COMPLEXITY
Percent of Double Majors 45% 40% 35% 30% 25% 20% 15% 10% 5% 0% Fall 2006 Fall 2014 Fall 2016 Fall 2018
DECLINING DEMOGRAPHICS
National Data
State Data
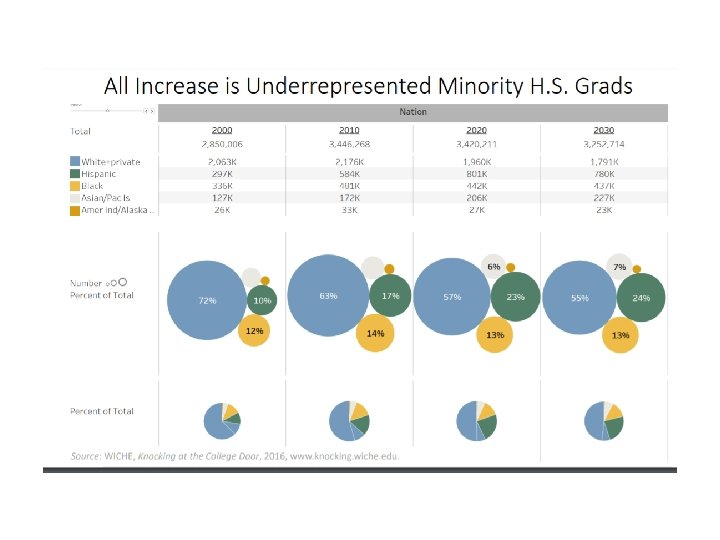
National Data
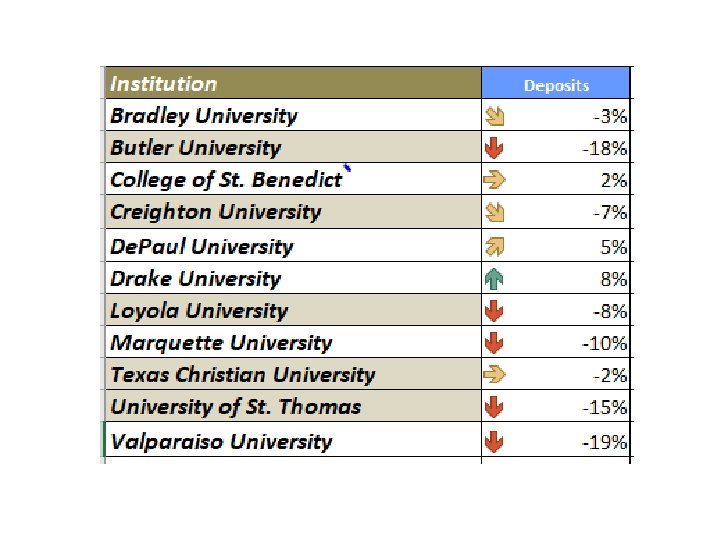
Forecasted Growth Regional Four-Year Institutions 2012 -2029
CHANGING DEMOGRAPHICS
State Data
Drake Undergraduate Profile 2016 2018
2019 Entering FY Student Profile
CHANGE THE CONVERSATION
Discussion Framework
STRATEGIC ENROLLMENT GROWTH
Graduation Rate Comparisons 83% 78% 73% 68% 2007 2008 Full-time Transfer First-Time Full-Time Undergraduate 2009
1 st Generation Trends (FLA) • • • 2014 2015 2016 2017 2018 2019 – – – 14% 10% 13% 13%
NSSE 2019 Students with Disability • First-year: 18% diagnosed with any disability or impairment – – – 64% mental health disorder 27% learning disability 9% disability not listed 7% mobility impairment 5% sensory impairment • Senior: 16% diagnosed with any disability or impairment – 72% mental health – 36% learning disability – 11% disability not listed
0 2016 2017 2018 Race and/or ethnicity unknown Two or more races, non. Hispanic Native Hawaiian or other Pacific Islander, non. Hispanic Asian, non-Hispanic American Indian or Alaska Native, non. Hispanic White, non-Hispanic Black or African American, non-Hispanic/Latino Nonresident aliens Drake Undergraduate Demographics Chart Title 3, 000 2, 500 2, 000 1, 500 1, 000 500
0 2016 2017 2018 Race and/or ethnicity unknown Two or more races, non. Hispanic Native Hawaiian or other Pacific Islander, non. Hispanic Asian, non-Hispanic American Indian or Alaska Native, non. Hispanic White, non-Hispanic Black or African American, non-Hispanic/Latino Nonresident aliens Drake EFR Demographics Chart Title 700 600 500 400 300 200 100