TL dating has been used to date pottery

TL dating has been used to date pottery shards associated with human occupation sites (centuries to millenia time scales). The TL age is set at the time of firing of the pottery.
 = TL acquired")
TL Ages are calculated using the following equation: TL age (years) = TL acquired = natural TL - residual TL TL acquistion/year (TL/unit rad dose X rad dose/year Natural TL measure by heating sample and photoelectronically counting the photons emitted during TL. Residual TL (at zero age) is determined from modern surface samples or in the laboratory. TL/unit radiation dose is the induced TL obtained by exposing the sample to a known radiation dose in the laboratory. Radiation dose/year may be determined by direct measurement using dosimeters or chemical properties of the radioactive isotopes. TL glow curves of loess samples measured in the laboratory.

Inherent Problems with TL Dating 1. TL growth is non-linear. 2. Zeroing may be incomplete, especially for water-lain sediment. 3. Water in sediment may absorb part of the radiation dose. 4. Radiation dose could change due to post-depostional processes, such as compaction or leaching.

Cosmogenic Isotope Dating Glacial landforms, such as the Sierra Nevada moraines shown above, are difficult to date because of the absence of datable material and the fact that many numerical dating techniques are not applicable to age ranges between 50, 000 and 300, 000 years old. With improvements in AMS technology cosmogenic isotope dating has provided new opportunities for dating landforms that in the past could only have relative age assignments

Cosmogenic Isotope Dating Cosmogenic isotopes are produced in near surface rock by collisions of high energy neutrons with specific target elements in rock. Cosmogenic isotopes are largely produced in terrestrial deposits near the surface of the earth because the cosmic flux is attenuated by rock at depths that exceed 2 m. Providing the production rate of a given cosmogenic isotope is known, as well as it decay constant or half-life (for radioactive isotopes) the exposure age can be determined using the following equation: T = ln(1 - N /P) assuming no erosion Where, T is the length of irraditation, N is the number cosmogenic produced atoms, is the decay constant, and P is
 Target Elements")
Cosmogenic Isotope Dating Commonly measured cosmogenic nuclides in rock. Isotope Half-life (yr) Target Elements Production Rate (atoms g-1 yr-1) 3 He stable O, Si, Mg, Fe, Al 100 -150 21 Ne stable Si, Mg, Fe, Al 80 -160 10 Be 1. 5 x 10⁶ O, Si, Mg, Fe, Al 26 Al 7. 2 x 10⁵ Si, Mg, Fe, Al 36 Cl 3. 0 x 105 K, Ca, Cl 14 C 5. 7 x 10³ O, Si, Mg, Fe 6 -8 (quartz) 37 8 -10 (basalt) 20

Production of 36 Cl in Rock Cl-36 is produced in earth rock via three major production pathways: spallation reactions with 40 Ca and 39 K, neutron activation of 35 Cl and minor production via muon capture of 40 Ca. Cl-36 Production in rock can be expressed by the following simplified equation: P = Ca(Cca) + K(CK) + n ( 35 N 35/ i. Ni), Where, Ca and K are the total production rates of 36 Cl due to C and K, Cca and CK are the elemental concentrations of C and K, n is thermal neutron capture rate, which is dependent upon the fraction of neutrons stopped by 35 Cl ( 35 N 35/ i. Ni), as determined by the effective cross sections of 35 Cl ( ) and all other absorbing elements 35 ( i) and their respective abundances (N 35 and Ni).

Whidbey and Fidalgo Islands provided excellent calibration sites for determination of the 36 Cl production rates. Exposed bedrock and large till boulders are composed of diverse lithologies and the deglaciation history (i. e. , timing of exposure) is well-dated.

GMD Double Bluff, Whidbey Island Proglacial delta, Issaquah, WA Mollusk Shells Logs collected from lacustrine sediment The deglaciation history of the Puget � Lowland is well constrained by many wood and GMD shell ages under- and overlying the Vashon Till. Whidbey Island is inferred to have been deglaciation ~15, 200 cal. yr ago.

The diverse bedrock geology within the accumulation area of the Puget Lobe ice sheet provides a diverse suite of target elements within the exposed till boulders. Certain lithologies permitted individual target elements to be isolated and production rate calculations simplified (one unknown).

Cl-36 Production Rates Because of the diverse lithology of the till boulders and bedrock surfaces in the study area, 36 C production pathways (35 C, 40 Ca and 39 K) could be isolated and the production rate for each target element solved with only one unknown. Previous calibration studies have relied on an iterative solution with multiple unknowns.

Cl-36 ages of all samples collected from Whidbey Island using the calculated production rates of Swanson and Caffee (2001).

Validation of the 36 Cl production rates can be tested using other well-constrained glaciated surfaces in northern Washington and southern British Columbia. Haystack till boulder near Withrow, WA.

Boulder Frequency vs Moraine Age Leavenworth Moraines Peshastin Moraine Boundary Butte Moraine Stratigraphic position of moraine sequence in the Icicle Creek drainage, WA and boulder frequency count (from youngest to oldest moraines (top to bottom images).

Cl-36 dating has been used to provide numerical age dating of the Icicle Creek moraine sequence near Leavenworth, WA.
.")
Cl-36 ages reported in (103 yr).
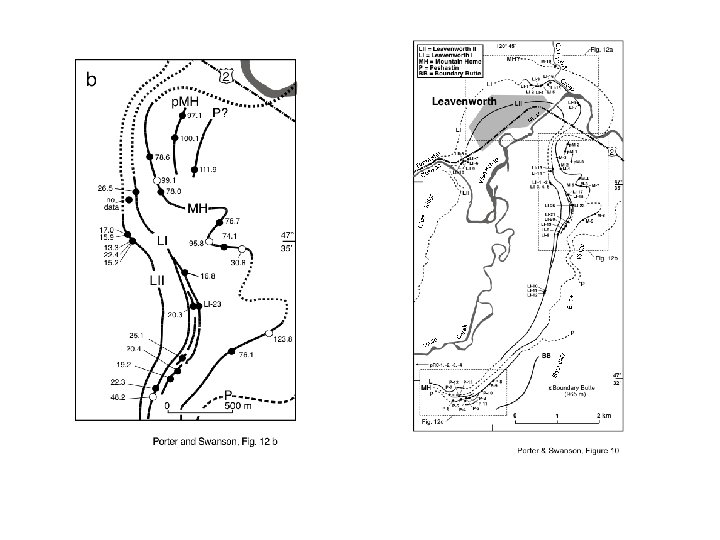

The Peshastin moraines have 36 Cl ages that date to MIS 5 d.

The timing of glacial advance in the Icicle Creek drainage is correlative with periods of major ice volume as documented by the MIS record, but the magnitude of each respective advance is more consistent with the Mean July Insolation record.
- Slides: 19