Tips tricks for giving a good presentation Intro


 Header (40) Header 2 (32) • This is a bullet point")


 Pre-settlers Pomacentrus amboinensis, Lizard")


 -")


- Slides: 43
Tips & tricks for giving a good presentation • Intro & Outline • Slide rules • Fonts • Graphs • Backgrounds • PPT alternatives • Top- / bottom bars • Animations • Mental preparation
Angus Angleman Are fish smarter than anglers? University of Anglaterra
Combined Effects of Ocean Acidification and its Co-stressors On Marine Organisms Hannes Baumann Department of Marine Sciences University of Connecticut Hannes Baumann hannes. baumann@uconn. edu www. befel. marinesciences. uconn. edu Sustainable Ocean Development, NYC 28 -30 September 2015
Combined effects of low p. H and low O 2 on coastal organisms H. Baumann, E. Smith, C. Gobler Sometimes … 1+1>2 Flax Pond Salt Marsh, Old Field, NY
Hannes Baumann, R. Wells, J. Rooker, Z. Baumann, D. Madigan, O. Snodgrass, H. Dewar, and N. Fisher Combining otolith microstructure + microchemistry What can we learn about juvenile Pacific Bluefin Tuna migration ?
Outline 1. 2. 3. 4. Introduction Material & Methods Results Discussion
Outline 1. Ocean acidification: the other CO 2 problem 2. Experimental setup 3. Reaction norms of larval fish exposed to CO 2 4. Fish in an acidified ocean
Fonts These are examples of Serif fonts nice in a book, not good in a presentation Times New Roman, Lucida, Palatino, Adobe Caslon …
Good sans serif fonts • • • Arial Black Verdana Bold Futura Berlin Sans Helvetica • Comic Sans
Font sizes (36) Header (40) Header 2 (32) • This is a bullet point in 28 • This is a bullet point in 24 • This is a bullet point in 20 • This is a bullet point in 18 This is a text in font size 12. Standard for documents, too small for presentations
Evolution of populations Individuals do NOT evolve Chapter 23
Evolution of populations Individuals do NOT evolve Outer glow is very effective Shadowing not so much Chapter 23
Backgrounds Contrast is key !
Backgrounds Contrast is key !
Backgrounds Contrast is key !
Pictures of landscapes will often work well … … if there’s not too much structure and you chose the right contrast
Fading the background picture to increase contrast
Hannes Baumann, R. Wells, J. Rooker, Z. Baumann, D. Madigan, O. Snodgrass, H. Dewar, and N. Fisher Combining otolith microstructure + microchemistry What can we learn about juvenile Pacific Bluefin Tuna migration ?
Slide organization Top-, Bottom-, sidebars
HYPOXIA Diaz & Rosenberg 1995 ACIDIFICATION Large body of research: Hypoxia & acidification affect organisms
Combined Effects of Ocean Acidification and its Co-stressors On Marine Organisms Bottom bars to repeat information or count slide numbers Hannes Baumann Sustainable Ocean Development, NYC 28 -30 September 2015
Side bars Pretty, but too much lost ‘real estate’
Side bars Better, but you still want to ‘use’ the blocked space
Animations ~90% of the ppt options are inappropriate for a science talk
Text animations are also a no-no • Bullet points should just appear, … • so you can make each point and … • have the attention of the audience
Settlers Pre-settlers Chrysiptera rollandi, Lizard Island 2007 (Baumann unpubl data) Pre-settlers Pomacentrus amboinensis, Lizard Island 2005 (Gagliano unpubl data) Otolith-fish size relationship Temperature-dependent growth Settlers Depth-dependent growth The pattern holds for other Pomacentrids
Juvenile growth in the laboratory Field Laboratory Declining but still relatively high growth in recruits Ad libitum group showed partial growth compensation Field Laboratory Experiment Growth declined further in starving group
Selective mortality! Baumann, H. et al. Fisheries Oceanography 2006. Linking growth- to environmental histories in central Baltic young-of-the-year sprat, Sprattus sprattus: an approach based on otolith microstructure analysis and hydrodynamic modeling. ? Baumann, H. , Malzahn, A. M. , et al. CJFAS 2006. Recruitment variability in Baltic sprat, Sprattus sprattus, is tightly coupled to temperature and transport patterns affecting the larval and early juvenile stages. Juveniles caught!Research 2008) Baumann et al. (Fisheries Investigating the selective survival of summer- over spring-born sprat, Sprattus sprattus, in the 18. -23. 10. Baltic Sea. Voss et al. (Progress in Oceanography 2012). Recruitment processes in Baltic sprat - a re-evaluation of GLOBEC-Germany hypotheses'
1 Otolith main function. . . - Stato-accoustic aid (i. e, . position) - Perception of sound waves (i. e. , hearing) That means: Finely tuned measuring system Needs to keep pace with growth Length growth egg adult: up to 10³ !! (e. g. , cod 1 mm 1. 5 m) „Onion ring principle“ Biggest relative somatic growth during the first weeks and months of life biggest otolith growth
Graphs = arguably the main reason for using ppt etc in the first place
Graph rules 1. A graph should only contain information/data you actually talk about Europe: Atlantic Asia: Pacific Latitude (°N) N-America: Atlantic Week of the year “ … but today I’m only going to talk about the first panel …”
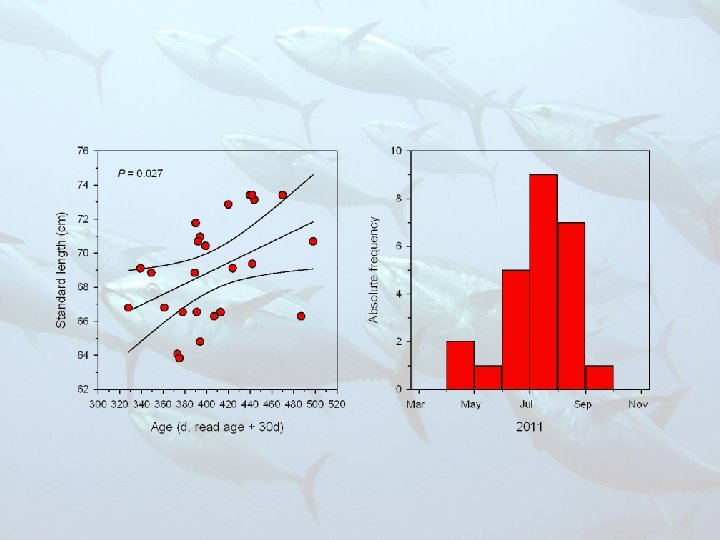
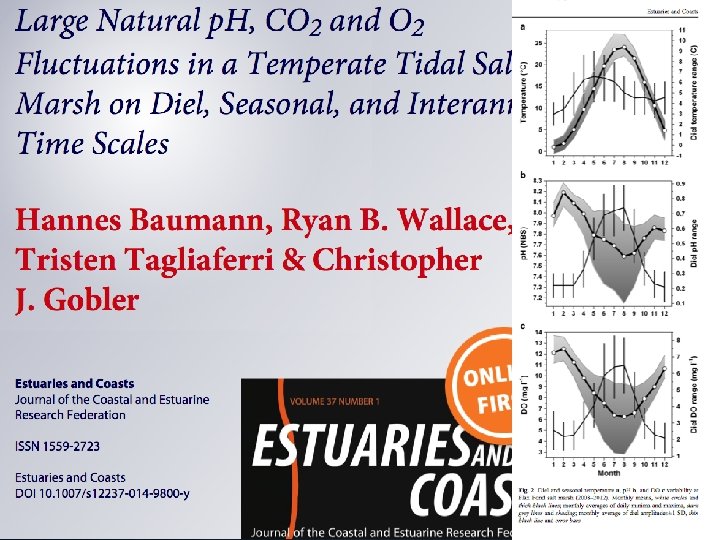
Graph rules 2. Thou shalt not copy and paste graphs from papers (not even your own)
3535 Hannes Baumann doi: 10. 1002/loe 2. 10002 e-
Graph rules 3. Know the complexity of your graph – adjust your presentation accordingly 1 st order graphs Simple pie, regression, or bar graphs (You can simply state the message)
2 nd order graphs • • • Nested bar graphs Multiple panels of 1 st order graphs Multi-category pies Multiple regression or other line graphs Simple 3 D (e. g. surface plots) Guide the eye of the audience by connecting the colors/labels of your graph to your message step by step control treatment
3 rd order graphs • • • Multiple panels of 2 nd order graphs Multiple line, time series graphs Correlation matrices Advanced 3 D Contour plots Tell the audience what pattern you want them to look at exactly, e. g. , “ the fact that the green is getting successively less over time …”
Graph rules 4. Complexity also increases with the kind of unit depicted 1 st order units: Length, weight, temperature, distance, time … 2 nd order units: Rates (e. g. , growth), residuals, anomalies 3 rd order units: Ratios (e. g. , Sr: Ba), derived statistics (plot of P - or R 2 -values), replace with indices?
Graph rules 5. Always introduce axes labels 6. Use consistent, contrasting colors 7. Font rules apply to tick and axes labels, too! 8. Have a few extra slides/graphs for questions ready
Acknowledgements • Be brief, stick to collaborators, funders • Your co-authors don’t need to be thanked • Neither do your parents, friends, lab mates
After the talk • Stick around, your job isn’t done. • Be grateful for compliments, but don’t make anything of them
Check spelling! “ 1 min / slide” rule “ 1 min faster than rehearsed” rule