
tinytableautalk egcosh www egcosh com Ainize Cidoncha Ainize
@tinytableautalk
@egcosh | www. egcosh. com

Ainize Cidoncha Ainize is a Commercial Analyst for Global during the day and Consultant for ISGlobal at night. @ainize_cidoncha

Filters Right, nice and bright Ainize Cidoncha Dashboard link

Goals RIGHT NICE BRIGHT
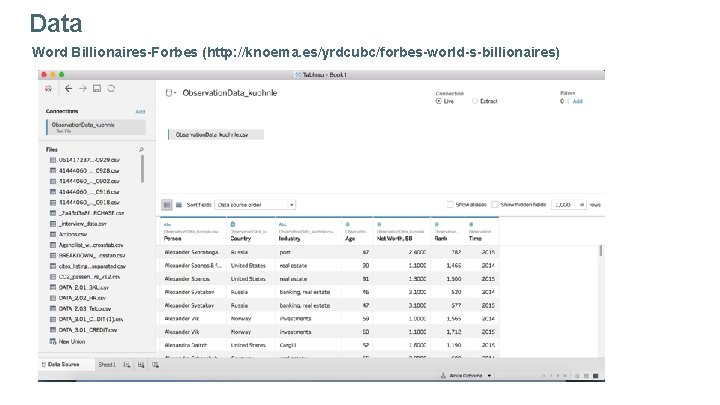
Data Word Billionaires-Forbes (http: //knoema. es/yrdcubc/forbes-world-s-billionaires)


RIGHT
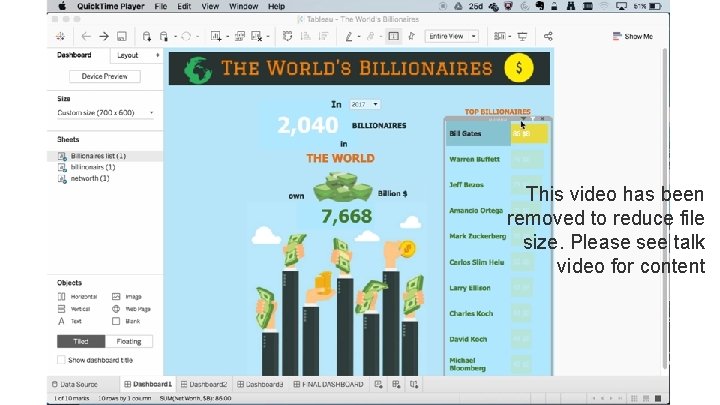
This video has been removed to reduce file size. Please see talk video for content

NICE
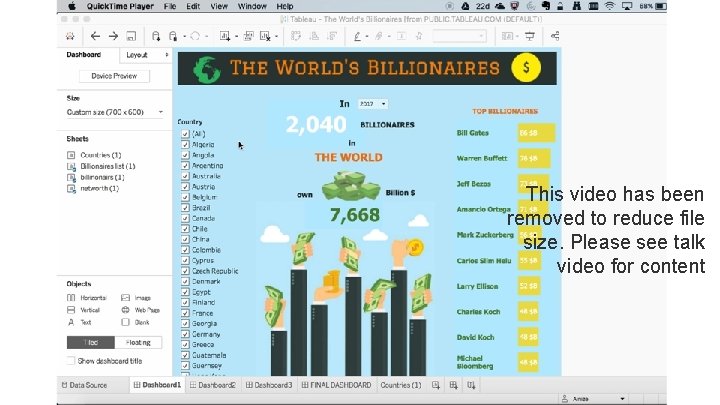
This video has been removed to reduce file size. Please see talk video for content

BRIGHT
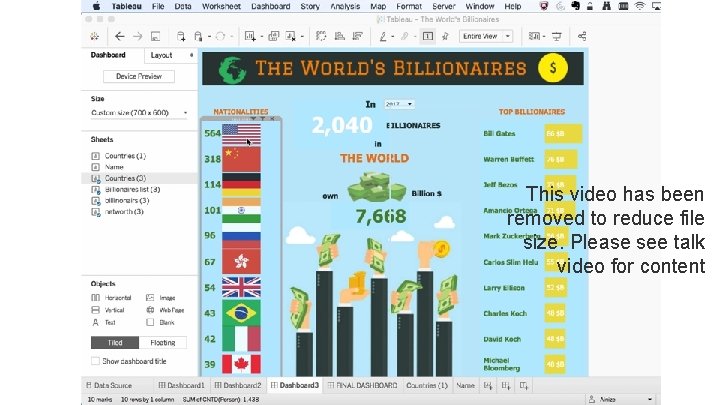
This video has been removed to reduce file size. Please see talk video for content
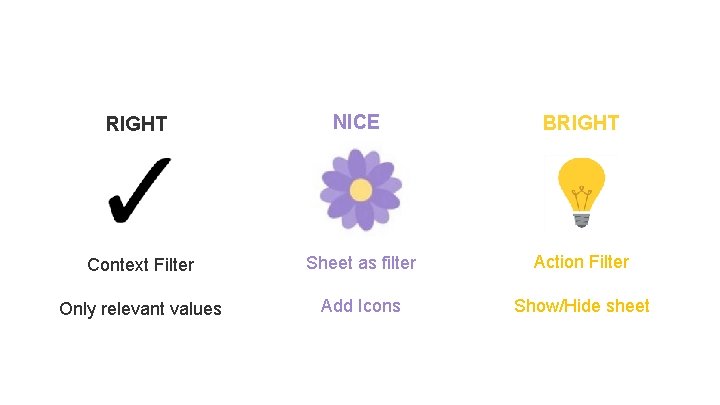
RIGHT NICE BRIGHT Context Filter Sheet as filter Action Filter Only relevant values Add Icons Show/Hide sheet
@tinytableautalk
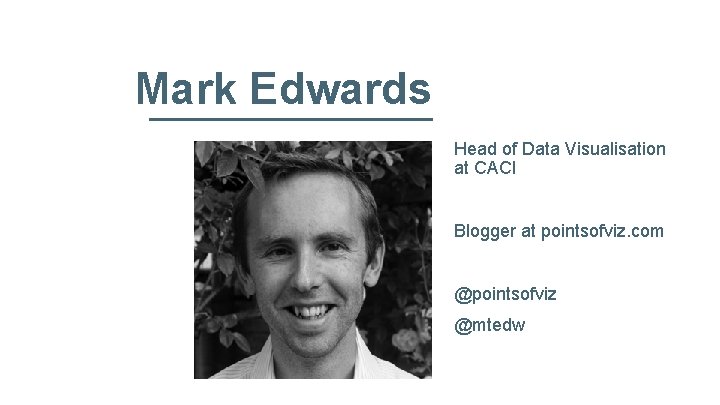
Mark Edwards Head of Data Visualisation at CACI Blogger at pointsofviz. com @pointsofviz @mtedw
Navigating With Tableau How To Make Data Viz Mapping Make Sense For Our Audience Mark Edwards
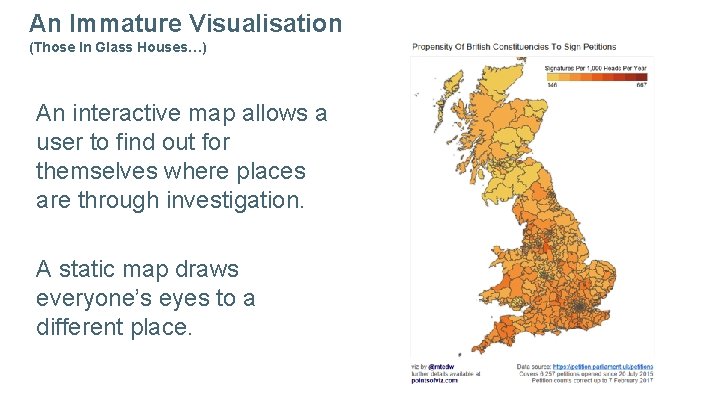
An Immature Visualisation (Those In Glass Houses…) An interactive map allows a user to find out for themselves where places are through investigation. A static map draws everyone’s eyes to a different place.
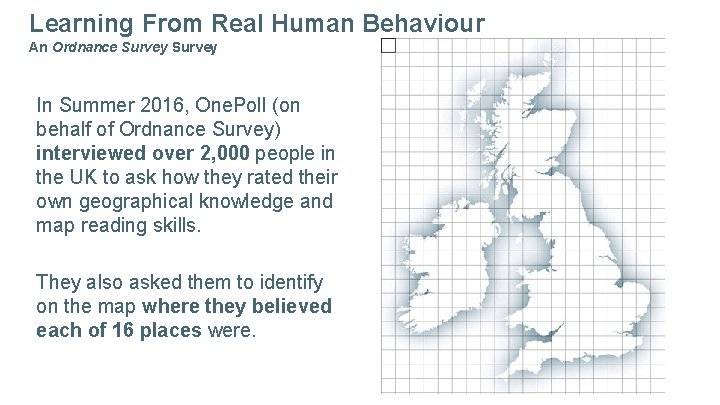
Learning From Real Human Behaviour An Ordnance Survey In Summer 2016, One. Poll (on behalf of Ordnance Survey) interviewed over 2, 000 people in the UK to ask how they rated their own geographical knowledge and map reading skills. They also asked them to identify on the map where they believed each of 16 places were.
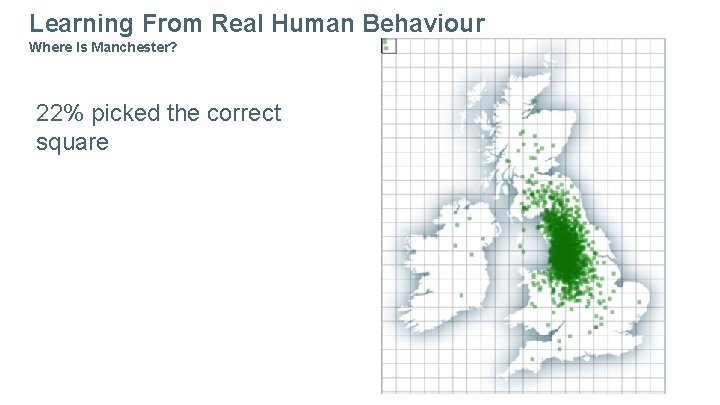
Learning From Real Human Behaviour Where Is Manchester? 22% picked the correct square
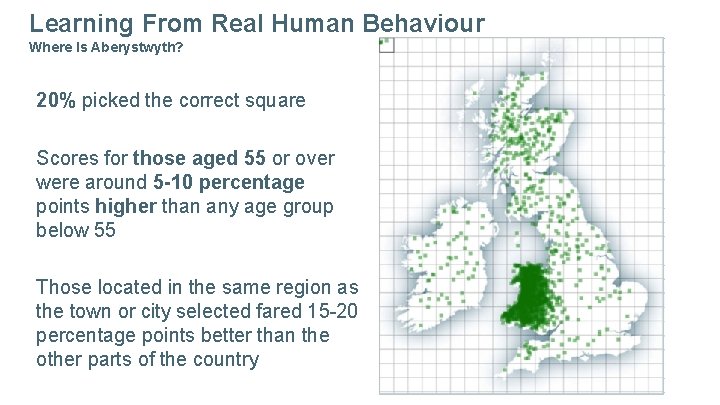
Learning From Real Human Behaviour Where Is Aberystwyth? 20% picked the correct square Scores for those aged 55 or over were around 5 -10 percentage points higher than any age group below 55 Those located in the same region as the town or city selected fared 15 -20 percentage points better than the other parts of the country
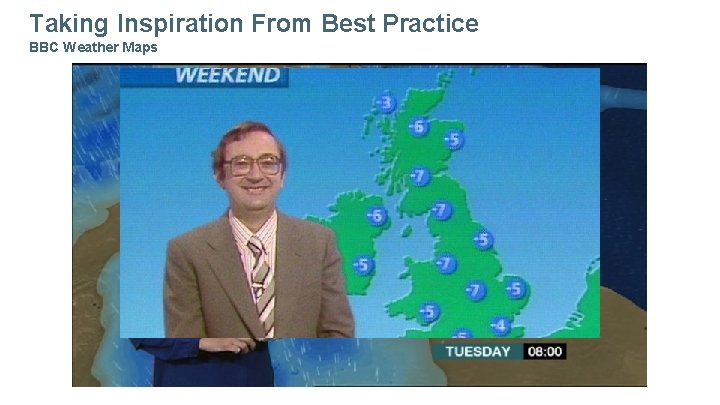
Taking Inspiration From Best Practice BBC Weather Maps
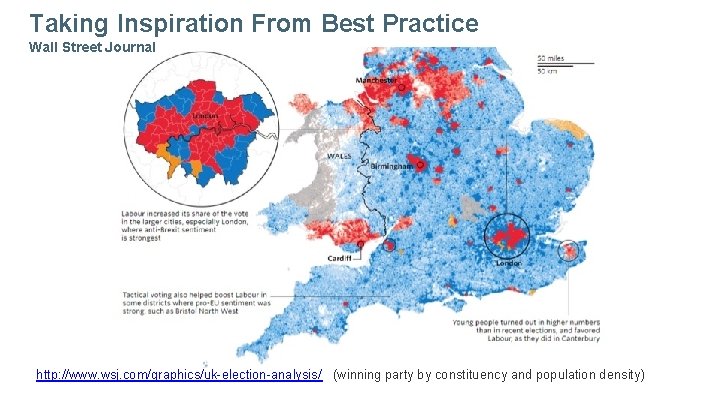
Taking Inspiration From Best Practice Wall Street Journal http: //www. wsj. com/graphics/uk-election-analysis/ (winning party by constituency and population density)
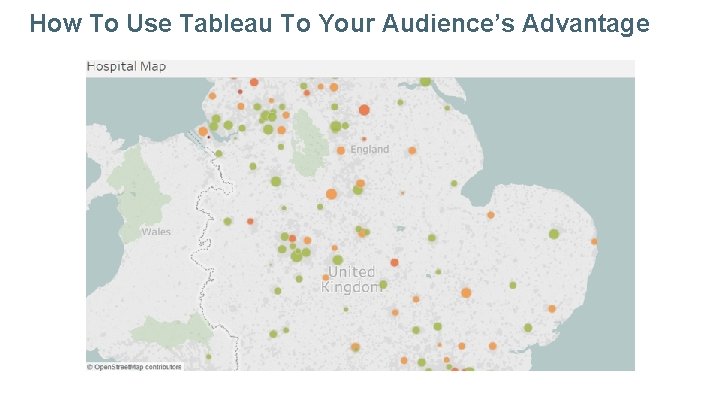
How To Use Tableau To Your Audience’s Advantage
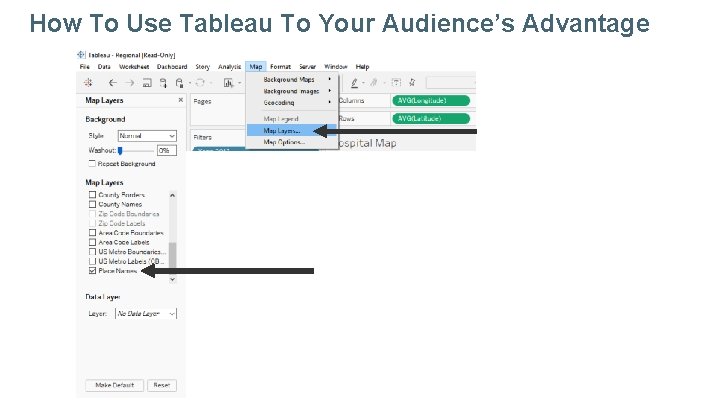
How To Use Tableau To Your Audience’s Advantage
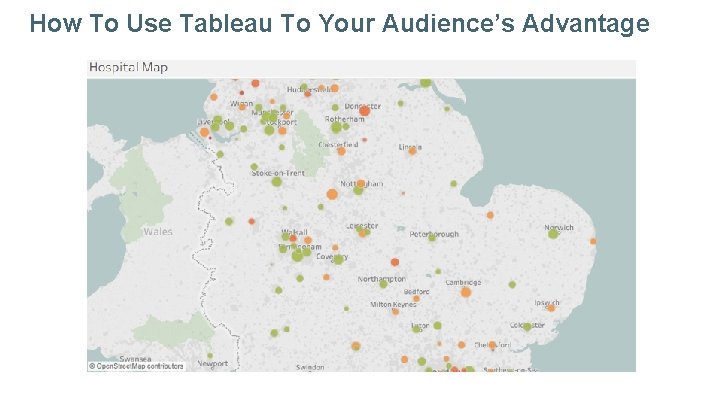
How To Use Tableau To Your Audience’s Advantage
@tinytableautalk
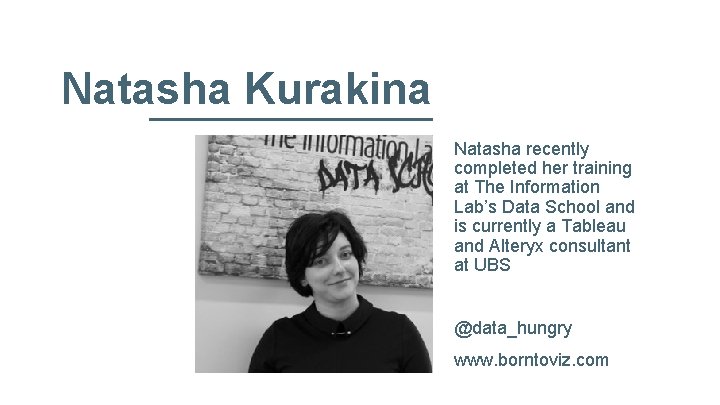
Natasha Kurakina Natasha recently completed her training at The Information Lab’s Data School and is currently a Tableau and Alteryx consultant at UBS @data_hungry www. borntoviz. com

Designing for Mobile Natasha Kurakina https: //public. tableau. com/profile/natasha. kurakina#!/
Designing for Mobile usage accounts for 51. 7% according to statcounter. com May, 2017 Photo from www. pexels. com Natasha Kurakina @data_hungry

Designing for Mobile Why? Natasha Kurakina @data_hungry
Designing for Mobile Right Tools Icons from www. flaticon. com Natasha Kurakina @data_hungry
Designing for Mobile Multiple Dashboard Versions Icons from www. flaticon. com Natasha Kurakina @data_hungry
Designing for Mobile Challenging Icons from www. flaticon. com Natasha Kurakina @data_hungry
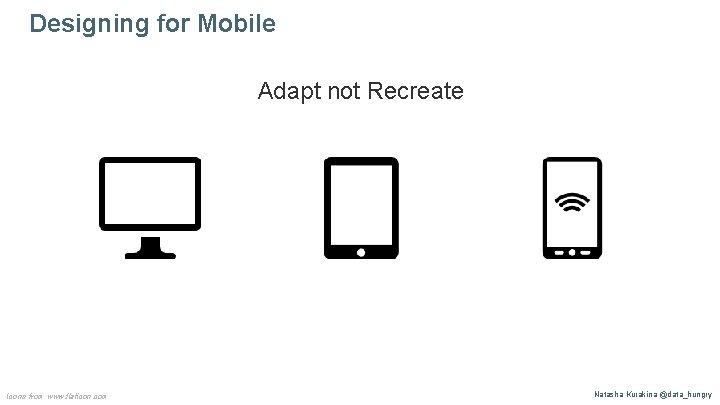
Designing for Mobile Adapt not Recreate Icons from www. flaticon. com Natasha Kurakina @data_hungry
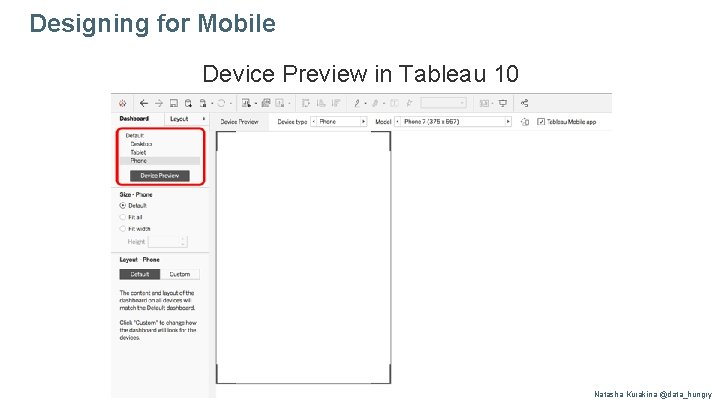
Designing for Mobile Device Preview in Tableau 10 Natasha Kurakina @data_hungry
Designing for Mobile What to consider? Natasha Kurakina @data_hungry
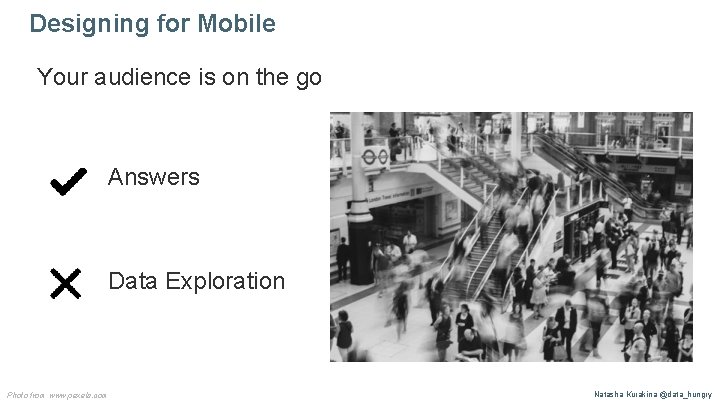
Designing for Mobile Your audience is on the go Answers Data Exploration Photo from www. pexels. com Natasha Kurakina @data_hungry

Designing for Mobile How? Natasha Kurakina @data_hungry
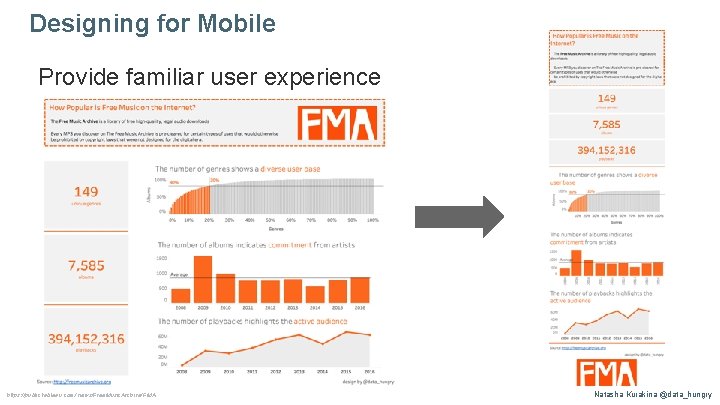
Designing for Mobile Provide familiar user experience https: //public. tableau. com/views/Free. Music. Archive/FMA Natasha Kurakina @data_hungry
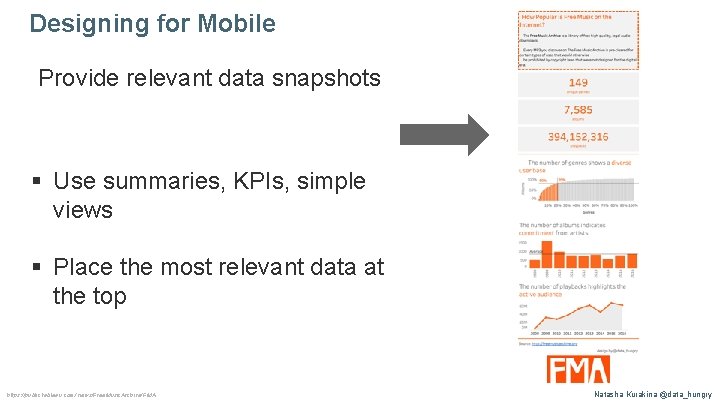
Designing for Mobile Provide relevant data snapshots § Use summaries, KPIs, simple views § Place the most relevant data at the top https: //public. tableau. com/views/Free. Music. Archive/FMA Natasha Kurakina @data_hungry
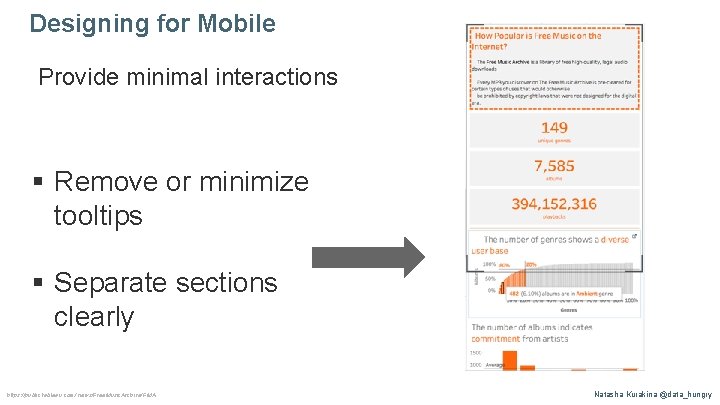
Designing for Mobile Provide minimal interactions § Remove or minimize tooltips § Separate sections clearly https: //public. tableau. com/views/Free. Music. Archive/FMA Natasha Kurakina @data_hungry
Designing for Mobile Thank you! Natasha Kurakina @data_hungry
@tinytableautalk
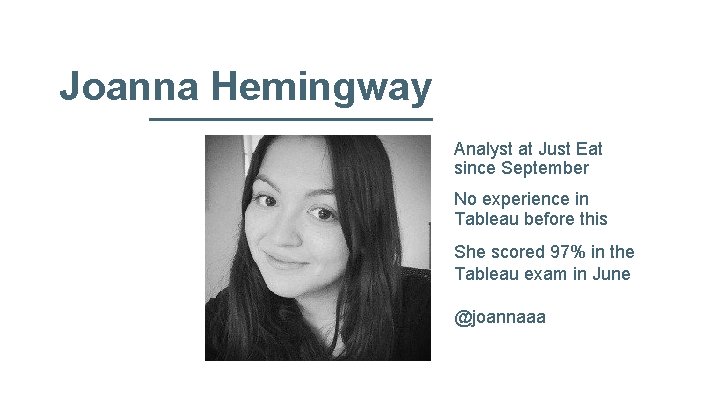
Joanna Hemingway Analyst at Just Eat since September No experience in Tableau before this She scored 97% in the Tableau exam in June @joannaaa

How to Ace the Tableau Desktop QA Exam Tiny Tableau Talks - June 2017

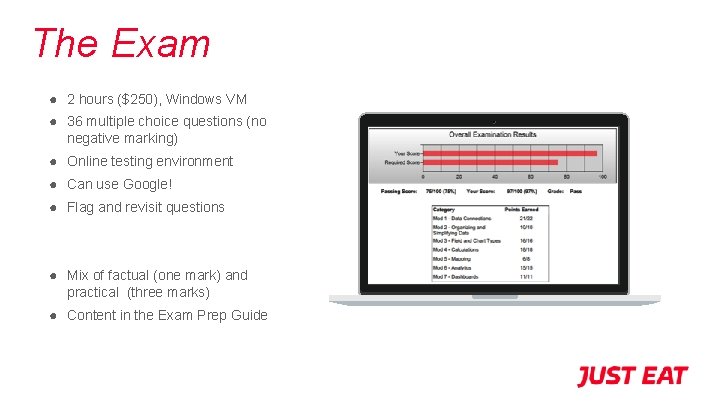
The Exam ● 2 hours ($250), Windows VM ● 36 multiple choice questions (no negative marking) ● Online testing environment ● Can use Google! ● Flag and revisit questions ● Mix of factual (one mark) and practical (three marks) ● Content in the Exam Prep Guide

1 2 3 4 Know the Suggested Content But focus on the practical skills! Take Practice Exams Exam Prep Guide learningtableau. com (Code: LEARNING TABLEAU) Leave the Hardest Qs to Last Flag, Skip and Revisit Stay Organised Worksheet for each answer (and label them!) How to Succeed
Now get Qualified! Joanna Hemingway @joannaaa
@tinytableautalk
Pablo Sáenz de Tejada Moved to London from Spain in in 2015. Consultant at The Information Lab. Previously a market research consultant and sociologist.
The importance of context Data as a way to go beyond biases Pablo Sáenz de Tejada
Politicians use statistics in the same way that a drunk uses lamp-posts —for support rather than illumination. Andrew Lang
Perception of the main problems in Spain (Max. 3 answers)
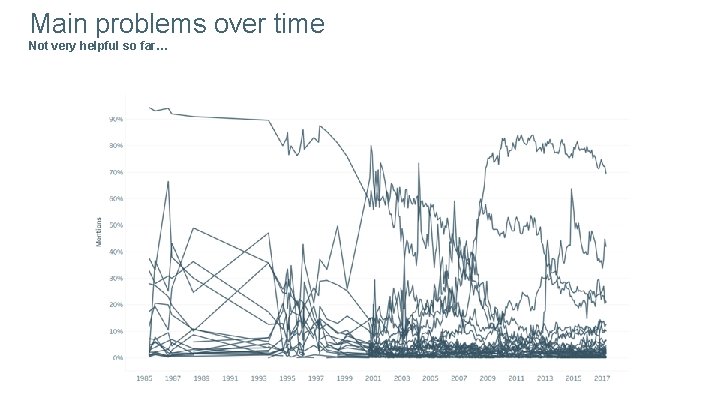
Main problems over time Not very helpful so far…
Different main problems in the last 30 years…
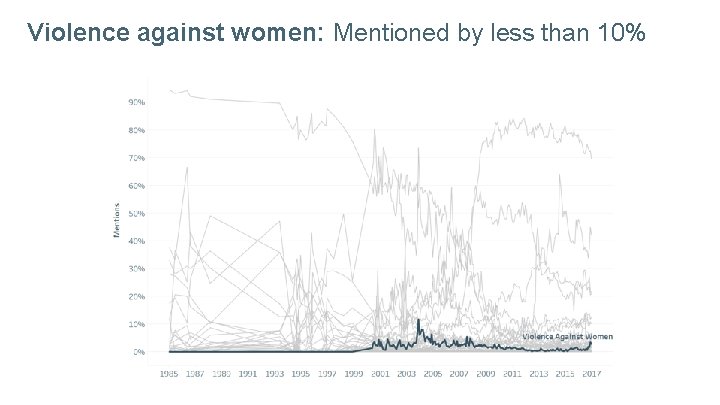
Violence against women: Mentioned by less than 10%
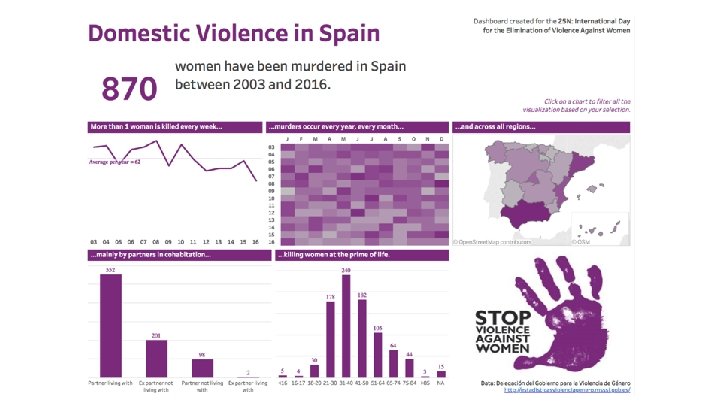
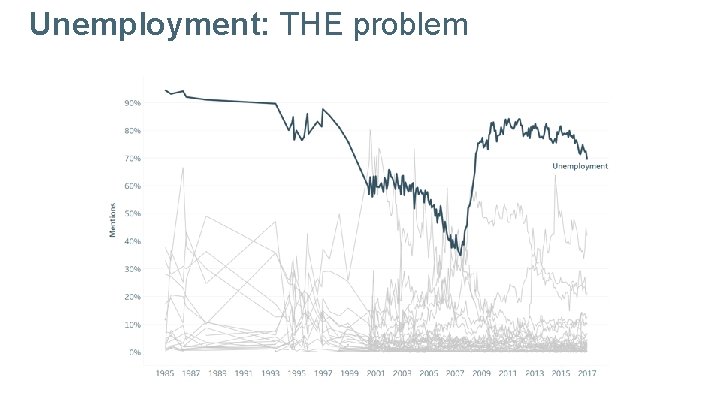
Unemployment: THE problem
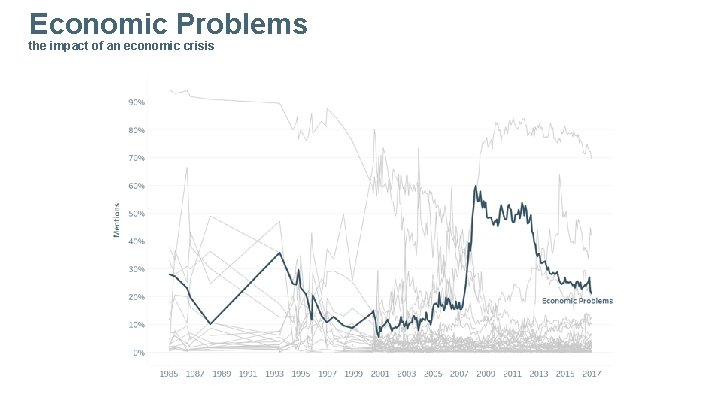
Economic Problems the impact of an economic crisis
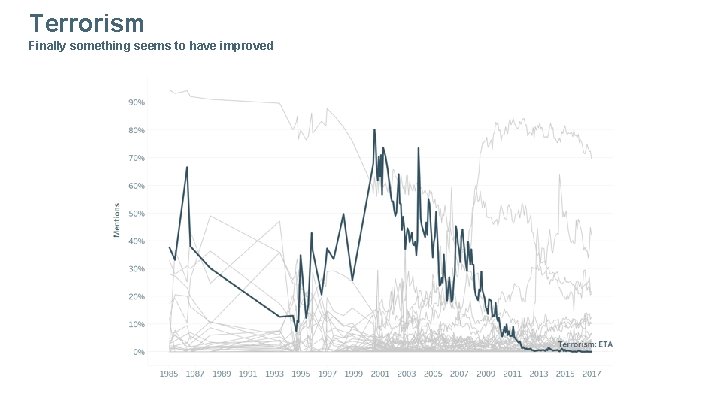
Terrorism Finally something seems to have improved
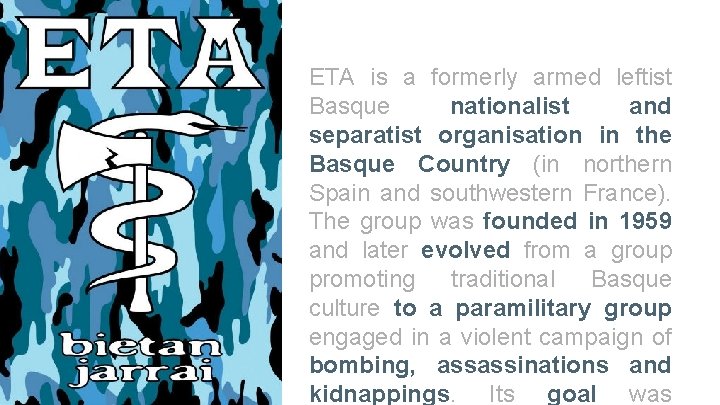
ETA is a formerly armed leftist Basque nationalist and separatist organisation in the Basque Country (in northern Spain and southwestern France). The group was founded in 1959 and later evolved from a group promoting traditional Basque culture to a paramilitary group engaged in a violent campaign of bombing, assassinations and kidnappings. Its goal was
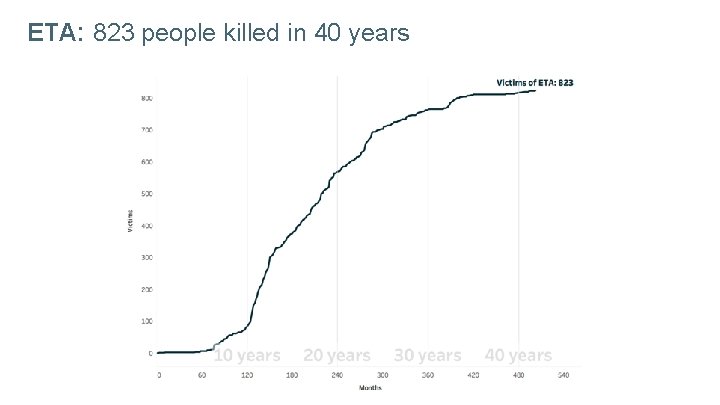
ETA: 823 people killed in 40 years
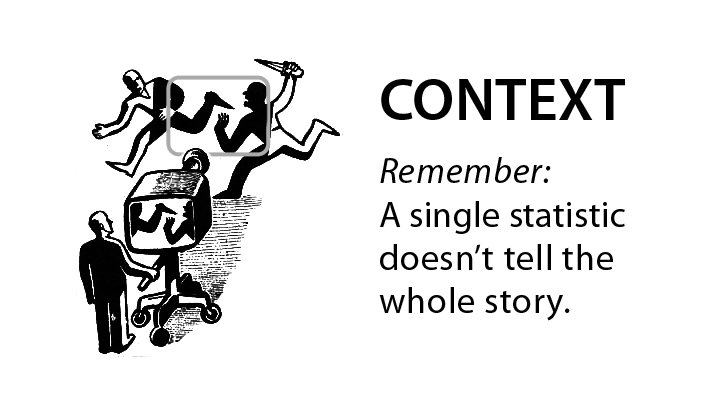
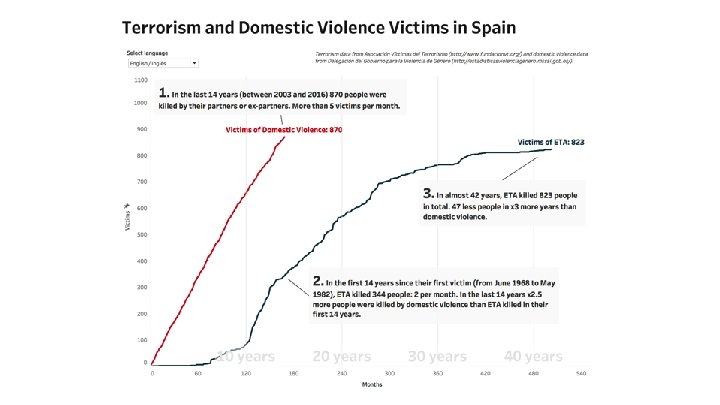

Public opinion and mass media
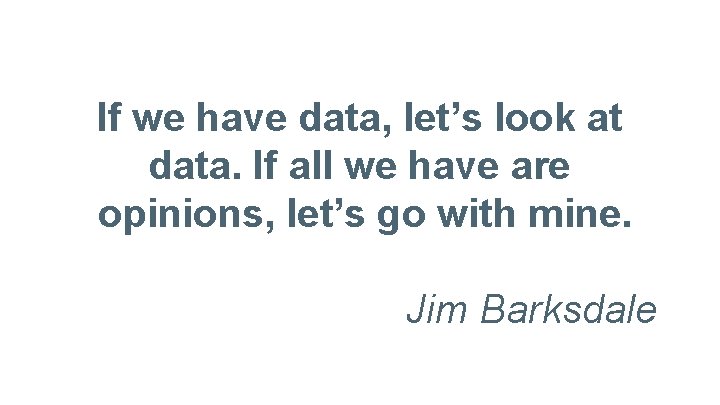
If we have data, let’s look at data. If all we have are opinions, let’s go with mine. Jim Barksdale
@tinytableautalk
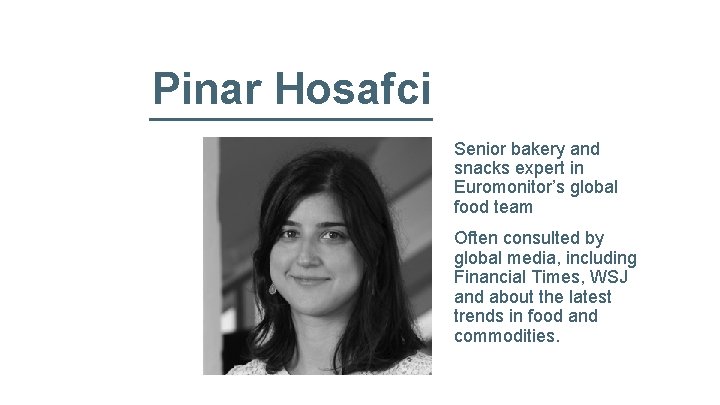
Pinar Hosafci Senior bakery and snacks expert in Euromonitor’s global food team Often consulted by global media, including Financial Times, WSJ and about the latest trends in food and commodities.

Visual Discovery Snacks Dashboard Pinar Hosafci Dashboard link
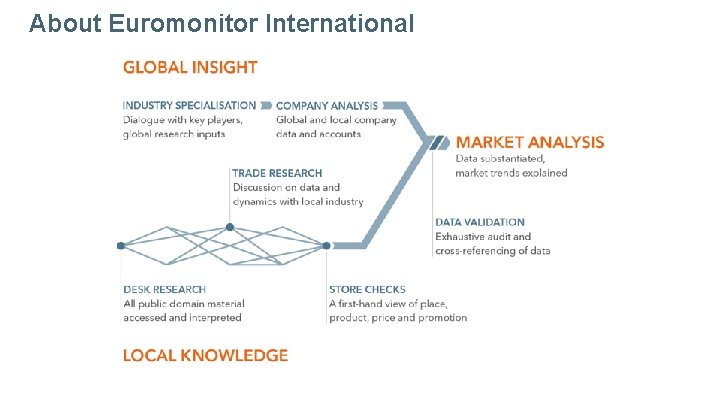
About Euromonitor International
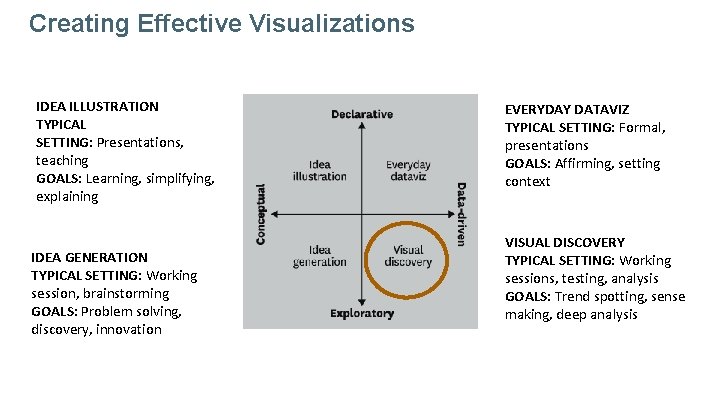
Creating Effective Visualizations IDEA ILLUSTRATION TYPICAL SETTING: Presentations, teaching GOALS: Learning, simplifying, explaining IDEA GENERATION TYPICAL SETTING: Working session, brainstorming GOALS: Problem solving, discovery, innovation EVERYDAY DATAVIZ TYPICAL SETTING: Formal, presentations GOALS: Affirming, setting context VISUAL DISCOVERY TYPICAL SETTING: Working sessions, testing, analysis GOALS: Trend spotting, sense making, deep analysis
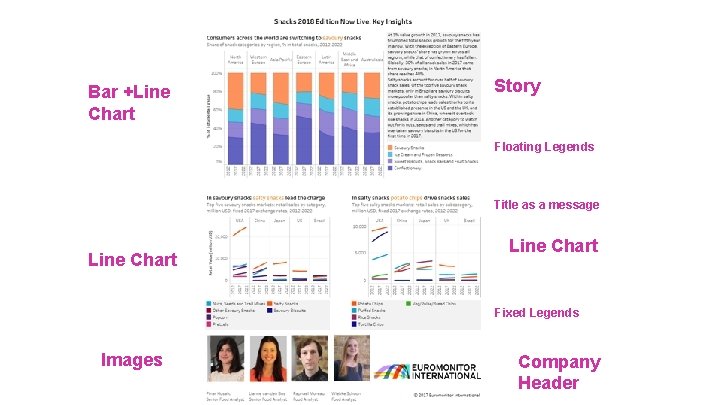
Bar +Line Chart Story Floating Legends Title as a message Line Chart Fixed Legends Images Company Header
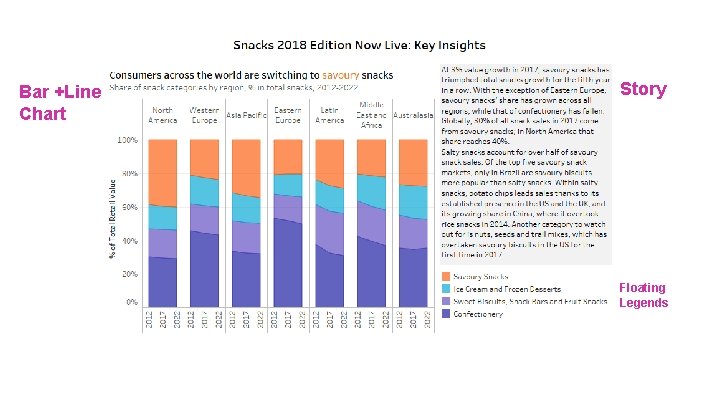
Bar +Line Chart Story Floating Legends
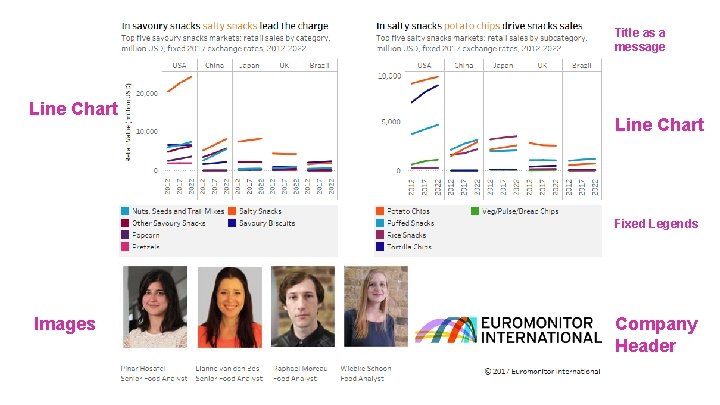
Title as a message Line Chart Fixed Legends Images Company Header
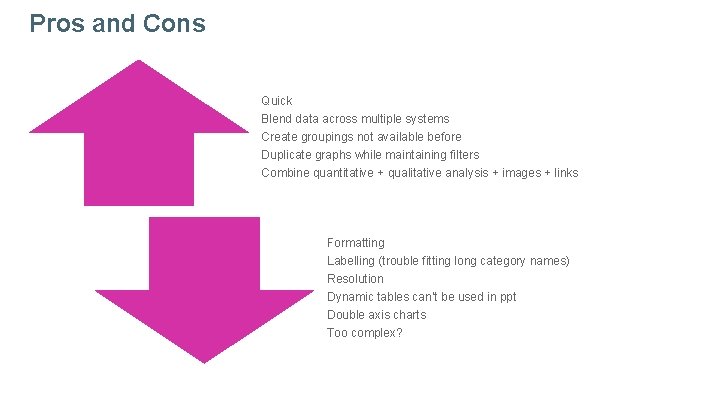
Pros and Cons Quick Blend data across multiple systems Create groupings not available before Duplicate graphs while maintaining filters Combine quantitative + qualitative analysis + images + links Formatting Labelling (trouble fitting long category names) Resolution Dynamic tables can’t be used in ppt Double axis charts Too complex?
My Two Cents § When everything is important nothing will be § There is no such thing as perfect
THANK YOU @tinytableautalk
@tinytableautalk
- Slides: 80