Timing Diagram It is similar to interaction diagram


- Slides: 32
Timing Diagram • It is similar to interaction diagram in which behavior of the object is represented in a given time frame. • Timing diagrams are used to explore the behaviors of objects throughout a given period of time. • Various constructs /events that can be drawn in timing diagram are lifeline, state, duration, constraints
constructs /events 1. Lifeline: The lifeline is named element which represents the element which is participating in the interactions. -It is represented with the name of the classifier. 2. State: The timing diagram shows various states of the object that might change over the time. -Terminated , Running, Waiting, Created states 3. Duration Constraints: It represents the interval constraints. 4. Time Constraints: Is also interval constraints that refers the time interval 5. Destruction Event: It represents by a X (cross)at the end of timeline.
Communication Diagram • For representing the structural organization of objects communication diagram is used. • The communication objects are placed as vertices in graph. The links that connect vertices are the arcs of this graph. These links have the role name to identify them. • The links can be adorned using messages that are sent and received by the objects. • This gives flow of control in when the objects collaborates with each other.
The communication diagrams can be distinguished from sequence diagram by two ways • There is a path between the objects. These paths can be shown along with the variables, parameters, global variables self access. • There is a sequence number as a prefix to the message. This sequence number specifies the time order of the message. To show nesting sub numbering can be used. • Ex 1. 1, 1. 2 and so on.
• The straight sequential flow of control can be normally shown in the communication diagram. However, the complex communication diagram can show iteration and branching within it. • For modeling iteration * is used as prefix to the message sequence number. ex: - *[count: =0. 5] Iteration indicates that the message will be repeated as per the condition. • The condition represents that the message will be executed as per the condition To represent the condition the sequence number is prefixed by the condition. ex: - [i<10]
Sequence diagram Communication Diagram • It models the lifeline of the • It represents structural links among the objects during objects. lifeline denotes there interactions. existence of the object between its creation and destruction. • The particular object can be • There is no facility to destroyed explicitly in some objects. sequence diagram. • The linking of the objects with other objects can not be represented as local or global. • The local or global scope of the objects with other objects can be represented in this diagram.
• The State diagram is used for modeling the dynamic aspect of the system. Advanced State Machine Diagram • The state diagram shows state machine. • It represents the states, transitions, activities and events. • The state machine emphasizes the flow of control from state to state. • It specifies the sequence of states an object goes through during the lifetime in response to events. • Graphically, a state is rendered as a rectangle with rounded corners. A transition is rendered as a solid directed line.
Figure shows State Machines: state machine are used to specify the behavior of objects that must respond to asynchronous stimulus or whose current behavior depends on their past
State and Event • State is a condition or situation during the life of an object during which it satisfies some condition or performs some activity or waits for some external event. • Object remains in the particular state for finite amount of time. • Ex. Microwave might be in various states such as 1. start(initial state when switched on) 2. Activating(waiting for some buttons to get pressed) 3. Active(working or processing ) 4. Stopped. Event is trigger that causes the state change. It is an occurrence at any particular time.
Various parts of states are Name: The textual string that represents the name of the state. Due to name one state is differ from another. When there is no name to the state it is called anonymous states. Entry/exit effects: On entering the particular state or on exiting some state the actions get executed. Internal Transitions: Transitions that are handled without change in the state. Sub states: (Nested states) Deferred Events: These are the events that are not handled by the currents state but are put in a queue and can be handled by the objects of another state. Initial and final state: Initial is starting state of the state machine. It is represented by a black colored filled circle. The final state represents the completion of the execution of the state machine. It is represented by filled black circle enclosed with an unfilled circle
Transitions • Transition is a relationship between two states. • When the state gets changed then it is said that the transition is fired. • Before the transition to get fired the object is in source state and after the transition gets fired the object is in target state. • Ex. Microwave changes its state from start to Activating when the one. Minute button gets pressed. Here pressing the button is an event that causes transition from one state to another. • There are 5 parts of transitions: 1. Source State: Starting state for the transition. 2. Event Trigger: It recognized by the object in source state. It causes transition get fired. 3. Guard condition: (Boolean Exp. )When expression is evaluated to true then transition is fired and then it is evaluated to false the transition is not fired. 4. Effect: Executable behavior (action that acts on the object) 5. Target State: Active state after completion of transition.
Advanced States and Transitions
Entry and Exit Actions Entry Actions are those actions that are to be done upon entry of a state and are shown by the keyword event ‘entry’ with an appropriate action Exit Actions are those actions that are to be done upon exit from a state marked by the keyword event ‘exit’, together with an appropriate action Internal Transitions are events that should be handled internally without leaving the state. Internal transitions may have events with parameters and guard conditions. Activities make use of object’s idle time when inside a state. ‘do’ transition is used to specify the work that’s to be done inside a state after the entry action is dispatched. Deferred Events A deferred event is a list of events whose occurrence in the state is postponed until a state in which the listed events are not deferred becomes active, at which time they occur and may trigger transitions as if they had just occurred. A deferred event is specified by listing the event with the special action ‘defer’.
Substates • A substate is a state that’s nested inside another one. • A state that has substates is called a composite state. • A composite state may contain either concurrent (orthogonal) or sequential (disjoint) substates. • Sub states may be nested up to any level. • It is useful for simplifying the complex behavior of the state machines. • Two types of substates: 1 Simple State: States that does not have the nested substates. 2 Complex states: States they may contain concurrent states or sequential states as substates.
Sequential Substates
Concurrent Substates
State Machine Diagram • State Machine Diagrams show the different states of an entity. • It can also show an entity responds to various events by changing from one state to another. • State machine diagram is a UML diagram used to model the dynamic nature of a system. • “A state is an abstraction of the attribute values and links of an object. Sets of values are grouped together into a state according to properties that affect the gross behavior of the object. " • A state is a constraint or a situation in the life cycle of an object, in which a constraint holds, the object executes an activity or waits for an event. • A state machine diagram is a graph consisting of: States (simple states or composite states) State transitions connecting the states Example:
State Notation
Characteristics of State • State represent the conditions of objects at certain points in time. • Objects (or Systems) can be viewed as moving from state to state. • A point in the lifecycle of a model element that satisfies some condition, where some particular action is being performed or where some event is waited
Substates A simple state is one which has no substructure. A state which has substates (nested states) is called a composite state. Substates may be nested to any level. Substate Example – Heater. A nested state machine may have at most one initial state and one final state. Substates are used to simplify complex flat state machines by showing that some states are only possible within a particular context (the enclosing state).
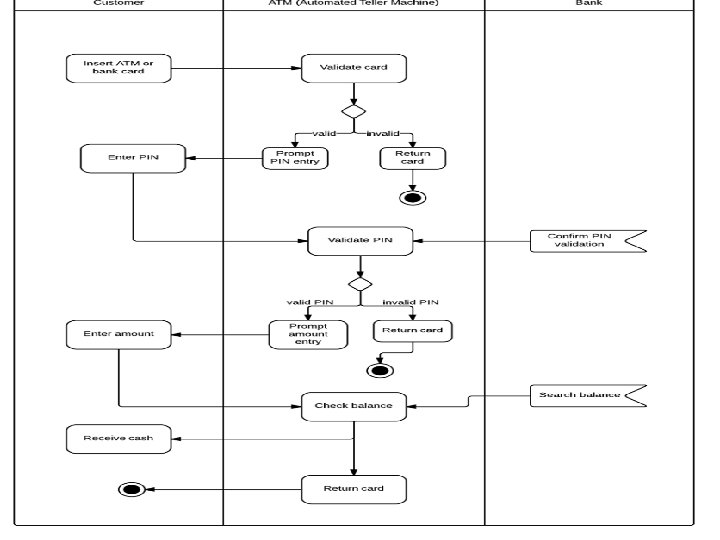
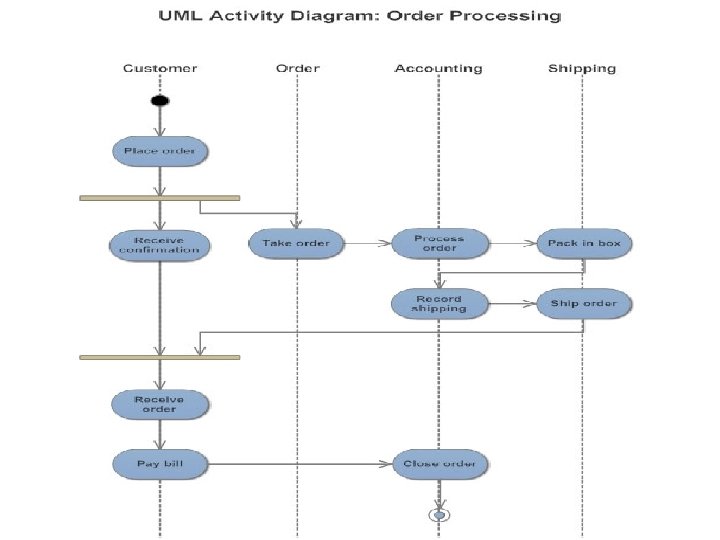
Activity Diagram • Activity diagram is another important diagram in UML to describe the dynamic aspects of the system. • An activity diagram visually presents a series of actions or flow of control in a system similar to a flowchart or a data flow diagram. • Activity diagrams are often used in business process modeling. • Activities modeled can be sequential and concurrent. • Activity diagrams are graphical representations of workflows of stepwise activities and actions. • Graphically the activity diagram is a collection of nodes and srcs. Purpose of Activity Diagrams It captures the dynamic behavior of the system. It does not show any message flow from one activity to another. Draw the activity flow of a system. Describe the sequence from one activity to another. Describe the parallel, branched and concurrent flow of the system.
Actions and Activity Nodes Actions: The executable and atomic computations are called as actions. Ex. evaluation of some expression, There are two ways of representing an action 1) Simple action 2) Expression Actions are represented by rounded box. Activity Nodes: It is a nested grouping of actions or other nested activity node.
Basic Activity Diagram Notations and Symbols Initial State or Start Point A small filled circle followed by an arrow represents the initial action state or the start point for any activity diagram. For activity diagram using swim lanes, make sure the start point is placed in the top left corner of the first column. Activity or Action State An action state represents the non-interruptible action of objects. You can draw an action state in Smart Draw using a rectangle with rounded corners.
Action Flow Action flows, also called edges and paths, illustrate the transitions from one action state to another. They are usually drawn with an arrowed line. Object Flow Object flow refers to the creation and modification of objects by activities. An object flow arrow from an action to an object means that the action creates or influences the object. An object flow arrow from an object to an action indicates that the action state uses the object.
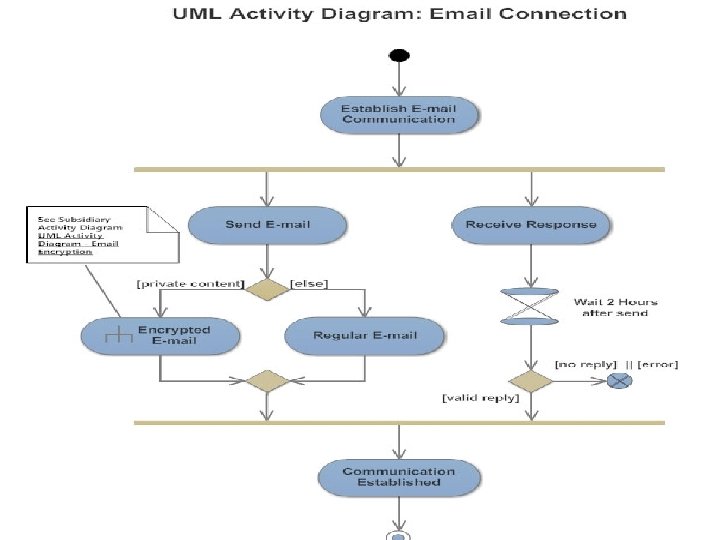
Decisions and Branching A diamond represents a decision with alternate paths. When an activity requires a decision prior to moving on to the next activity, add a diamond between the two activities. The outgoing alternates should be labeled with a condition or guard expression. You can also label one of the paths "else. “ Guards In UML, guards are a statement written next to a decision diamond that must be true before moving next to the next activity. These are not essential, but are useful when a specific answer, such as "Yes, three labels are printed, " is needed before moving forward.
Synchronization A fork node is used to split a single incoming flow into multiple concurrent flows. It is represented as a straight, slightly thicker line in an activity diagram. A join node joins multiple concurrent flows back into a single outgoing flow. A fork and join mode used together are often referred to as synchronization. Time Event This refers to an event that stops the flow for a time; an hourglass depicts it.
Merge Event A merge event brings together multiple flows that are not concurrent. Sent and Received Signals represent how activities can be modified from outside the system. They usually appear in pairs of sent and received signals, because the state can't change until a response is received, much like synchronous messages in a sequence diagram. For example, an authorization of payment is needed before an order can be completed. Interrupting Edge An event, such as a cancellation, that interrupts the flow denoted with a lightning bolt.
Swimlanes • Many times the activity diagram needs to partition in groups to represent the flow of business processes. • Each group represents the particular business flow belonging to some category, such group is called swimlane. • Swimlanes group related activities into one column. • Graphically it is denoted by vertical solid line. • It specifies certain set of activities. where each swimlane has a unique name.