
Timing capabilities of UltraFast Silicon Detector A parameterization
Timing capabilities of Ultra-Fast Silicon Detector • A parameterization of time resolution Nicolo Cartiglia, INFN, Torino - UFSD - 9 th Trento Workshop • A program to calculate Time resolution • UFSD Timing capabilities • How to measure Time resolution Nicolo Cartiglia With F. Cenna, F. Marchetto, A. Picerno F. Ravera, H. Sadrozinski, A. Seiden, A. Solano, A. Vinattieri, N. Spencer, A. Zatserklyaniy 1
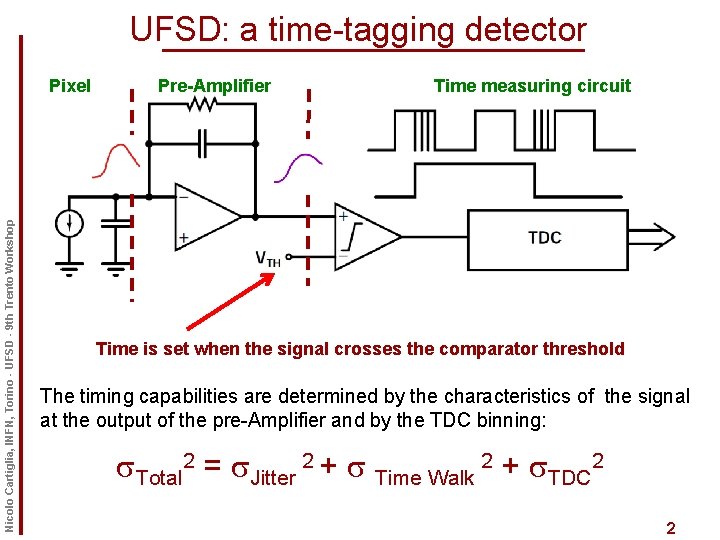
UFSD: a time-tagging detector Nicolo Cartiglia, INFN, Torino - UFSD - 9 th Trento Workshop Pixel Pre-Amplifier Time measuring circuit Time is set when the signal crosses the comparator threshold The timing capabilities are determined by the characteristics of the signal at the output of the pre-Amplifier and by the TDC binning: s. Total 2 = s. Jitter 2 + s Time Walk 2 + s. TDC 2 2
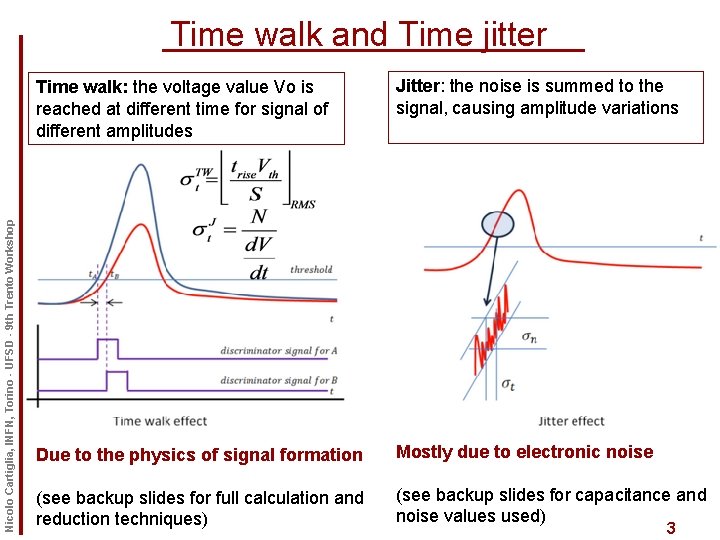
Nicolo Cartiglia, INFN, Torino - UFSD - 9 th Trento Workshop Time walk and Time jitter Time walk: the voltage value Vo is reached at different time for signal of different amplitudes Jitter: the noise is summed to the signal, causing amplitude variations Due to the physics of signal formation Mostly due to electronic noise (see backup slides for full calculation and reduction techniques) (see backup slides for capacitance and noise values used) 3
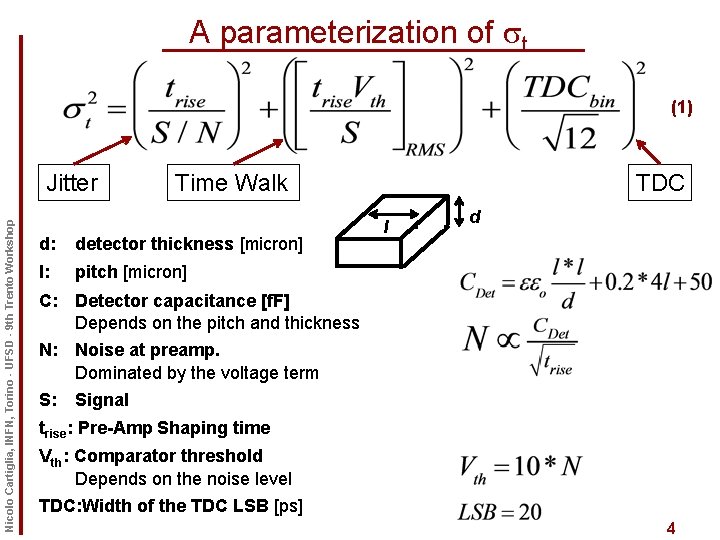
A parameterization of st (1) Nicolo Cartiglia, INFN, Torino - UFSD - 9 th Trento Workshop Jitter Time Walk d: detector thickness [micron] l: pitch [micron] TDC l d C: Detector capacitance [f. F] Depends on the pitch and thickness N: Noise at preamp. Dominated by the voltage term S: Signal trise: Pre-Amp Shaping time Vth: Comparator threshold Depends on the noise level TDC: Width of the TDC LSB [ps] 4
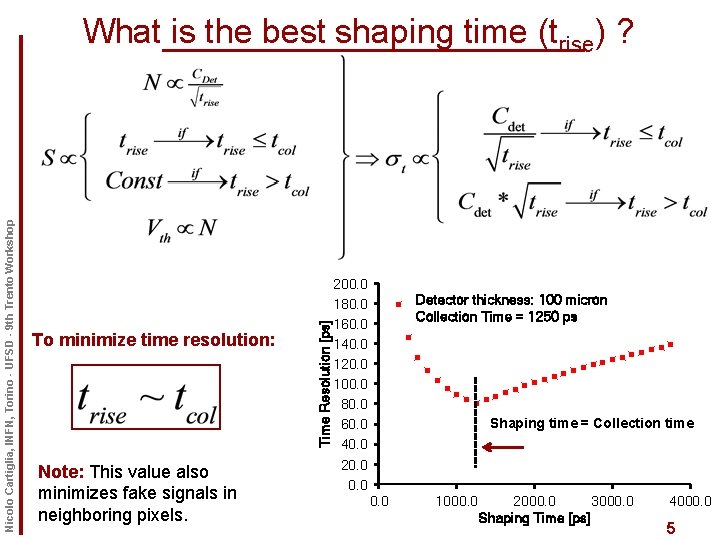
To minimize time resolution: Note: This value also minimizes fake signals in neighboring pixels. Time Resolution [ps] Nicolo Cartiglia, INFN, Torino - UFSD - 9 th Trento Workshop What is the best shaping time (trise) ? 200. 0 180. 0 160. 0 140. 0 120. 0 100. 0 80. 0 60. 0 40. 0 20. 0 Detector thickness: 100 micron Collection Time = 1250 ps Shaping time = Collection time 0. 0 1000. 0 2000. 0 3000. 0 Shaping Time [ps] 4000. 0 5
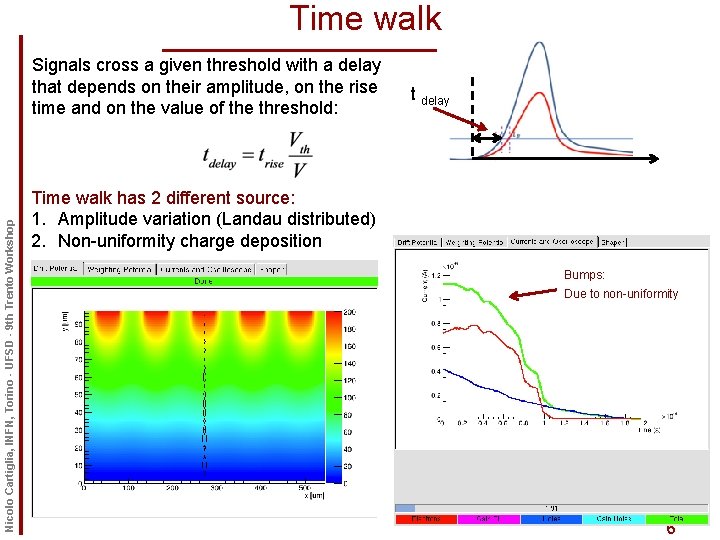
Time walk Nicolo Cartiglia, INFN, Torino - UFSD - 9 th Trento Workshop Signals cross a given threshold with a delay that depends on their amplitude, on the rise time and on the value of the threshold: t delay Time walk has 2 different source: 1. Amplitude variation (Landau distributed) 2. Non-uniformity charge deposition Bumps: Due to non-uniformity 6
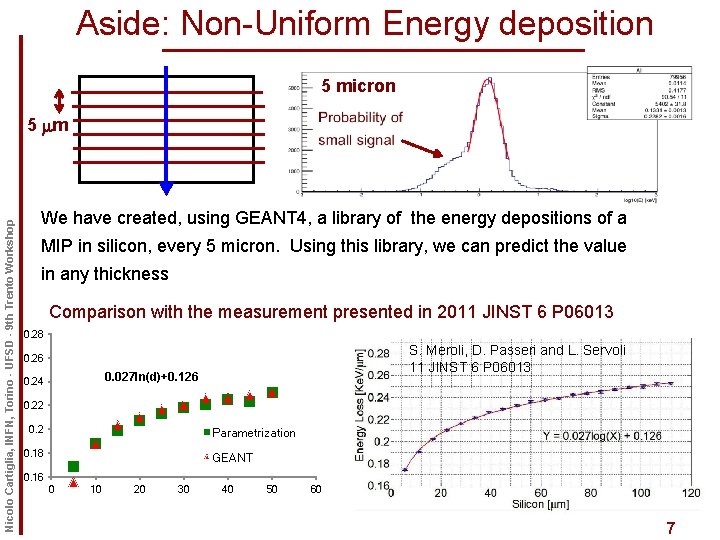
Aside: Non-Uniform Energy deposition 5 micron Nicolo Cartiglia, INFN, Torino - UFSD - 9 th Trento Workshop 5 mm We have created, using GEANT 4, a library of the energy depositions of a MIP in silicon, every 5 micron. Using this library, we can predict the value in any thickness Comparison with the measurement presented in 2011 JINST 6 P 06013 0. 28 S. Meroli, D. Passeri and L. Servoli 11 JINST 6 P 06013 0. 26 0. 027 ln(d)+0. 126 0. 24 0. 22 0. 2 Parametrization 0. 18 GEANT Rescaled 0. 16 0 10 20 30 40 50 60 7
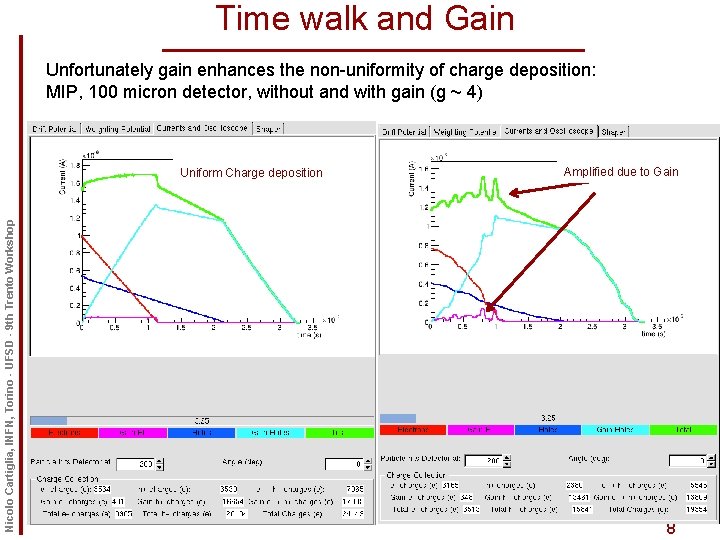
Time walk and Gain Unfortunately gain enhances the non-uniformity of charge deposition: MIP, 100 micron detector, without and with gain (g ~ 4) Nicolo Cartiglia, INFN, Torino - UFSD - 9 th Trento Workshop Uniform Charge deposition Amplified due to Gain 8
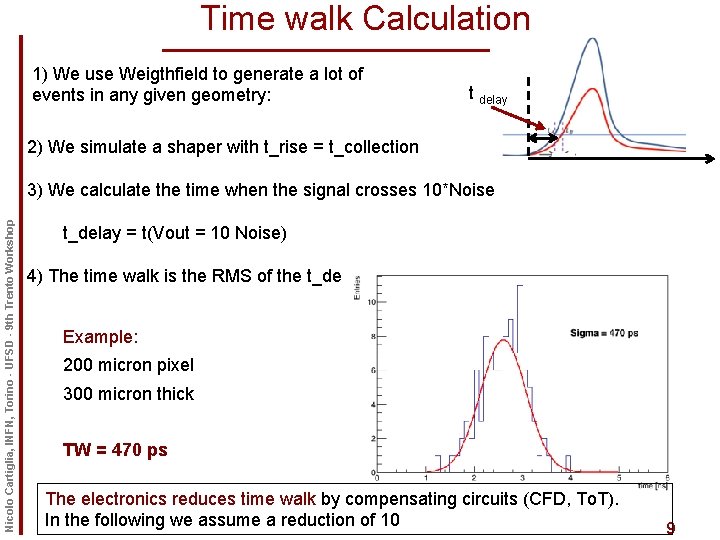
Time walk Calculation 1) We use Weigthfield to generate a lot of events in any given geometry: t delay 2) We simulate a shaper with t_rise = t_collection Nicolo Cartiglia, INFN, Torino - UFSD - 9 th Trento Workshop 3) We calculate the time when the signal crosses 10*Noise t_delay = t(Vout = 10 Noise) 4) The time walk is the RMS of the t_delay distribution. Example: 200 micron pixel 300 micron thick TW = 470 ps The electronics reduces time walk by compensating circuits (CFD, To. T). In the following we assume a reduction of 10 9
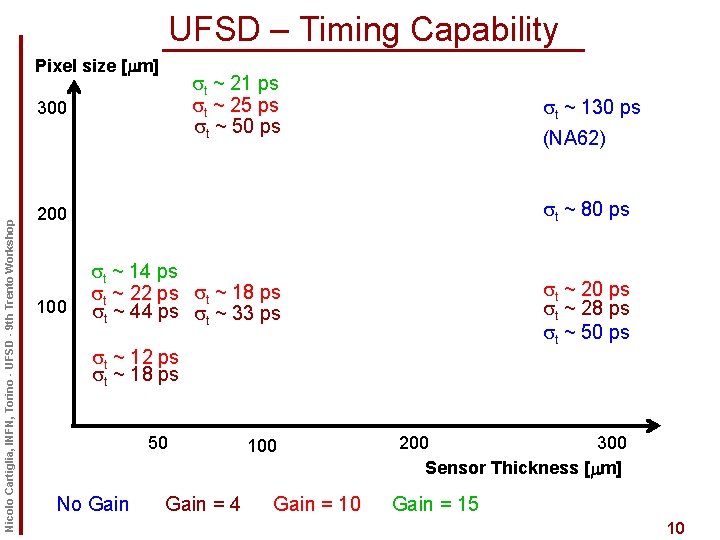
UFSD – Timing Capability Pixel size [mm] st ~ 21 ps st ~ 25 ps st ~ 50 ps Nicolo Cartiglia, INFN, Torino - UFSD - 9 th Trento Workshop 300 st ~ 130 ps (NA 62) st ~ 80 ps 200 100 st ~ 14 ps st ~ 22 ps st ~ 18 ps st ~ 44 ps st ~ 33 ps st ~ 20 ps st ~ 28 ps st ~ 50 ps st ~ 12 ps st ~ 18 ps 50 No Gain = 4 100 Gain = 10 200 300 Sensor Thickness [mm] Gain = 15 10
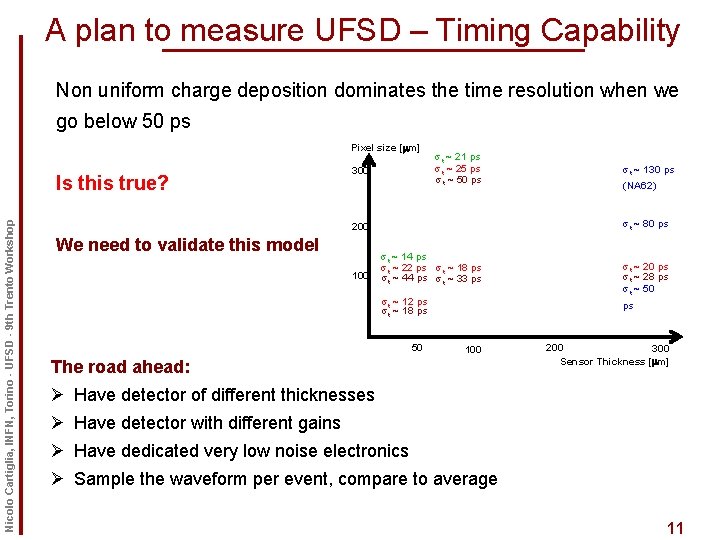
A plan to measure UFSD – Timing Capability Non uniform charge deposition dominates the time resolution when we go below 50 ps Pixel size [mm] Nicolo Cartiglia, INFN, Torino - UFSD - 9 th Trento Workshop Is this true? 300 st ~ 21 ps st ~ 25 ps st ~ 50 ps 100 (NA 62) st ~ 80 ps 200 We need to validate this model st ~ 130 ps st ~ 14 ps st ~ 22 ps st ~ 18 ps st ~ 44 ps st ~ 33 ps st ~ 12 ps st ~ 18 ps 50 st ~ 20 ps st ~ 28 ps st ~ 50 ps 100 The road ahead: 200 300 Sensor Thickness [mm] Ø Have detector of different thicknesses Ø Have detector with different gains Ø Have dedicated very low noise electronics Ø Sample the waveform per event, compare to average 11
UFSD – Summary We are just starting to understand the timing capability of UFSD We developed a program, Weightfield 2. 0, that seems to be able to predict the major feature of the problem. Nicolo Cartiglia, INFN, Torino - UFSD - 9 th Trento Workshop (available at http: //personalpages. to. infn. it/~cartigli/Weightfield 2. 0/) Gain is the key to excellent timing, however it exacerbates the effect of non uniform charge deposition. We need to measure the signal “bumpiness” of the output signal: detector production is ahead of electronics characterization. We need to invest in this aspect. 10 ps looks really difficult, 20 ps looks 1/4 as difficult, 30 ps 1/9 … 12
- Slides: 12