TimeSeries Analysis and Forecasting Part IV To read


-Point Moving Average § A series of arithmetic means over time § Result")


 § Let the time series have period s, where s")


 Fall Quarter Sales Centered Moving Average 1 2 3 4")


- Slides: 30
Time-Series Analysis and Forecasting – Part IV To read at home
Method of moving average
Method of moving average consists in replacement of initial levels of series by the average values, which are calculated for the successively changing periods of time
Moving Averages § Example: Five-year moving average § First average: § Second average: § etc. Statistics for Business and Economics, 6 e © 2007 Pearson Education, Inc. Chap 19 -4
(2 m+1)-Point Moving Average § A series of arithmetic means over time § Result depends upon choice of m (the number of data values in each average) § Examples: § For a 5 year moving average, m = 2 § For a 7 year moving average, m = 3 § Etc. § Replace each xt with Statistics for Business and Economics, 6 e © 2007 Pearson Education, Inc. Chap 19 -5
Example 16 19, 3 20, 5 22, 2 23 23, 6
Example 17. Annual Data Year 1 2 3 4 5 6 7 8 9 10 11 etc… Sales 23 40 25 27 32 48 33 37 37 50 40 etc… Statistics for Business and Economics, 6 e © 2007 Pearson Education, Inc. … … Chap 19 -7
Calculating Moving Averages § Let m = 2 Year Sales Average Year 5 -Year Moving Average 1 23 3 29. 4 2 40 4 34. 4 3 25 5 33. 0 4 27 6 35. 4 5 32 7 37. 4 6 48 8 41. 0 7 33 9 39. 4 8 37 … … 9 37 10 50 11 40 etc… § Each moving average is for a consecutive block of (2 m+1) years Statistics for Business and Economics, 6 e © 2007 Pearson Education, Inc. Chap 19 -8
Annual vs. Moving Average § The 5 -year moving average smoothes the data and shows the underlying trend Statistics for Business and Economics, 6 e © 2007 Pearson Education, Inc. Chap 19 -9
Centered Moving Averages (continued) § Let the time series have period s, where s is even number § i. e. , s = 4 for quarterly data and s = 12 for monthly data § To obtain a centered s-point moving average series Xt*: § Form the s-point moving averages § Form the centered s-point moving averages Statistics for Business and Economics, 6 e © 2007 Pearson Education, Inc. Chap 19 -10
Centered Moving Averages § Used when an even number of values is used in the moving average § Average periods of 2. 5 or 3. 5 don’t match the original periods, so we average two consecutive moving averages to get centered moving averages Average Period 4 -Quarter Moving Average Centered Period Centered Moving Average 2. 5 28. 75 3 29. 88 3. 5 31. 00 4 32. 00 4. 5 33. 00 5 34. 00 5. 5 6 36. 25 6. 5 35. 00 etc… 37. 50 7 38. 13 7. 5 38. 75 8 39. 00 8. 5 39. 25 9 40. 13 9. 5 41. 00 Statistics for Business and Economics, 6 e © 2007 Pearson Education, Inc. Chap 19 -11
Calculating the Ratio-to-Moving Average § Now estimate the seasonal impact § Divide the actual sales value by the centered moving average for that period Statistics for Business and Economics, 6 e © 2007 Pearson Education, Inc. Chap 19 -12
Calculating a Seasonal Index Quarter Sales Centered Moving Average 1 2 3 4 5 6 7 8 9 10 11 … 23 40 25 27 32 48 33 37 37 50 40 … 29. 88 32. 00 34. 00 36. 25 38. 13 39. 00 40. 13 etc… … … Ratio-to. Moving Average 83. 7 84. 4 94. 1 132. 4 86. 5 94. 9 92. 2 etc… … … Statistics for Business and Economics, 6 e © 2007 Pearson Education, Inc. Chap 19 -13
Calculating Seasonal Indexes (continued) Fall Quarter Sales Centered Moving Average 1 2 3 4 5 6 7 8 9 10 11 … 23 40 25 27 32 48 33 37 37 50 40 … 29. 88 32. 00 34. 00 36. 25 38. 13 39. 00 40. 13 etc… … … Ratio-to. Moving Average 83. 7 84. 4 94. 1 132. 4 86. 5 94. 9 92. 2 etc… … … Statistics for Business and Economics, 6 e © 2007 Pearson Education, Inc. 1. Find the median of all of the same -season values 2. Adjust so that the average over all seasons is 100 Chap 19 -14
Interpreting Seasonal Indexes § Suppose we get these seasonal indexes: Seasonal Season Index § Interpretation: Spring 0. 825 Spring sales average 82. 5% of the annual average sales Summer 1. 310 Summer sales are 31. 0% higher than the annual average sales Fall 0. 920 etc… Winter 0. 945 = 4. 000 -- four seasons, so must sum to 4 Statistics for Business and Economics, 6 e © 2007 Pearson Education, Inc. Chap 19 -15
Analytical smoothing of time series
Levels of time series are considered as the function of time
The procedure of smoothing has 3 steps Ø choice of the form of function; Ø determination of parameters of the function; Ø receiving the smoothed values of the levels of series on the basis of the function
Let’s consider this method on the example of linear trend equation where a & b – parameters; t – time
The best way to use linear trend in cases, when the preliminary investigation shows, that levels of series change with approximately the same speed, i. e. when chain absolute increases are approximately equal
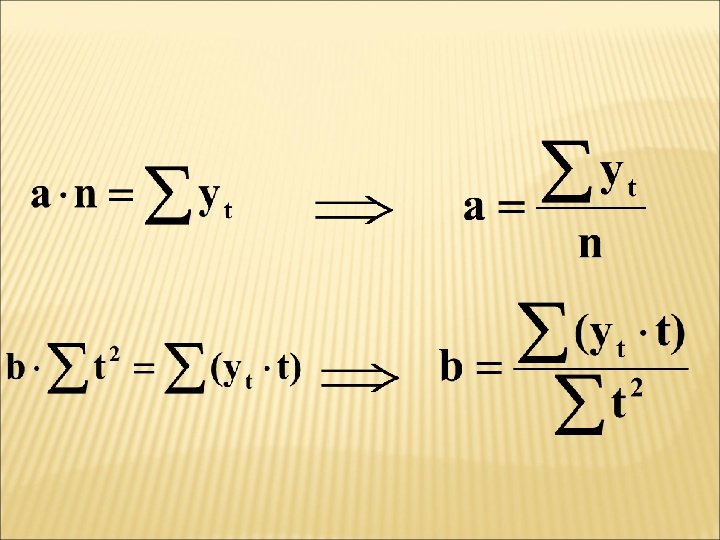
Parameters a & b are determined by the least square method LSM
The usage of LSM gives the following system of equations for determining the parameters:
The given system of equations can be significantly simplified, if we enumerate the time in the way, that
If the series contains odd number of levels, then the central level of series is enumerated as 0. Levels to the side of decrease of time are enumerated by -1; 2; -3. . . , to the side of increase of time – by 1; 2; 3. . .
If the series contains even number of levels, then the closest levels to the center are enumerated by -1 and 1, then numeration is the same as with odd number of levels but only with the step 2: . . . -5, -3, -1, +3, +5. . .
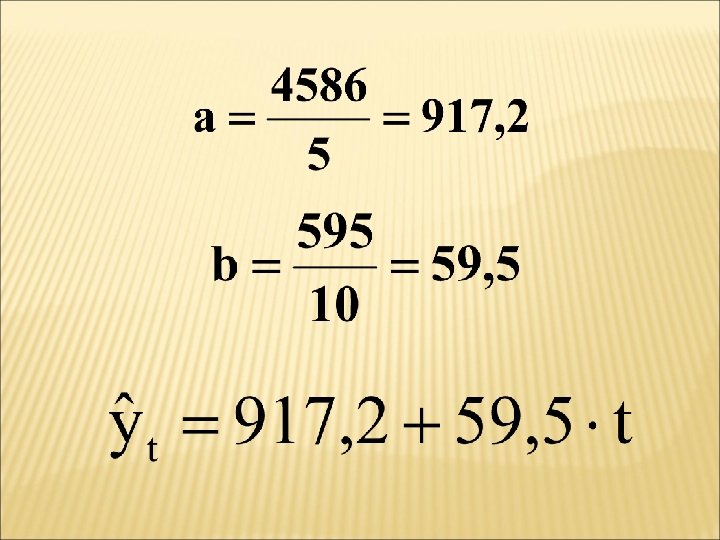
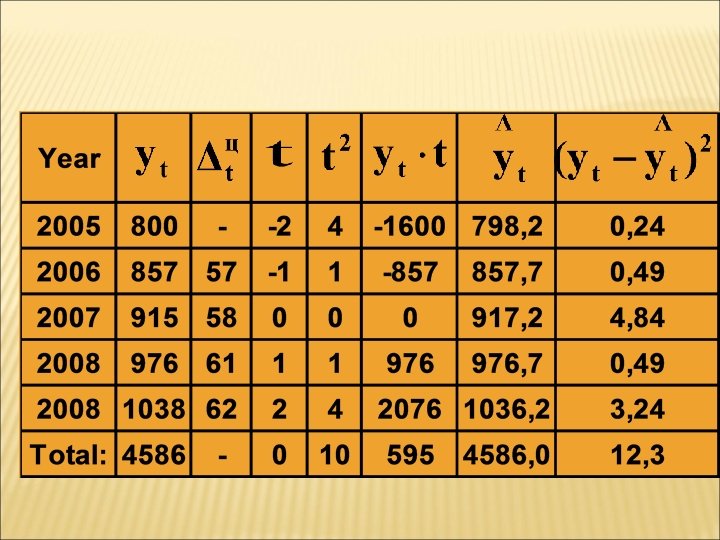
Example 17
End of Part IV § To be continued… Statistics for Business and Economics, 6 e © 2007 Pearson Education, Inc. Chap 19 -30