
Time Series for Teaching Learning and Assessment O


- Slides: 21
Time Series for Teaching, Learning and Assessment O http: //www. bloomberg. com/graphics/2015 - whats-warming-the-world/ O https: //www. youtube. com/watch? v=e 0 Gsf 1 Paq. Jk
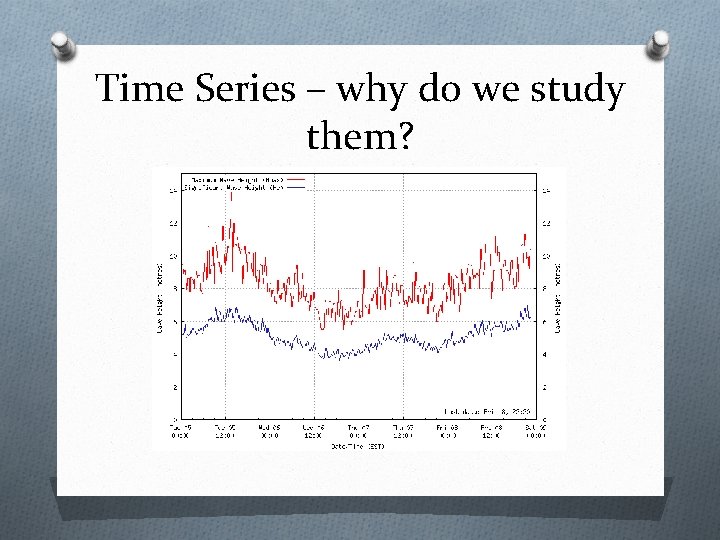
Time Series – why do we study them?
Overview v Grab everyone’s attention? v Time Series for Teaching and Learning v v v - Describe TS - What happens next? - Interpretation Description of Long Term Trend Characteristics of TS for Teaching & Learning Characteristics of TS for Assessment Results of Teacher Survey Links to TS Datasets v Any questions?
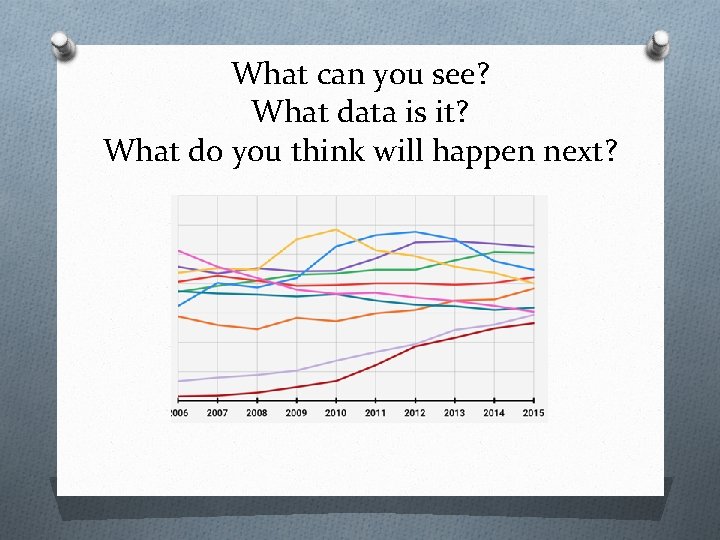
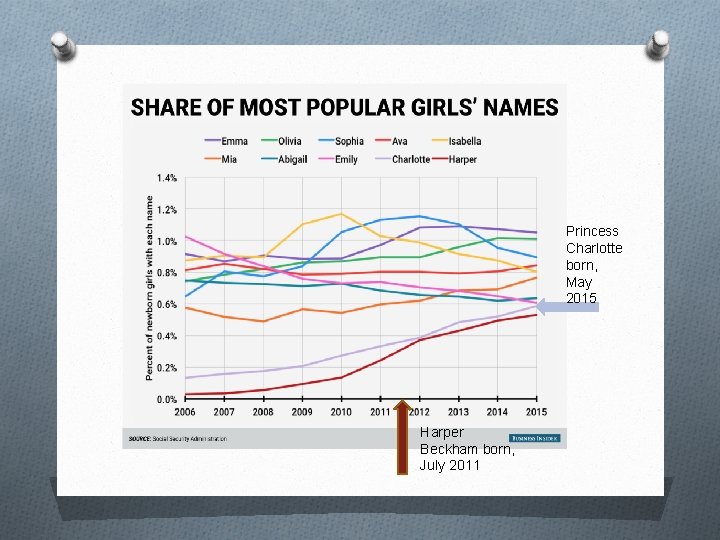
What can you see? What data is it? What do you think will happen next?
Princess Charlotte born, May 2015 Harper Beckham born, July 2011
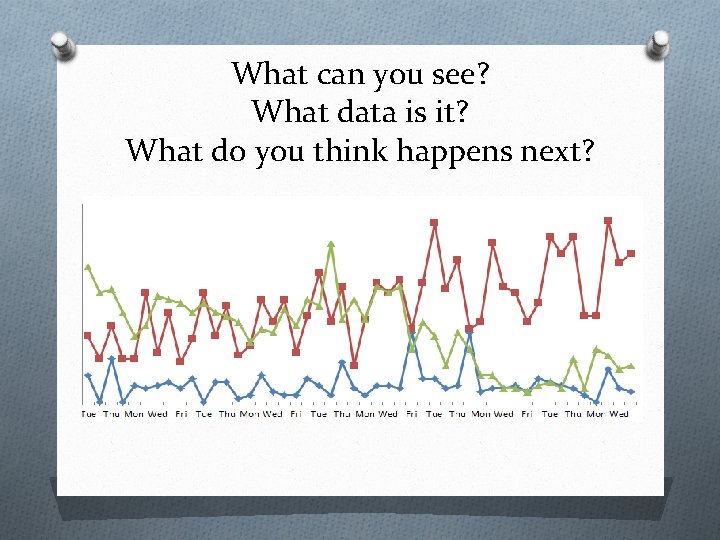
What can you see? What data is it? What do you think happens next?
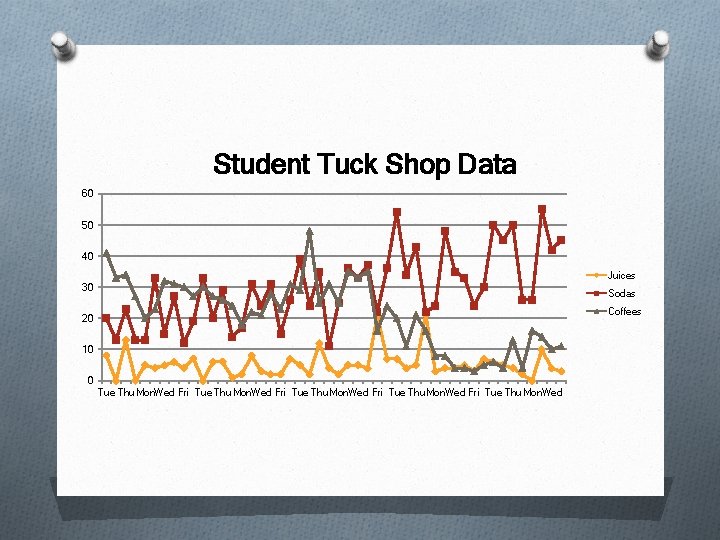
Student Tuck Shop Data 60 50 40 Juices 30 Sodas Coffees 20 10 0 Tue Thu. Mon. Wed Fri Tue Thu. Mon. Wed
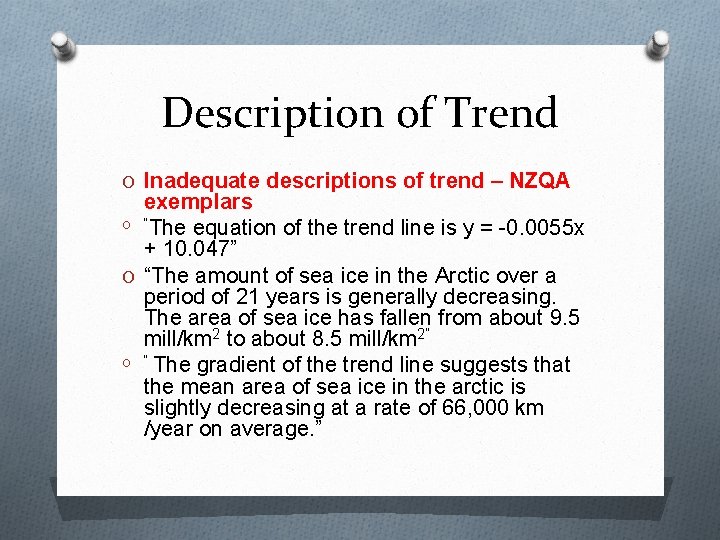
Description of Trend O Inadequate descriptions of trend – NZQA exemplars O “The equation of the trend line is y = -0. 0055 x + 10. 047” O “The amount of sea ice in the Arctic over a period of 21 years is generally decreasing. The area of sea ice has fallen from about 9. 5 mill/km 2 to about 8. 5 mill/km 2” O “ The gradient of the trend line suggests that the mean area of sea ice in the arctic is slightly decreasing at a rate of 66, 000 km /year on average. ”
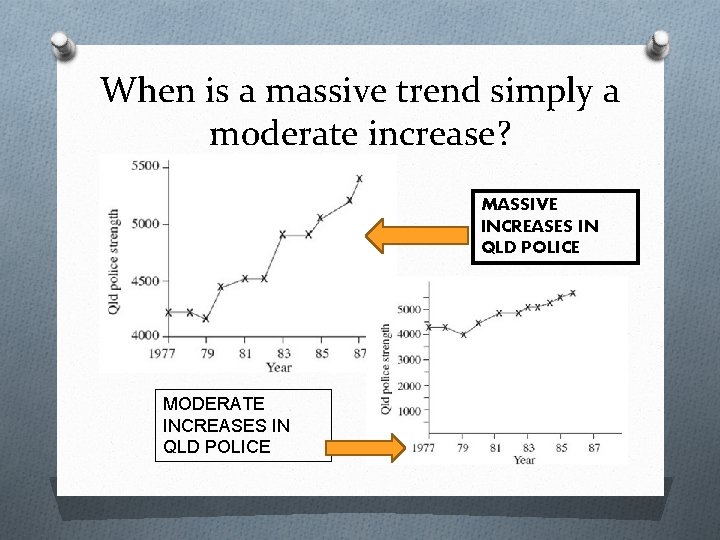
When is a massive trend simply a moderate increase? MASSIVE INCREASES IN QLD POLICE MODERATE INCREASES IN QLD POLICE
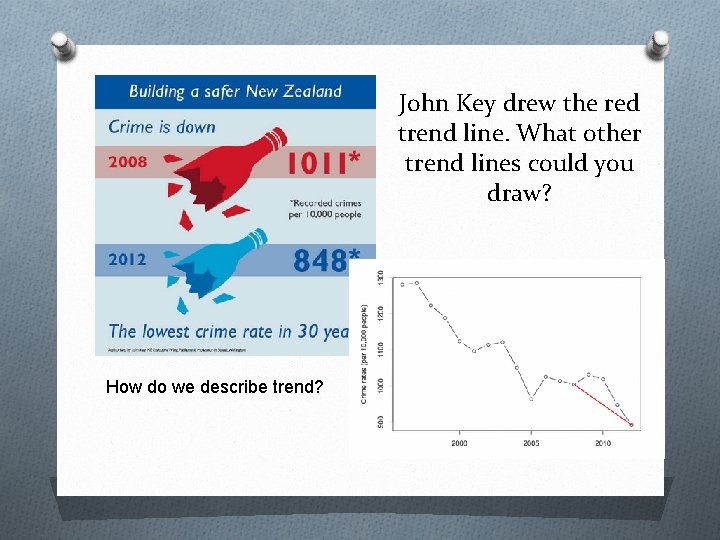
John Key drew the red trend line. What other trend lines could you draw? How do we describe trend?
Trend – how many pieces? O Students should comment on changes in behaviour that last for a sustained time period. The length of the sustained period is a subjective decision and needs to take account of the length of the seasonal cycle and the number of data values available. O http: //new. censusatschool. org. nz/resource/describing- the-trend-in-a-time-series/ O worksheet
Results from Teacher Survey O Most useful professional development O O O O O End of Year Stats Days ! Least useful professional development Self study Most useful textbook None! Most commonly used software for TS i. NZight, only 1 school still used EXCEL Moderation feedback Unhelpful Mode of assessment all but one moved to out of class project-style assessment.
Teachers’ Perceptions O Dislike black box nature of i. NZight O Felt i. NZight detrimental to student understanding of time series O Marking of TS internal too onerous
SUGGESTIONS O Before using i. NZight do introduce students to the idea of smoothing. Smoothing worksheet available with LA rain data. O Research has shown that hands-on activities introduced prior to new software helps student understanding O Provide a page limit for assessments, the standard does not require 25 pages! Some schools have used alternative forms of assessment e. g. presentation or poster.
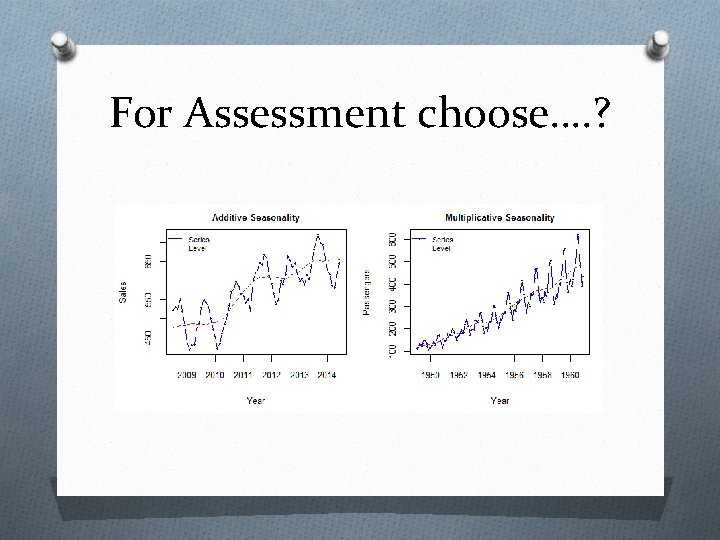
Time Series for……… O Teaching & Learning O Assessment O Begin with engaging O Contexts that can be contexts O Seasonal/Non seasonal O Examine all types of trends – linear, nonlinear, ramps, unusual values O Use additive & multiplicative models O O researched Stable seasonal pattern Linear long term trend Trend can be in several pieces Use additive models
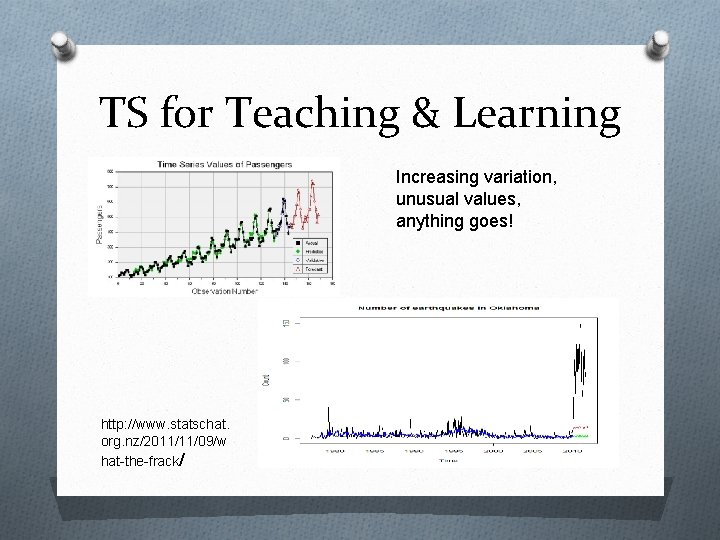
TS for Teaching & Learning Increasing variation, unusual values, anything goes! http: //www. statschat. org. nz/2011/11/09/w hat-the-frack/
For Assessment choose…. ?
Sources for TS data sets O Important to find contexts that engage your students. O Start with familiar contextswith little research required and work towards unfamiliar contexts requiring more research. O List of websites on back page of hand-out
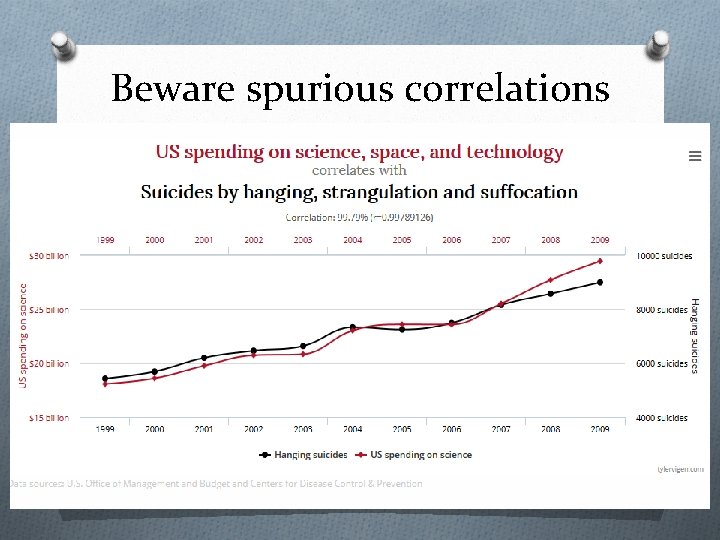
Beware spurious correlations
http: //www. greatmathsteachingideas. com
Thanks for listening