Time Series Analysis midterm report 20100421 R 98229016


")
")
=(1, 4)時有最小的AIC 得到ARMA model的係數為 A(q) = 1 -")

- Slides: 13
Time Series Analysis midterm report 2010/04/21 大氣所碩一 闕珮羽 R 98229016
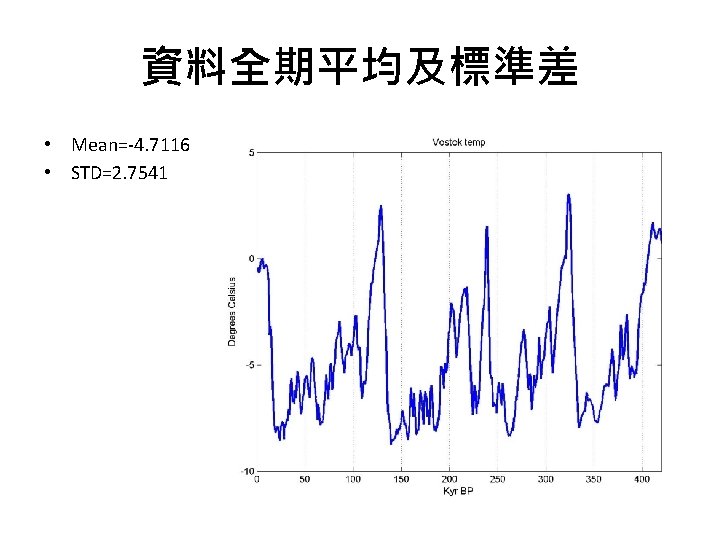
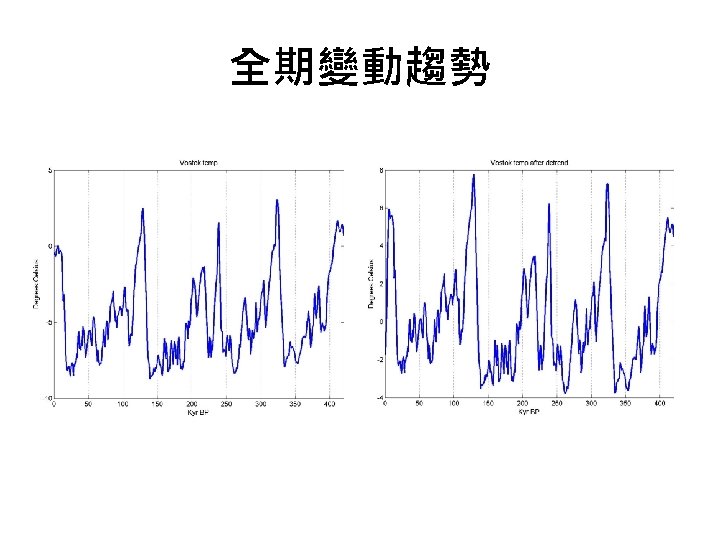
Data • Vostok : Petit J. R. et al. , Climate and Atmospheric History of the Past 420, 000 years from the Vostok Ice Core, Antarctica, Nature, 399, pp. 429 -436.
某兩段的值 Mean= -5. 1172 Std= 2. 5399 Mean= -5. 6417 Std= 2. 4169
兩段時間平均數差異統計檢定 • 利用t test 去做檢定,查詢 matlab 的 function • H = TTEST 2(X, Y) performs a T-test of the hypothesis that two independent samples, in the vectors X and Y, come from distributions with equal means, and returns the result of the test in H. H=0 indicates that the null hypothesis ("means are equal") cannot be rejected at the 5% significance level. H=1 indicates that the null hypothesis can be rejected at the 5% level. The data are assumed to come from normal distributions with unknown, but equal, variances. X and Y can have different lengths. • 利用我取的兩段時間做出來 H = TTEST 2(TS 1, TS 2)=0 • 所以表示 the null hypothesis cannot be rejected at the 5% level
兩段時間變異數差異檢定 • 利用F test 去做檢定,查詢 matlab 的 function • H = VARTEST 2(X, Y) performs an F test of the hypothesis that two independent samples, in the vectors X and Y, come from normal distributions with the same variance, against the alternative that they come from normal distributions with different variances. The result is H=0 if the null hypothesis ("variances are equal") cannot be rejected at the 5% significance level, or H=1 if the null hypothesis can be rejected at the 5% level. X and Y can have different lengths. • 利用我取的兩段時間做出來 F = VARTEST 2(TS 1, TS 2)=0 • 所以表示 the null hypothesis cannot be rejected at the 5% level
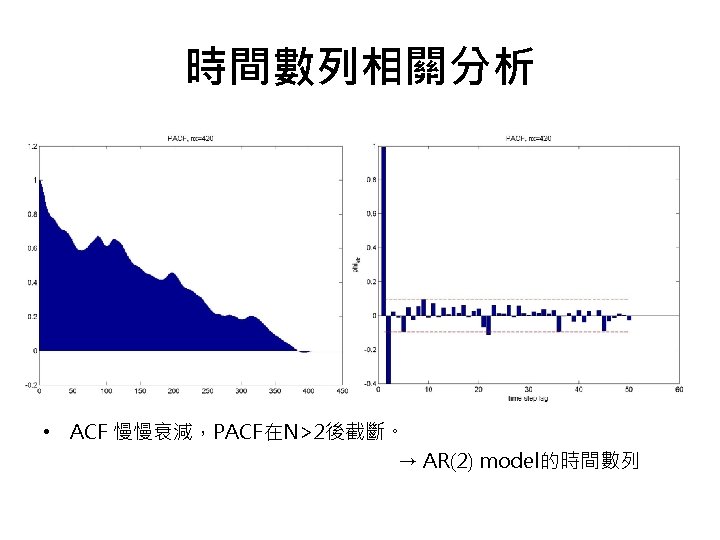
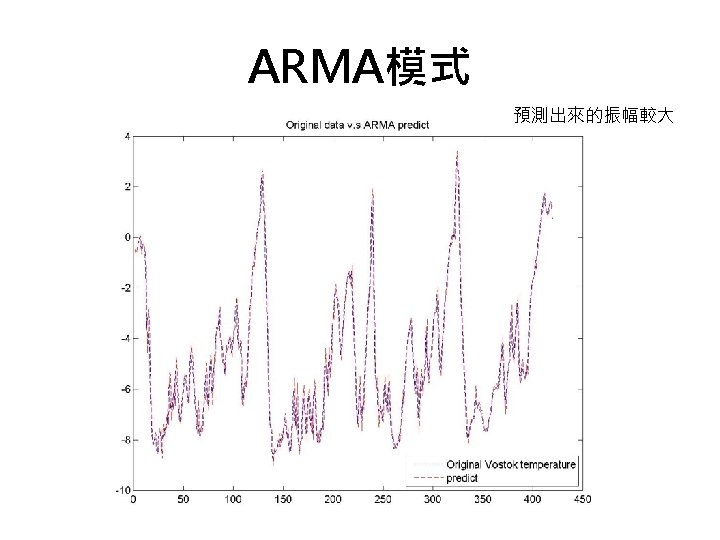
建立時間數列的ARMA模式 • • 利用ARMA model (p, q)=(1, 4)時有最小的AIC 得到ARMA model的係數為 A(q) = 1 - 0. 9819 q^-1 C(q) = 1 + 0. 4214 q^-1 + 0. 1409 q^-2 + 0. 01416 q^-3 + 0. 01416 q^-4
ARMA模式