Tides Notes Tide Vocab n Tide Daily rise

Tides Notes

Tide Vocab n Tide - Daily rise and fall of sea level along the coast, caused by gravitational attraction of Sun, Moon, and Earth Which has more effect on tides – the sun or the moon? n Why? n

Ebb and Flow of Tides n n n High tide – the tide is at its highest point Low tide – the tide is at its lowest point Tidal range – the vertical difference between high tide and low tide

Ebb and Flow of Tides n n n As the tide is rising, or increasing in height, the tide is a flood tide. As the tide is falling, or decreasing in height, the tide is an ebb tide. “Slack water” is the period when there is no water movement (between ebb & flood tides)

Tides are waves! n n Tides are very long and regular shallowwater waves Parts of a wave & tides Crest = high tide n Trough = low tide n Wave Height = tidal range n Wavelength = ½ circumference of the Earth! (about 20, 000 km) n n Why are tides ALWAYS considered shallow water waves?

Moon n n Gravity from the moon “pulls” ocean waters towards it. On the opposite side of Earth, inertia from the earthmoon rotation “flings” water away from the earth. n Inertia - the resistance of any physical object to a change in its state of motion (centrifugal force)

Moon n This causes 2 bulges of water on earth which are high tides (one bulge faces Moon, other bulge on opposite side of Earth) n n The areas between the bulges are low tides. n n What part of the wave are the high tides? What part of the wave are the low tides? The earth rotates under these bulges.

Check for Understanding: n n Draw a picture of the Earth and Moon. Draw in the two tidal bulges. Draw arrows showing which way the water is being pulled & label what causes each bulge. Label high tides and low tides. Moon’s gravity Inertia Earth

The Equilibrium Theory of Tides http: //en. wikipe dia. org/wiki/Tide http: //kingfish. coastal. edu/m arine/Animations/Tides 1. html http: //www. wiley. com/colle ge/strahler/0471480533/ani mations/ch 19_animations/a nimation 3. html

Check for Understanding: n High and Low Tides

CHAPTER 11 Tides

Solar Day vs. Lunar Day n Solar Day = time it takes for Earth to rotate once on its axis n n How many hours does this take? Lunar Day = time it takes the moon to make one complete orbit around Earth & come back to the same phase n n Moon orbits Earth as Earth rotates Earth needs time to “catch up” to moon’s new location

Lunar Day n n 24 hours 50 minutes for observer to see subsequent Moons directly overhead Tidal bulges are lined up with the moon (one facing the moon & once on the opposite side of the Earth from the moon) Fig. 9. 7

Lunar Day n n How far apart are high tides? How long is it from high tide to the next low tide? Fig. 9. 7

Sun n Has about ½ the power of the pull of the moon n Why? (which is bigger? Which is closer? ) Produces tidal bulges similar to lunar bulges but much smaller The sun’s influence can add to or subtract from the lunar tide.

Spring Tide n n Occurs during the new moon and full moon. The Earth, moon, and sun are all in a straight line n n Gravity of sun & moon working together to create a very strong gravitational pull on earth. Tides of maximum height and depression n High tide is higher than average and low tide is lower than average (big tidal range).

Neap Tide n n Occurs when the moon is in its 1 st or 3 rd quarter. Moon is located at right angles to the sun and earth. n n Gravity of Moon & sun is pulling in different directions Low amplitude tides. n High tide is lower than average and low tide is higher than average (small tidal range).

n n Sketch the sun, earth and moon during a spring tide. Sketch the sun, earth and moon during a neap tide.

Earth-Moon-Sun positions and spring and neap tides http: //oceans ervice. noaa. g ov/education/ kits/tides/me dia/supp_tide 06 a. html

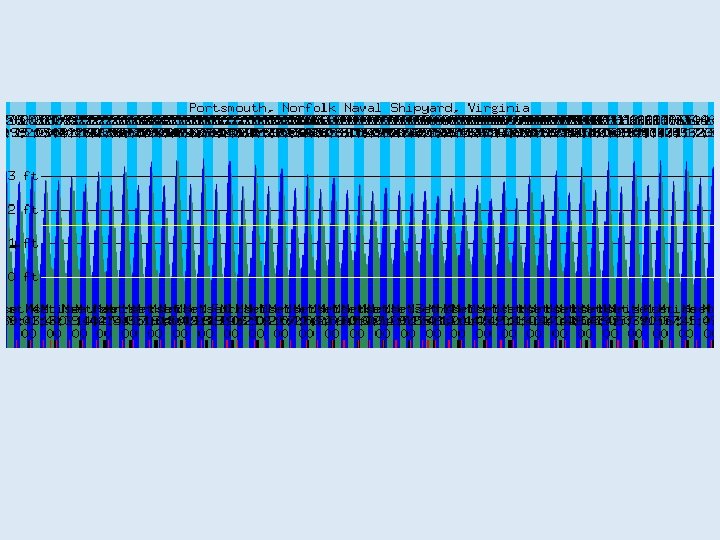
n These two tide graphs are for the same location. Which one is the spring tide, and which one is the neap tide?

n Types of tides

Idealized tide prediction n In an ideal world the Earth would be uniformly covered by ocean, n which would produce two identical tidal bulges (one on either side of the earth) n n Two identical high tides and two identical low tides per lunar day (A little over six hours between high and low tides)

Real tides n n n Earth not covered completely by ocean Continents and friction with seafloor modify tidal bulges Shape of coastline modifies tidal bulges n n Can amplify tidal range (Bay of Fundi) Water depth modifies tidal bulges n Tides are shallow water waves with speed determined by depth of water

Real tides n The Earth is not always the same distance from the sun and moon Perihelion/Perigee – closest point n Aphelion/Apogee – farthest point n

Real tides n n Tidal range greatest at perihelion and perigee…WHY? Tidal range least at aphelion and apogee…WHY?

Real tides n The sun and moon are not exactly in line with the Earth’s equator Shifts the location of the tidal bulges (not in line with the equator) n Results in unequal tides n

What affects “real” tides? n In your own words, summarize/list the 7 things that can affect real tides

What affects “real” tides? n n n n Earth not uniformly covered by ocean Continents Friction with ocean floor Shape of coastline Water depth Earth not always same distance from moon Moon not in line with Earth’s equator

Tidal patterns n Because of these conditions in the “Real World, ” we have three different tidal patterns: Diurnal n One high tide/one low tide per day n Semidiurnal n Two high tides/two low tides per day n Tidal range about same (equal height) n Mixed n Two high tides/two low tides per day n Tidal range different (not same heights) n Most common n

Tidal Patterns n Each of the tidal graphs below shows two days of tidal data. Label each of the graphs as diurnal, semidiurnal, or mixed © 2002 Brooks/Cole, a division of Thomson Learning, Inc.

The Dynamic Theory of Tides Semidiurnal: East Coast Diurnal: Gulf Coast Mixed: West Coast © 2002 Brooks/Cole, a division of Thomson Learning, Inc.

The Dynamic Theory of Tides The worldwide distribution of the three tidal patterns. © 2002 Brooks/Cole, a division of Thomson Learning, Inc.

Tides Foldable n n n Fold paper in half lengthwise With paper folded, fold again into thirds With crease at top, cut the top flap along the folds, creating three doors Label the doors: diurnal, semidiurnal, mixed Lift the flap. On the top, draw a picture of that type of tide n On the bottom, write a definition of that type of tide n


Tides in coastal waters n Standing waves n Tide waves reflected by coast n Amplification of tidal range n Example, Bay of Fundy maximum tidal range 17 m (56 ft)

Tides in coastal waters n n Tidal bore – a high, often breaking wave generated by a tide crest that advances rapidly up an estuary or river. The tidal range is very extreme: a difference of 8 m in some places.

Tides in coastal waters n Tidal bore

n Tidal bore – Bay of Fundy

Coastal tidal currents n Whirlpool n Rapidly spinning seawater n Restricted channel connecting two basins with different tidal cycles Fig. 9. 19

Tides and marine life n n Fig. 9 C Tide pools and life Grunion spawning

Tide-generated power n Advantages n n n Renewable resource Low operating cost Source of power is free No CO 2 emissions Disadvantages n n Not enough power to meet world needs High maintenance, storm damage Does not produce power on demand Possible harmful environmental effects

n n Diurnal inequality The difference in height of the two high waters or of the two low waters of each tidal day; also, the difference in speed between the two flood tidal currents or the two ebb currents of each tidal day. The difference changes with the declination of the Moon and, to a lesser extent, with the declination of the Sun. In general, the inequality tends to increase with increasing declination, either north or south, and to diminish as the Moon approaches the Equator. Mean diurnal high water inequality (DHQ) is one-half the average difference between the two high waters of each tidal day observed over the National Tidal Datum Epoch. It is obtained by subtracting the mean of all the high waters from the mean of the higher high waters. Mean diurnal low water inequality (DLQ) is one-half the average difference between the two low waters of each tidal day observed over the National Tidal Datum Epoch. It is obtained by subtracting the mean of the lower low waters from the mean of all the low waters. Tropic high water inequality (HWQ) is the average difference between the two high waters of each tidal day at the times of tropic tides. Tropic low water inequality (LWQ) is the average difference between the two low waters of each tidal day at the times of tropic tides. Mean and tropic inequalities, as defined above, are applicable only when the type of tide is either semidiurnal or mixed. Diurnal inequality is sometimes called declinational inequality.

Tidal Prediction n n Scientists use 19 years of Sun, Moon, & Earth data to predict tidal levels all over the world. NOAA started this endeavor and recently turned it over to a private company.

Gravitational forces n n n Every particle attracts every other particle Gravitational force proportional to product of masses Inversely proportional to square of separation distance Fig. 9. 2
 n n Small horizontal forces push seawater into two bulges Opposite")
Tidal bulges (lunar) n n Small horizontal forces push seawater into two bulges Opposite sides of Earth One bulge faces Moon Other bulge opposite side Fig. 9. 6 Earth

Real tides n Tidal cells rotate around amphidromic point (a point within a tidal system where the tidal range is almost zero; no vertical water movement)

Other complicating factors: declination n Declination - Angular distance of Moon or Sun above or below Earth’s equator n Sun to Earth: 23. 5 o N or S of equator (tilt of Earth’s axis) n Moon to Earth: 28. 5 o N or S of equator Fig. 9. 11
 Fig. 9. 13")
Declination and tides n Unequal tides (unequal tidal ranges) Fig. 9. 13

Other complicating factors: elliptical orbits n n Perihelion – Earth is at its closest point to the sun (January) Perigee – Moon is at its closest point to Earth

Other complicating factors: elliptical orbits Aphelion - Earth is at its farthest point from the sun (July) n Apogee - Moon is at its farthest point from the Earth • Perigee and apogee cycle 27. 5 days • Perihelion and aphelion cycle 365 days n
- Slides: 51