Three way ANOVA Example Popcorn Data Set Popcorn


- Slides: 16
Three way ANOVA Example Popcorn!!!
Data Set Popcorn Oil amt. Batch Yield plain little large 8. 2 gourmet little large 8. 6 plain lots large 10. 4 gourmet lots large 9. 2 plain little small 9. 9 gourmet little small 12. 1 plain lots small 10. 6 gourmet lots small 18. 0 plain little large 8. 8 gourmet little large 8. 2 plain lots large 8. 8 gourmet lots large 9. 8 plain little small 10. 1 gourmet little small 15. 9 plain lots small 7. 4 gourmet lots small 16. 0
Popcorn Example Layout
ANOVA Table Source DF Sum of Squares F Ratio Prob > F popcorn 1 34. 81 17. 31 0. 0032* oil amt 1 4. 41 2. 19 0. 1768 batch 1 49. 00 24. 37 0. 0011* batch *popcorn 1 37. 21 18. 51 0. 0026* batch *oil amt 1 0. 0050 0. 9455 popcorn*oil amt 1 4. 00 1. 9900 0. 1960 popcorn*oil amt*batch 1 4. 00 1. 9900 0. 1960
Popcorn Type �Level Least Sq Mean Std Error Mean �gourmet 12. 22 0. 5012 12. 2250 �plain 9. 275000 0. 5012 9. 2750
Batch Size �Level Least Sq Mean Std Error �large �small 9. 000000 12. 500000 0. 50124844 Mean 9. 0000 12. 5000
Popcorn*Batch Interaction Plot
How to Test Interaction Means Recode Popcorn*Batch as Trt, i. e. Trt=1 is Plain, Small Trt=2 is Plain, Large Trt=3 is Gourmet, Small Trt=4 is Gourmet, Large
New ANOVA Table Source Trt DF 3 oil amt 1 Trt*oil amt 3 SS F Ratio Prob > F 121. 02000 20. 0697 0. 0004* 4. 41000 8. 01000 2. 1940 0. 1768 1. 3284 0. 3314
Plot of Means with SD
Tukey Test of Interaction Means �Level � 3 Least Sq Mean A 15. 500000 � 1 B 9. 500000 � 2 B 9. 050000 � 4 B 8. 950000 �Levels not connected by same letter are significantly different.
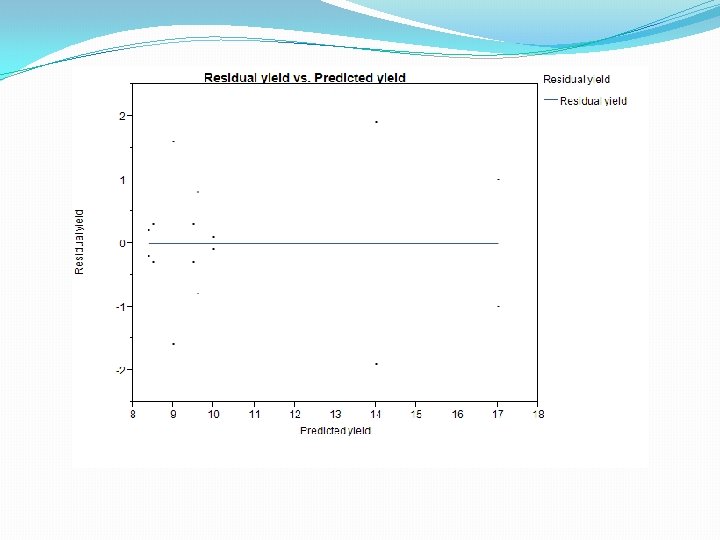
Plot of Residuals
Normal Plot of Residuals
Test of Normality �Goodness-of-Fit Test � Shapiro-Wilk W Test �W � 0. 976987 Prob<W 0. 9352 �Note: Ho = The data is from the Normal distribution. Small p-values reject Ho.
Box-Cox Plot