
Thoughts on Big Data Dr Carey Schwartz Program
Thoughts on Big Data Dr. Carey Schwartz Program Manager DARPA I 2 O University of Central Florida 26 November 2018

BLUF ● השמש אין כל חדש תחת - there is nothing new under the sun – Ecclesiastes 1: 9 2
Insomnia 6 What Keeps me up at Night Overarching Problems: 1. Find the information bearing component of a high dimensional signal 2. Find regularities in the data that enable warfighters to successfully complete their mission in a dynamic world within the timeline of the mission Where we need scientific and technical advances so that I can sleep at night 1. Representations 2. Data Alignment 3. Treating Processing and Analysis as a SYSTEM 4. Numerical methods including scaling and stability 5. Methods that address uncertain, incomplete, imprecise, and contradictory data 6. Analytics including imagery (all modalities), text, and graphs One Approach – “Big Data”
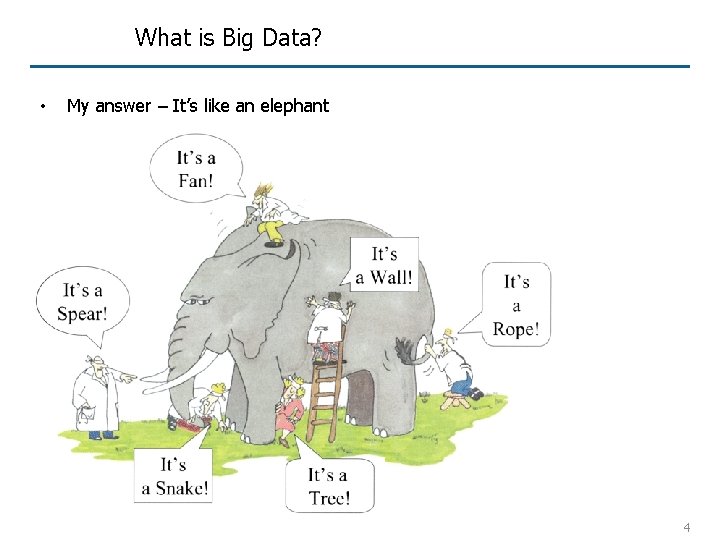
What is Big Data? • My answer – It’s like an elephant 4
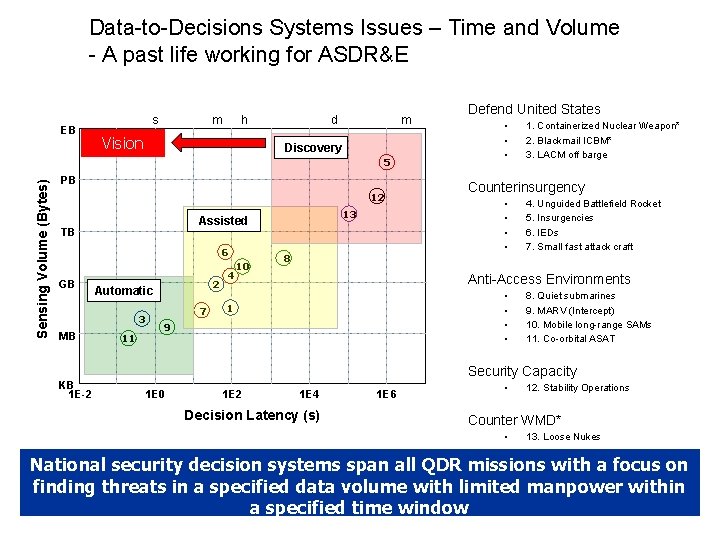
Data-to-Decisions Systems Issues – Time and Volume - A past life working for ASDR&E EB m s h Vision m d Discovery Sensing Volume (Bytes) 5 PB 12 Assisted TB 6 GB KB 1 E-2 2 Automatic 3 MB 13 11 7 4 10 8 Defend United States • • • 1. Containerized Nuclear Weapon* 2. Blackmail ICBM* 3. LACM off barge Counterinsurgency • • 4. Unguided Battlefield Rocket 5. Insurgencies 6. IEDs 7. Small fast attack craft Anti-Access Environments • • 1 9 8. Quiet submarines 9. MARV (Intercept) 10. Mobile long-range SAMs 11. Co-orbital ASAT Security Capacity 1 E 0 1 E 2 1 E 4 Decision Latency (s) 1 E 6 • 12. Stability Operations Counter WMD* • 13. Loose Nukes National security decision systems span all QDR missions with a focus on finding threats in a specified data volume with limited manpower within a specified time window
Big Data – It’s about the size of the data • Big Data is defined in the context of the storage medium • Human Brain – Homer’s Illiad (15693 lines) and Odyssey (12, 110 lines), Beowulf (3182 lines) Cuneiform Code of Hammurabi (basalt stele 2. 25 m tall) Hieroglyphics – Book of the Dead (papyrus ~ 0. 2 m x ~20 m) Digital Storage - DVD – (12 cm) • • Trajectory is towards more and denser storage media – but is more data better? 6
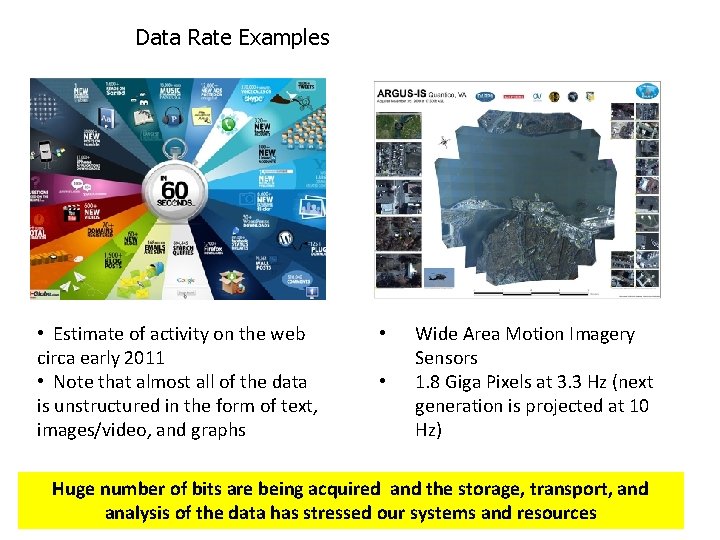
Data Rate Examples • Estimate of activity on the web circa early 2011 • Note that almost all of the data is unstructured in the form of text, images/video, and graphs • • Wide Area Motion Imagery Sensors 1. 8 Giga Pixels at 3. 3 Hz (next generation is projected at 10 Hz) Huge number of bits are being acquired and the storage, transport, and analysis of the data has stressed our systems and resources
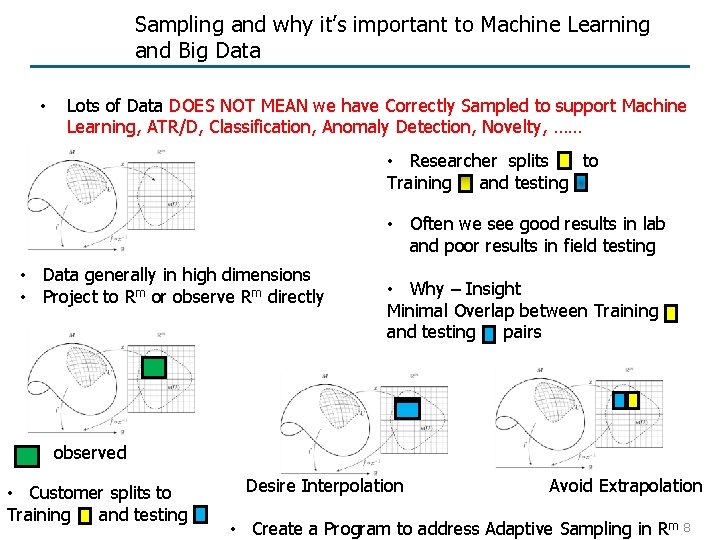
Sampling and why it’s important to Machine Learning and Big Data • Lots of Data DOES NOT MEAN we have Correctly Sampled to support Machine Learning, ATR/D, Classification, Anomaly Detection, Novelty, …… • Researcher splits to Training and testing • Often we see good results in lab and poor results in field testing • Data generally in high dimensions • Project to Rm or observe Rm directly • Why – Insight Minimal Overlap between Training and testing pairs observed • Customer splits to Training and testing Desire Interpolation Avoid Extrapolation • Create a Program to address Adaptive Sampling in Rm 8
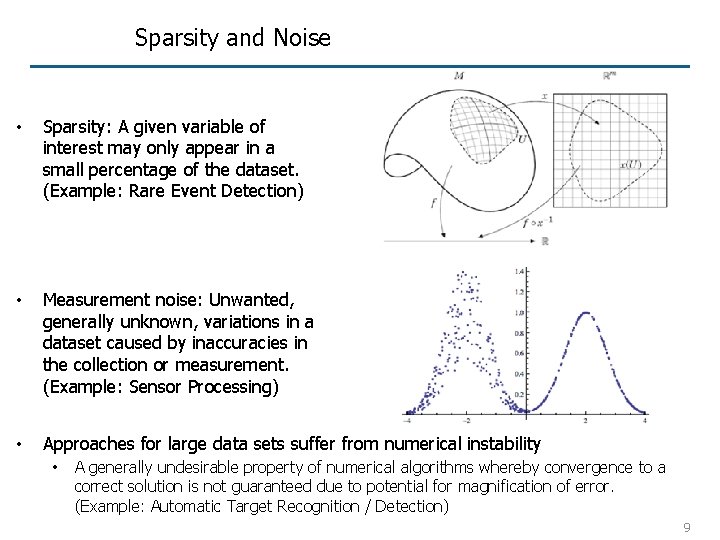
Sparsity and Noise • Sparsity: A given variable of interest may only appear in a small percentage of the dataset. (Example: Rare Event Detection) • Measurement noise: Unwanted, generally unknown, variations in a dataset caused by inaccuracies in the collection or measurement. (Example: Sensor Processing) • Approaches for large data sets suffer from numerical instability • A generally undesirable property of numerical algorithms whereby convergence to a correct solution is not guaranteed due to potential for magnification of error. (Example: Automatic Target Recognition / Detection) 9
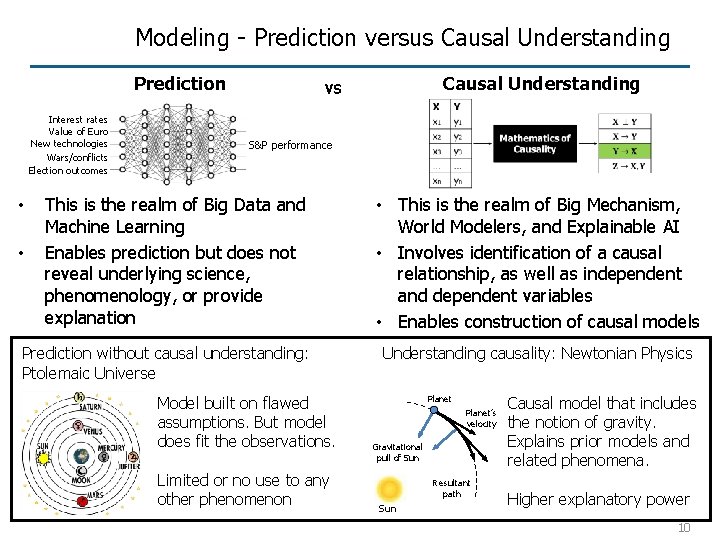
Modeling - Prediction versus Causal Understanding Prediction Interest rates Value of Euro New technologies Wars/conflicts Election outcomes • • Causal Understanding vs S&P performance This is the realm of Big Data and Machine Learning Enables prediction but does not reveal underlying science, phenomenology, or provide explanation Prediction without causal understanding: Ptolemaic Universe Model built on flawed assumptions. But model does fit the observations. Limited or no use to any other phenomenon • This is the realm of Big Mechanism, World Modelers, and Explainable AI • Involves identification of a causal relationship, as well as independent and dependent variables • Enables construction of causal models Understanding causality: Newtonian Physics Planet’s velocity Gravitational pull of Sun Resultant path Sun Causal model that includes the notion of gravity. Explains prior models and related phenomena. Higher explanatory power 10
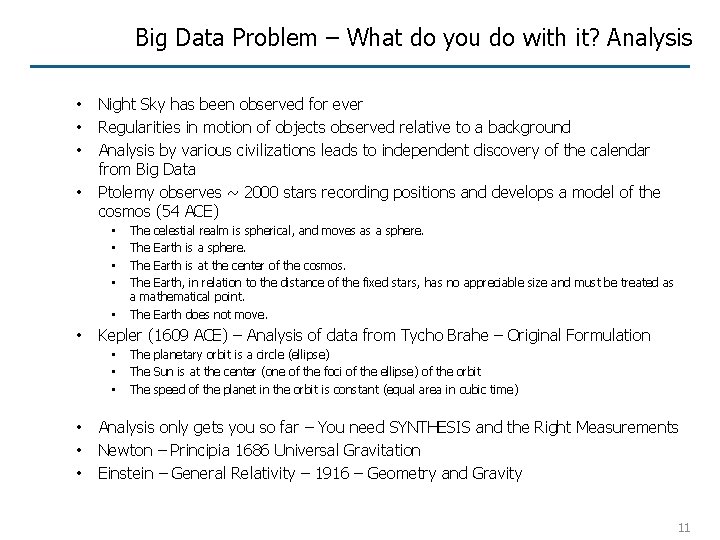
Big Data Problem – What do you do with it? Analysis • • Night Sky has been observed for ever Regularities in motion of objects observed relative to a background Analysis by various civilizations leads to independent discovery of the calendar from Big Data Ptolemy observes ~ 2000 stars recording positions and develops a model of the cosmos (54 ACE) • • • Kepler (1609 ACE) – Analysis of data from Tycho Brahe – Original Formulation • • • The celestial realm is spherical, and moves as a sphere. The Earth is at the center of the cosmos. The Earth, in relation to the distance of the fixed stars, has no appreciable size and must be treated as a mathematical point. The Earth does not move. The planetary orbit is a circle (ellipse) The Sun is at the center (one of the foci of the ellipse) of the orbit The speed of the planet in the orbit is constant (equal area in cubic time) Analysis only gets you so far – You need SYNTHESIS and the Right Measurements Newton – Principia 1686 Universal Gravitation Einstein – General Relativity – 1916 – Geometry and Gravity 11
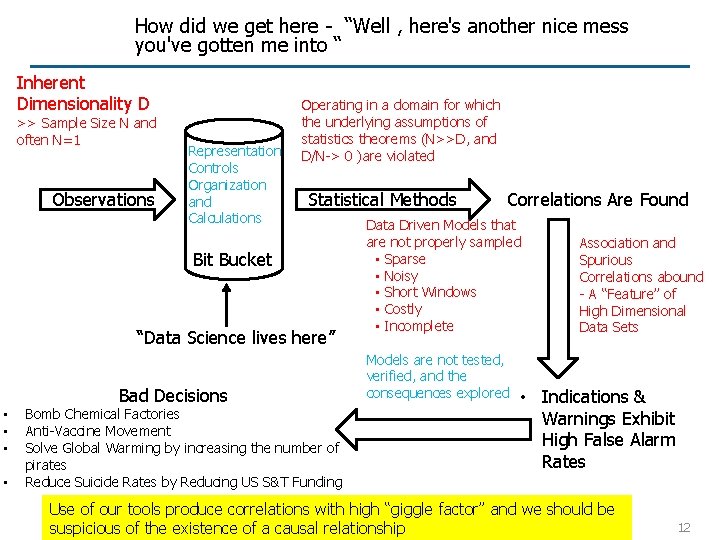
How did we get here - “Well , here's another nice mess you've gotten me into “ Inherent Dimensionality D >> Sample Size N and often N=1 Observations Representation Controls Organization and Calculations Operating in a domain for which the underlying assumptions of statistics theorems (N>>D, and D/N-> 0 )are violated Statistical Methods Bit Bucket “Data Science lives here” Bad Decisions • • Bomb Chemical Factories Anti-Vaccine Movement Solve Global Warming by increasing the number of pirates Reduce Suicide Rates by Reducing US S&T Funding Correlations Are Found Data Driven Models that are not properly sampled • Sparse • Noisy • Short Windows • Costly • Incomplete Models are not tested, verified, and the consequences explored Association and Spurious Correlations abound - A “Feature” of High Dimensional Data Sets • Indications & Warnings Exhibit High False Alarm Rates Use of our tools produce correlations with high “giggle factor” and we should be Statement suspicious of the existence of a causal. Distribution relationship 12
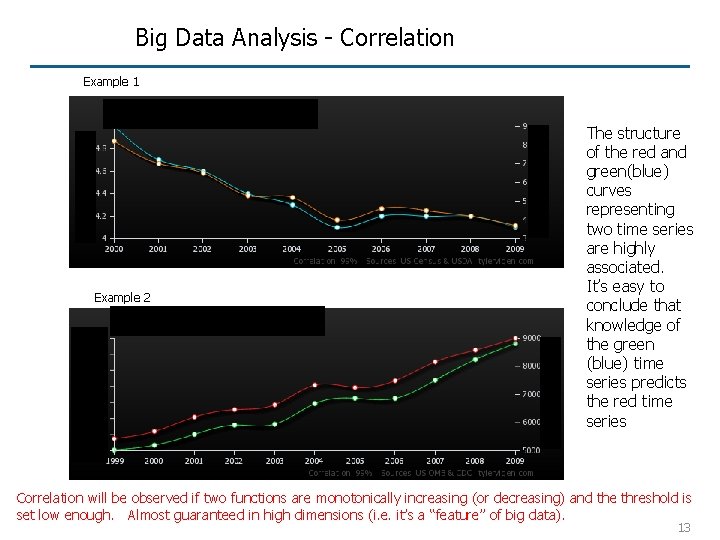
Big Data Analysis - Correlation Example 1 Example 2 The structure of the red and green(blue) curves representing two time series are highly associated. It’s easy to conclude that knowledge of the green (blue) time series predicts the red time series Correlation will be observed if two functions are monotonically increasing (or decreasing) and the threshold is set low enough. Almost guaranteed in high dimensions (i. e. it’s a “feature” of big data). 13
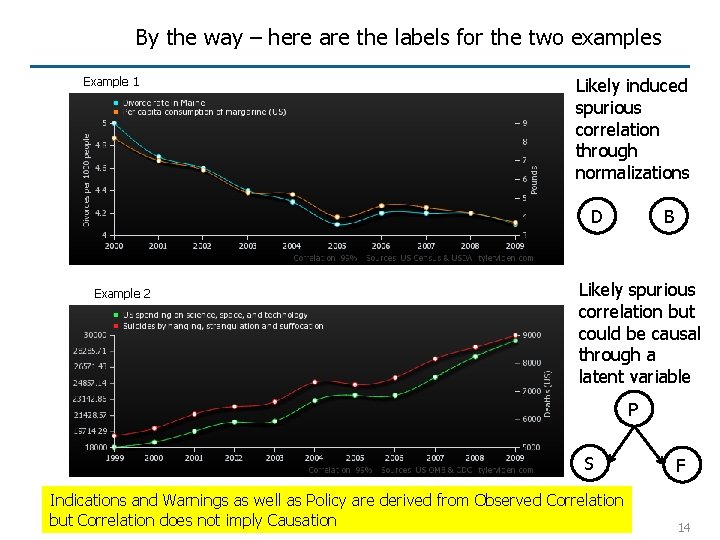
By the way – here are the labels for the two examples Example 1 Likely induced spurious correlation through normalizations D Example 2 B Likely spurious correlation but could be causal through a latent variable P S Indications and Warnings as well as Policy are derived from Observed Correlation but Correlation does not imply Causation Distribution Statement F 14
Analysis • Statistics as practiced by “Data Scientists” • • • Methods are inappropriate relative to assumptions about the method Not correctly sampled CS Observation • Data Scientist – “We don’t need no stinkin expertise or collaborations with experts, look at what I found” - Abusing dialogue from the “Treasure of Sierra Madre”, “The Monkees”, and “Blazing Saddles” • Statistician – Talks to domain experts and asks – “look at what I found, is it real, meaningful, and significant” • Machine Learning of {x, y} • • Do we learn y=f(x) or x=g(y) How many points do we need to support the learning method? How many positive and negative examples are required? Did we sample the manifold? 15
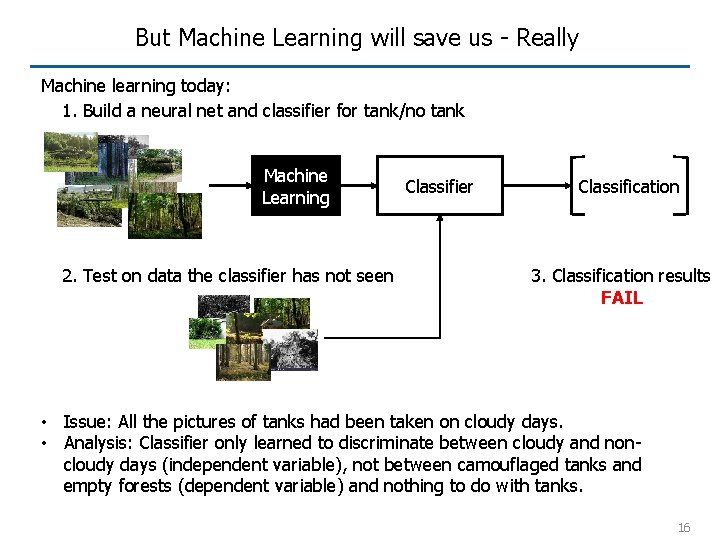
But Machine Learning will save us - Really Machine learning today: 1. Build a neural net and classifier for tank/no tank Machine Learning 2. Test on data the classifier has not seen Classifier Classification 3. Classification results FAIL • Issue: All the pictures of tanks had been taken on cloudy days. • Analysis: Classifier only learned to discriminate between cloudy and noncloudy days (independent variable), not between camouflaged tanks and empty forests (dependent variable) and nothing to do with tanks. 16
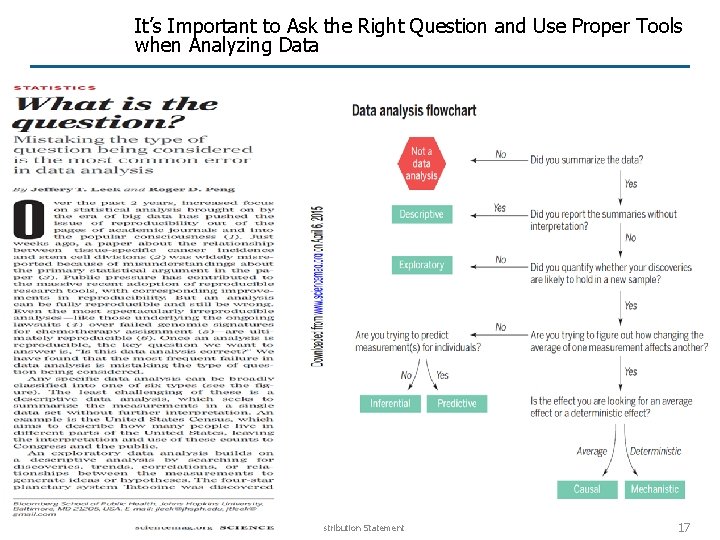
It’s Important to Ask the Right Question and Use Proper Tools when Analyzing Data Distribution Statement 17
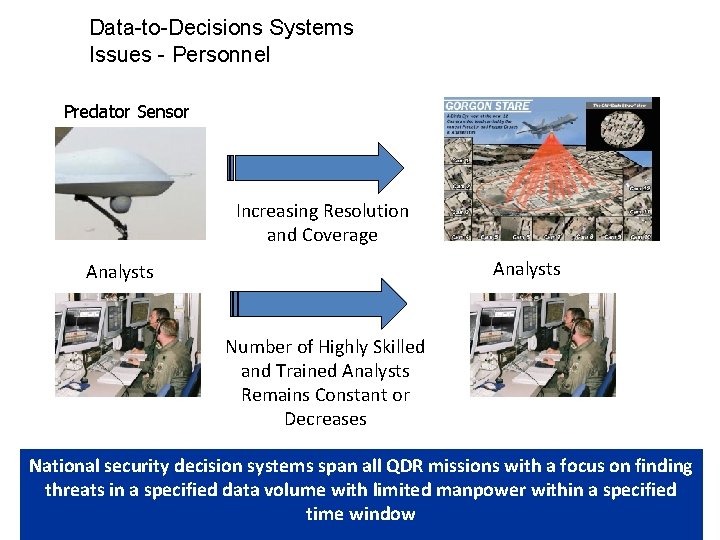
Data-to-Decisions Systems Issues - Personnel Predator Sensor Increasing Resolution and Coverage Analysts Number of Highly Skilled and Trained Analysts Remains Constant or Decreases National security decision systems span all QDR missions with a focus on finding threats in a specified data volume with limited manpower within a specified time window
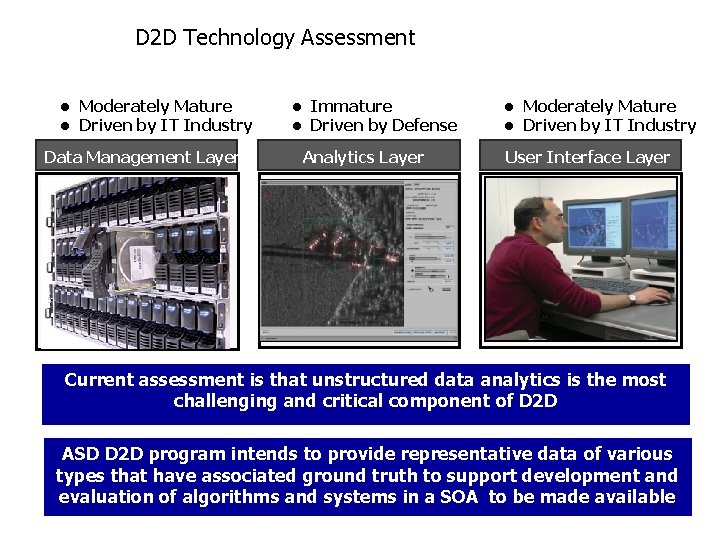
D 2 D Technology Assessment • Moderately Mature • Driven by IT Industry Data Management Layer • Immature • Driven by Defense Analytics Layer • Moderately Mature • Driven by IT Industry User Interface Layer Current assessment is that unstructured data analytics is the most challenging and critical component of D 2 D ASD D 2 D program intends to provide representative data of various types that have associated ground truth to support development and evaluation of algorithms and systems in a SOA to be made available

Slides I may/may not show
What Defense is trying to do and why it is hard Sensing - Extracting meaningful information from the bits with limited resources • What is the context? • Minimizing time, footprint, SWAP, and people • Coping with uncertainty, imprecision, incompleteness, and contradiction Unstructured Data requires a Transformation (i. e. processing) to become structured data • Text Processing (Bag of Words, Statistics…. . ) • Image Processing (Edge detection, BCS, ATC/D/R, activities, events, …. ) • Social Network Analysis (Statistics, Graphs, …. . ) In the context of a mission what is the information we need and what are the transformations that will convert the unstructured data into useful data 21
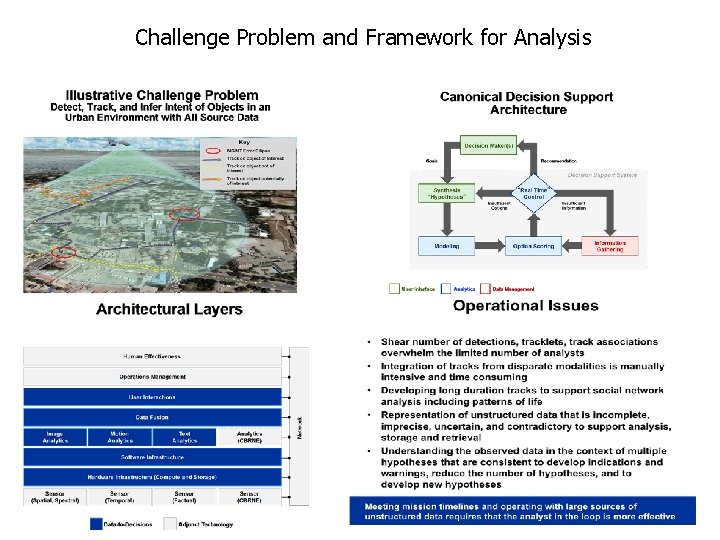
Challenge Problem and Framework for Analysis
- Slides: 22