This file has been cleaned of potential threats

This file has been cleaned of potential threats. If you confirm that the file is coming from a trusted source, you can send the following SHA-256 hash value to your admin for the original file. Using Weather Data in the Classroom 4479 c 2761 ff 0603 ca 919717921838968677 a 25 f 9 b 1 a 49 c 52 ec 6 f 1 ab 37 ef 3 f 0 a 6 Dr Tony Swemmer SAEON Ndlovu Node

OUTLINE • Background on SAEON • The automatic weather station – What does it measure? – Retrieving the data – Reading graphs • Working with data from the station – Weather • Daily patterns • Rainfall events • Effects of weather – rainfall and grass growth • Extension: combining with other data – Climate • Long-term patterns for Phalaborwa • Comparing with other towns • Climate change

The South African Environmental Observation Network • A comprehensive, sustained, coordinated and responsive South African earth observation network that delivers long-term reliable data for scientific research and informs decision-making • A network, not a funding organization – Facilities for long-term research – Co-ordination – Synthesis • www. saeon. ac. za

SAEON Nodes National Office Arid Lands Savanna Grasslands / Forests/ Wetlands Marine-Offshore Coastal-Inshore Fynbos
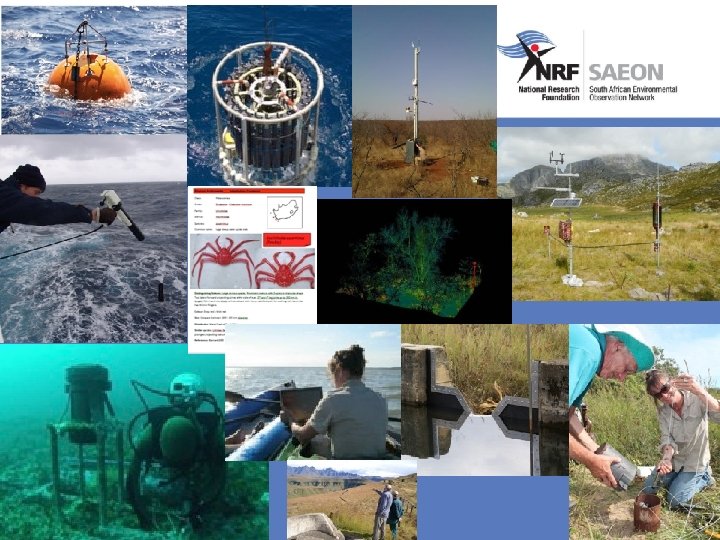

SAEON Ndlovu Node

Phalaborwa area • How do LAND USE and GLOBAL CLIMATE CHANGE affect the natural environment? – biodiversity – ecosystem services

EDUCATION OUTREACH • Science camps – – • • • Grade 11 (2010 - ) Grade 10 (2010 - ) Grade 9 (2011 - ) Grade 8 (2013 - ) School-based projects Educator workshops Science awareness – Support for NSW • Demostrations for university students

SCHOOL BASED PROJECT: WEATHER & CLIMATE

Data • Station sends data to console every 2. 5 seconds • Console writes data into memory on Data Logger • When you connect with cable, data is downloaded onto your computer

Using the data 1. Read directly off console 2. Weather link software 3. Microsoft Excel – download as text file – open text file in Excel

WEATHER • Weather = current condition of the atmosphere • Daily patterns – rainfall – min and max temperature – relative humidity • Weather events – Rainfall – weather before and after rainfall – examine previous rainfall events to explain process of storm formation

WEATHER. EXERCISE 1: Daily Data • Learners record data every day – either off console, or off Weather. Link on computer – teacher assists with data for weekends (from downloads) • Examine data to answer basic questions: – what day was the hottest this week / month / year? – how much rainfall last month? – on what day was the lowest minimum temperature recorded? – was is the difference between the temperature inside and outside?

WEATHER. EXERCISE 2: Rainfall Events • Read graphs off Weather. Link to investigate how weather changes before and after a storm passes – aim is to demonstrate changes in the weather that lead to the formation of clouds and rainfall • Should see: – high temperatures for one or two days – rapidly falling air pressure • then rises as storm passes – wind initially from N or W • then swings to SE as storm passes

WEATHER. EXERCISE 2: Rainfall Events

WEATHER. EXERCISE 2: Rainfall Events

WEATHER. EXERCISE 2: Rainfall Events

Extension • Using weather station data in combination with other data • Weather – Forecasts • Explain how computers are used to model the weather (difficult!) • Problems with weather forecasts – test accuracy of local weather forecasts • Climate – Phalaborwa – Comparing Phalaborwa with other areas in our region • reasons for differences – Climate change • Phalaborwa trends • Interview members of local community

WEATHER. EXERCISE 3: Forecasts • Record predictions made on TV or internet – for maximum temperature and rainfall – for 1, 2, 3, and 4 days ahead – use table or Excel • Then record actual weather recorded by weather station • Calculate differences between prediction and actual – Should find difference in accuracy between temperate and rainfall predictions – Should find accuracy is very low more than 1 or 2 days ahead

CLIMATE. EXERCISE 4: Phalaborwa Climate • Climate = long-term, average condition of atmosphere (usually averaged over 30 years or longer) 1. Use historical data for Phalaborwa (1955 to current) to answer questions about climate: – – – which month usually has the most rainfall? what is the average annual rainfall? which month is usually the hottest? which month usually has the high temperatures? which month usually has the lowest temperatures? how many times has the temperature exceeded 40 o. C? 2. Compare current weather conditions to climate records – how many times in the past has the maximum temperature exceeded today’s temperature?

CLIMATE. EXERCISE 5: Regional Climate • How does the climate of Phalaborwa compare with other towns in our area? • And what are the reasons for these differences? 1. Compare averages for: – annual rainfall – monthly max temp – monthly min temp 2. Check if weather matches differences seen – using forecasts on internet

CLIMATE. EXERCISE 5: Regional Climate 18 year average: Phalaborwa = 525 mm, Hoedspruit = 358 mm

CLIMATE. EXERCISE 6: Climate Change • Is the climate of Phalaborwa changing? 1. Study literature on global climate change. – what are the predicted changes for our area? 2. Analyse historical data for change – annual rainfall – maximum temperatures – minimum temperatures • Should see that large variability in weather from one year to the next makes it very difficult to detect change
")
CLIMATE. EXERCISE 6: Climate Change Phalaborwa Rainfall (1995 to present)

CLIMATE. EXERCISE 6: Climate Change

CLIMATE. EXERCISE 6: Climate Change

CLIMATE. EXERCISE 6: Climate Change

Other ideas • Reading synoptic charts – daily charts available on internet – compare with wind and pressure recorded at school • Relating weather to society – measure growth of fruit trees / crops in home gardens, and relate to weather – compare annual rainfall to grass production – interview members of local community to ask if they think the climate is changing • particular those affected by rainfall (e. g. small-scale farmers, game farm managers)

WAY FORWARD • Installing and maintaining stations – downloading data? – which teacher at your school will be responsible? • Develop current exercises? – Computer-based (Excel) or paper-based? • More ideas for classroom exercises / projects • ESKOM and Tri. Tech projects – We can assist learners with projects that make use of weather or climate data

USEFUL WEBSITES • Weather forecasts – – • http: //weatherphotos. co. za http: //www. yr. no/place/South_Africa/Limpopo/Phalaborwa_Hek/ http: //www. windfinder. com/forecast/phalaborwa http: //www. weathersa. co. za/ Ideas for classroom lessons or projects – http: //www. srh. noaa. gov/jetstream/matrix. htm – http: //www. metlink. org/wp-content/uploads/2013/11/work_schemes/lesson 2_pritchard. pdf – https: //www. teachengineering. org/view_activity. php? url=collection/cub_/activities/cub_weather/c ub_weather_lesson 04_activity 1. xml – http: //www. weatherwizkids. com/weather-experiments. htm • Info on global climate change – http: //eo. ucar. edu/educators/Climate. Discovery/ESS. htm – http: //www. wunderground. com/climate/ – https: //www. koshland-science-museum. org/explore-the-science/earth-lab#. VO 13 C 3 y. VI 9 Y
- Slides: 30