Third SPC Regional Technical Meeting on Coastal Fisheries


")

")


: o KI 20001: 35")
: o NC 1:")


- Slides: 37
Third SPC Regional Technical Meeting on Coastal Fisheries EVOLUTION OF FISHERIES DATA COLLECTION PROCESSES AND PROCEDURES “RESPONDING TO COUNTRY NEEDS” ANDREW HALFORD, FRANCK MAGRON, PAULINE BOSSERELLE, BERNARD VIGGA FAME COASTAL FISHERIES PROGRAM SCIENCE AND DATA
How did we get here?
Fragmented - highly variable in scale and scope
Current Issues around Coastal Fisheries In general…… • Fragmented • Not recognized as major contributor to GDP • Limited resources/capacity available in national management agencies • Available data is minimal and/or of inconsistent quality
Oceanic vs Coastal • Significant revenue for GDP of PICT’s • Minimal contribution to GDP? • Regional stock structures • Poorly resourced • Well resourced • Well managed = Stocks in reasonable health • Poor capacity • Poorly managed = Declining stocks
RTMCF 1 and 2 v RTMCF 1 – Nov. 2017 o First meeting - focus on data quality o Stock take of existing data and databases v RTMCF 2 – Nov. 2018 o Progress slow against RTMCF 1 objectives
Stock Assessment: The Foundation of Fisheries Management Landings by Gear Type 1. commercial 2. recreational Catch Demographic Data Life History Information 1. age composition 2. length composition growth, maturity, etc. Stock Assessment Fishery Dependent Information (logbook data, discards, creel surveys Market surveys) Fishery Independent Surveys (e. g. , visual census) Management Decisions
ID’ s trainin g length CPUE Data Stock entry asses market s s lifehistor y creel e-data weight Information overload!! L 50 MS Y otoliths bioma ss
Size s Talk with experience d scientists edata “Less-is- Creel Interactions with in-country field workers, NGO’s
OUTCOMES • Focus on a smaller core set of indicators – species, size, (weight) • Simple indicators everyone understands • Use e-data (technology) where possible to make data management more efficient, more robust – improve reporting
Focus on a smaller core set of indicators – Species, Length-Weight 1965 1985 2015
E-DATA • Uptake of the internet is extensive throughout the Pacific (>50% in 2018) – so e-data is now a viable method of collection and manipulation of data • TAILS is a good example of SPC’s work in this area. • Extending TAILS to use for coastal fisheries data collection • Development of other tools to improve data collection systems
Measurement Pack • Length/ weight • Species identification
SIMPLE LENGTH-WEIGHT DATA • Add other data collection programmes to build information – e. g. spawning potential, size-atmaturity
Online Learning Modules Courses modules for self learning Tutors/teams for surveyor groups Coastal food fishes and aquarium fishes New courses to be added (invertebrates/corals)
Online Learning Modules
Online Learning Modules
Offline analysis of pictures Analysis of pictures in a folder for species identification and length/weight
TAILS for creel surveys TUFMAN 2 / TAILS app extended by OFP with additional questions in relation with coastal fisheries Scientific names Tailored for size measurements
TAILS creel survey mode The creel survey mode must be enabled Scientific names can also be enabled
Market survey web application and app Web application and Ikasavea mobile app Some questions about stall vendor and origin of catch Species composition and sizes
Market survey web application Upload of pictures and analysis of pictures online
Market survey web application Verification of species ID Outputs for analysis : • • • Raw data export Size frequencies Size/weights)
Ikasavea mobile app with online sync
Ikasavea mobile app with online sync
HIES SURVEY – KIRIBATI 2019 high pop’n. medium pop’n. low pop’n.
HIES SURVEYS • Collect national level information • Rely on memory of participants – how accurate is this? • Aggregate data on total biomass of marine protein – needs to be as accurate as possible!
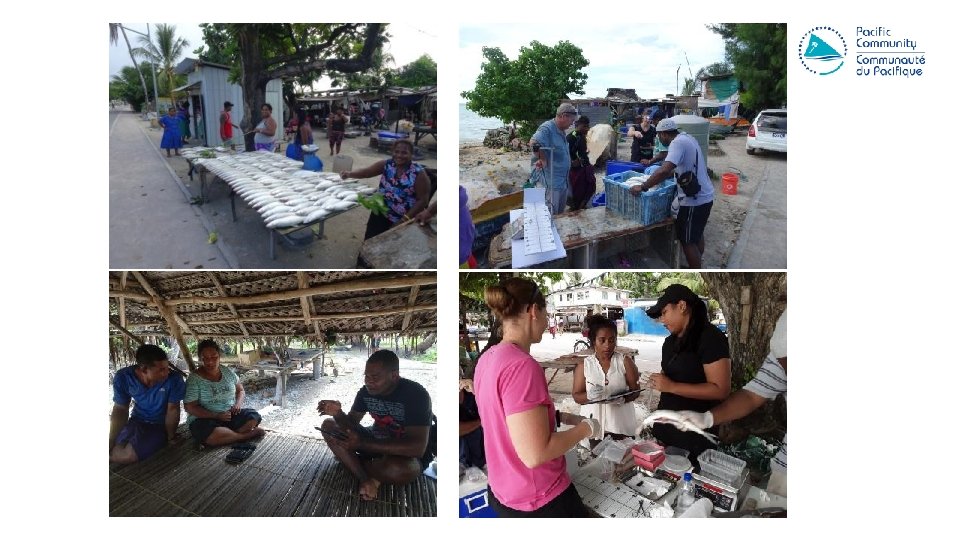
METHODOLOGY CREEL SURVEYS • 2 weeks @ Sth Tarawa, Abemama, Onatoa • Daily surveys with fishermen/women • Detailed information on catch and effort • Calibrate the HIES information
OUTCOMES • Detailed species level data on numbers and weight • Fishing effort (across different population zones) • Quality control of HIES data • Higher quality national level aggregate data on total fishing effort on coastal reefs • Better management decisions
WHAT CAN BE ACHIEVED ? • 6 weeks in Kiribati: 11, 344 fish measured, 181 interviews 3 teams of 2 people spent 2 weeks on each island group surveyed Fishing method Abemama Onotoa Species Bonefish Paddletail snapper Longface emperor Common bleustripe snapper Orange-striped emperor Spangled emperor Blacktail snapper Bigeye trevally Peacock grouper Grand Total Tarawa 52 79 50 659 446 65 1 134 105 241 1 44 2740 55 690 64 140 274 1442 1003 385 321 46 334 43 254 35 5337 37 7 177 3267 Grand Total 181 2156 2139 514 462 454 439 321 262 256 11344 Spearfishing 9% 9% Handlining 5% 5% Gillnetting Gleaning/Collecting 22% 49% Trolling Mixed or unknown (Eel trap)
FISH COMPOSITION Tarawa Onotoa Abemama 2% 24% 27% 21% 38% 56% 1% 5% 16% 8% 19% 1% 6% 6% 1% 2 % 4% 7% 2% 5% 9% 0% 4% 5 0% % 2% 0% 1%
SPECIES DETAILS – Bonefish Albula glossodonta • Maturity size (cm): o KI 20001: 35 (♂&♀) Location Length (cm) Abemama 32. 2 Onotoa 36. 7 Tarawa 36. 3 o KI 20132: 31 (♂&♀) Average 35. 1 o FP 3: 43 (♂) 48 (♀) Bonefish size distribution 30, 00 Abemama (n=659) Onotoa (n=55) 25, 00 Frequency (%) Tarawa (n=1442) 20, 00 • Min harvest size: 30 cm (2019) • 84 % Pop > 30 cm 15, 00 10, 00 5, 00 0, 00 14 12 - 20 18 - 26 24 - 32 30 - 38 36 - 44 42 - Size classes (cm) 50 48 - 56 54 - >60 Beets, 2000 Kiareti et al, 2015 3 Filous et al, 2019 1 2
SPECIES DETAILS - Paddletail Snapper Lutjanus gibbus • Maturity size (cm): o NC 1: 25. 8 (♀), 26. 8 (♂) Location Length (cm) Abemama 21. 9 Onotoa Tarawa All Average 25. 7 24. 3 24. 0 Paddle tail snapper size distribution 0, 3 Abemama (n=446) o AS 2: 24. 9 (♀) • Min harvest size: 25 cm (2019) • 45 % Pop > 25 cm Onotoa (n= 690) 0, 25 Frequency (%) Tarawa (n=1003) 0, 2 0, 15 0, 1 0, 05 0 0 -2 12 -14 16 -18 20 -22 24 -26 28 -30 32 -34 36 -38 42 -44 52 -54 Size classes (cm) 1 2 Moore, 2019 Taylor et al, 2018
Design - Update Analyse, discuss, report Feedback Implementati on Field testing SPC – PICT’s requests
COMMUNICATION AND DISSEMINATION Feedback Output – discussions, reporting, meeting, disseminating
THANK YOU!