
Thinking Critically with Psychological Science College Board Acorn
Thinking Critically with Psychological Science College Board - “Acorn Book” Course Description 8 -10% (6 -8% in past) Chapter 1
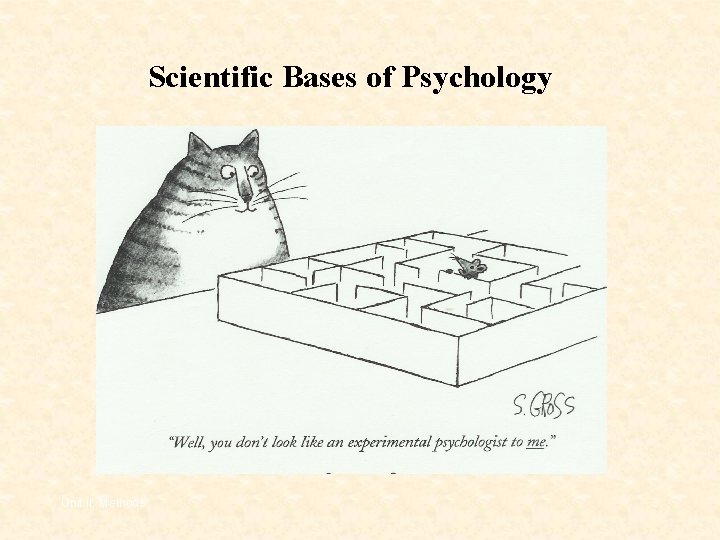
Scientific Bases of Psychology Unit II. Methods 3
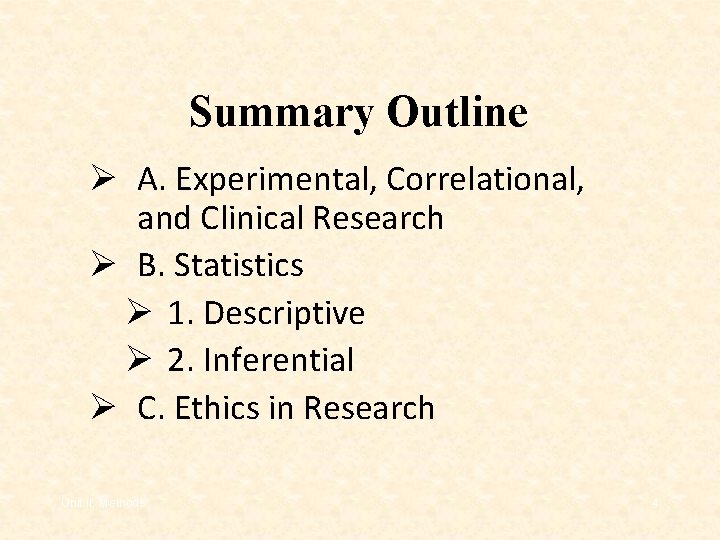
Summary Outline Ø A. Experimental, Correlational, and Clinical Research Ø B. Statistics Ø 1. Descriptive Ø 2. Inferential Ø C. Ethics in Research Unit II. Methods 4
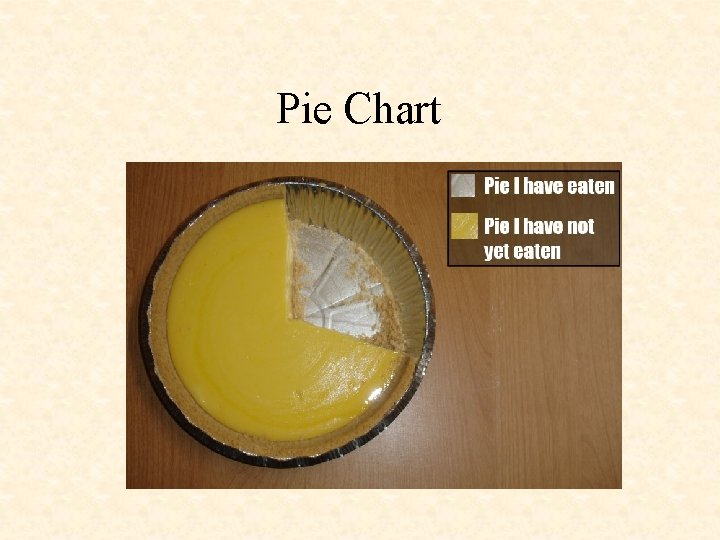
Pie Chart
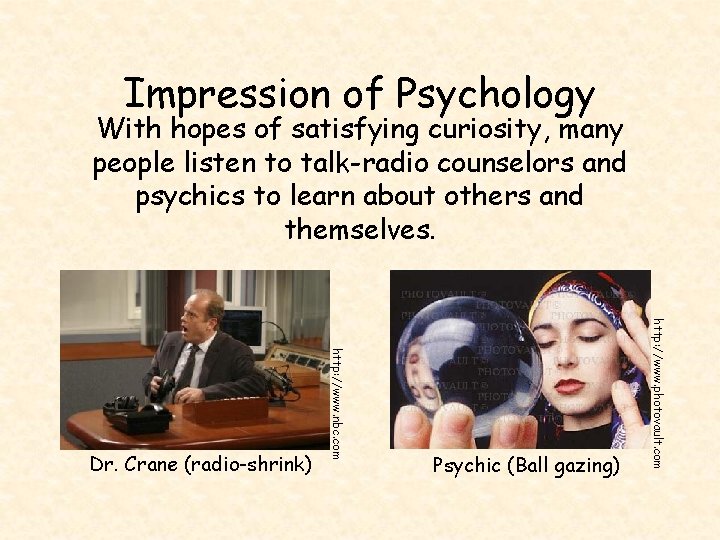
Impression of Psychology With hopes of satisfying curiosity, many people listen to talk-radio counselors and psychics to learn about others and themselves. Psychic (Ball gazing) http: //www. photovault. com http: //www. nbc. com Dr. Crane (radio-shrink)
The Need for Psychological Science Intuition & Common Sense Many people believe that intuition and common sense are enough to bring forth answers regarding human nature. Intuition and common sense may aid queries, but they are not free of error.
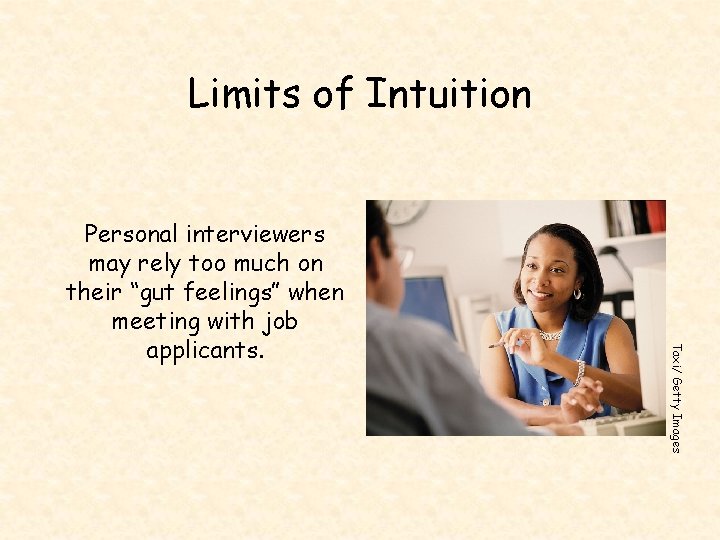
Limits of Intuition Taxi/ Getty Images Personal interviewers may rely too much on their “gut feelings” when meeting with job applicants.
Hindsight Bias is the “I-knew-it-all-along” phenomenon. After learning the outcome of an event, many people believe they could have predicted that very outcome. We only knew the dot. com stocks would plummet after they actually did plummet.
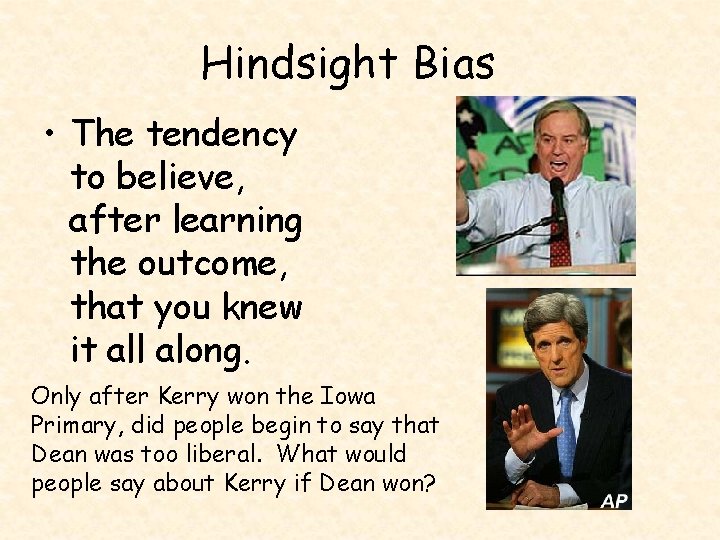
Hindsight Bias • The tendency to believe, after learning the outcome, that you knew it all along. Only after Kerry won the Iowa Primary, did people begin to say that Dean was too liberal. What would people say about Kerry if Dean won?
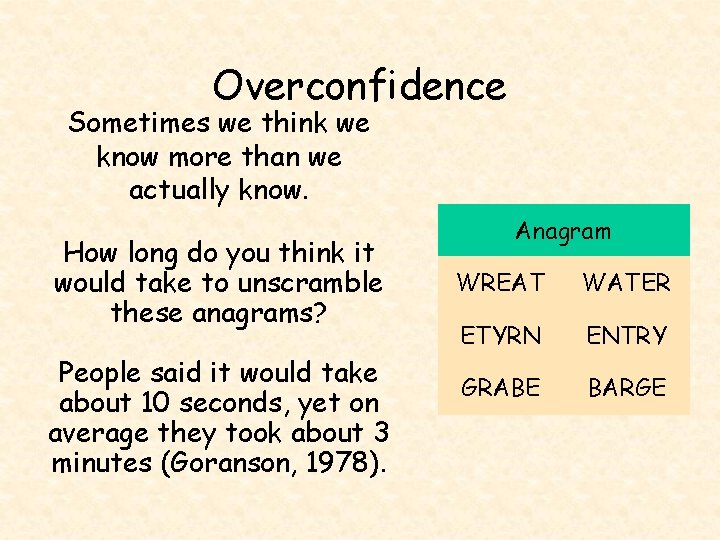
Overconfidence Sometimes we think we know more than we actually know. How long do you think it would take to unscramble these anagrams? People said it would take about 10 seconds, yet on average they took about 3 minutes (Goranson, 1978). Anagram WREAT WATER ETYRN ENTRY GRABE BARGE
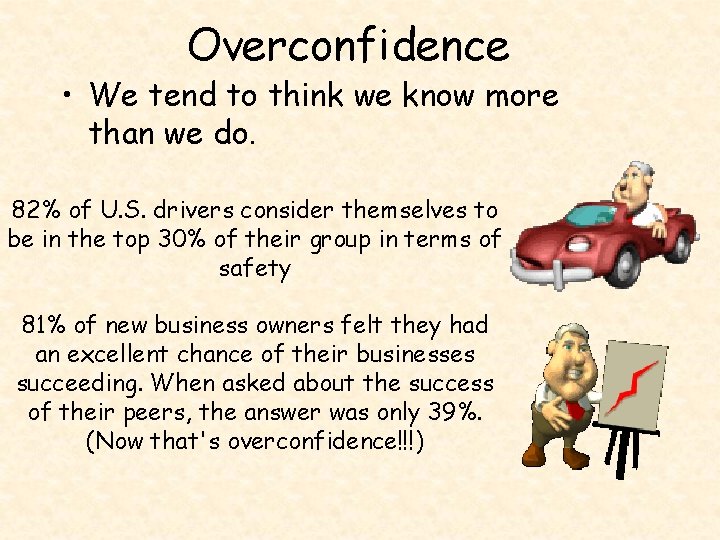
Overconfidence • We tend to think we know more than we do. 82% of U. S. drivers consider themselves to be in the top 30% of their group in terms of safety 81% of new business owners felt they had an excellent chance of their businesses succeeding. When asked about the success of their peers, the answer was only 39%. (Now that's overconfidence!!!)
Psychological Science 1. How can we differentiate between uniformed opinions and examined conclusions? 2. The science of psychology helps make these examined conclusions, which leads to our understanding of how people feel, think, and act as they do!
Scientific Method Psychologists, like all scientists, use the scientific method to construct theories that organize, summarize and simplify observations.
Theory A Theory is an explanation that integrates principles and organizes and predicts behavior or events. For example, low self-esteem contributes to depression.
Hypothesis A Hypothesis is a testable prediction, often prompted by a theory, to enable us to accept, reject or revise theory. People with low self-esteem are apt to feel more depressed.
Hypothesis • A tentative theory that has not yet been tested. • Have operational definitions. • Be replicable.
Research Observations Research would require us to administer tests of self-esteem and depression. Individuals who score low on a selfesteem test and high on a depression test would confirm our hypothesis.
Scientific Method 1. Observe some aspect of the universe. 2. Invent a theory that is consistent with what you have observed. 3. Use theory to make predictions. 4. Test those predictions by experiments or further observations. 5. Modify theory in the light of your results. 6. Go to step 3.
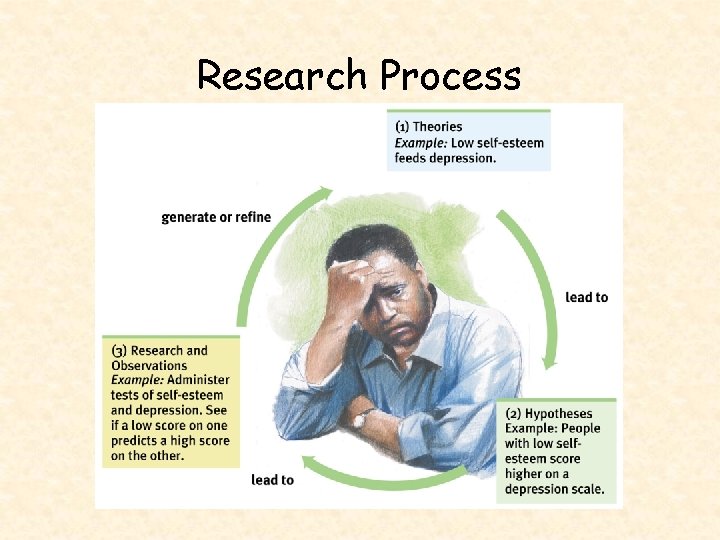
Research Process
Types of Descriptive Research • The Case Study • The Survey • Naturalistic Observation
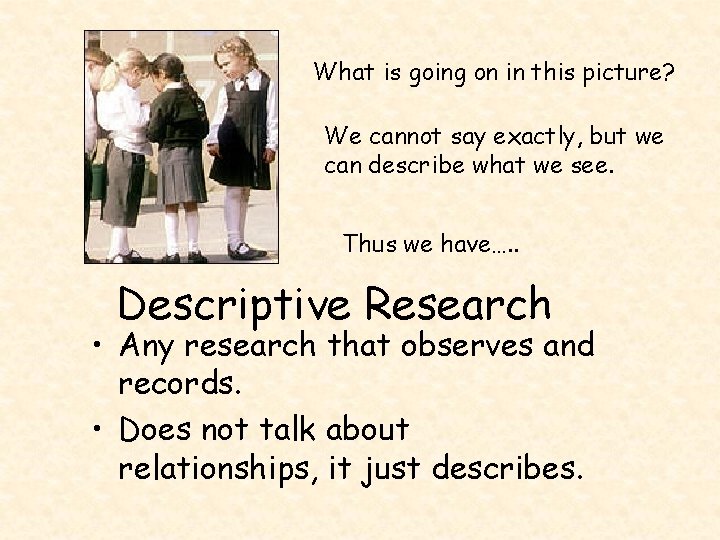
What is going on in this picture? We cannot say exactly, but we can describe what we see. Thus we have…. . Descriptive Research • Any research that observes and records. • Does not talk about relationships, it just describes.
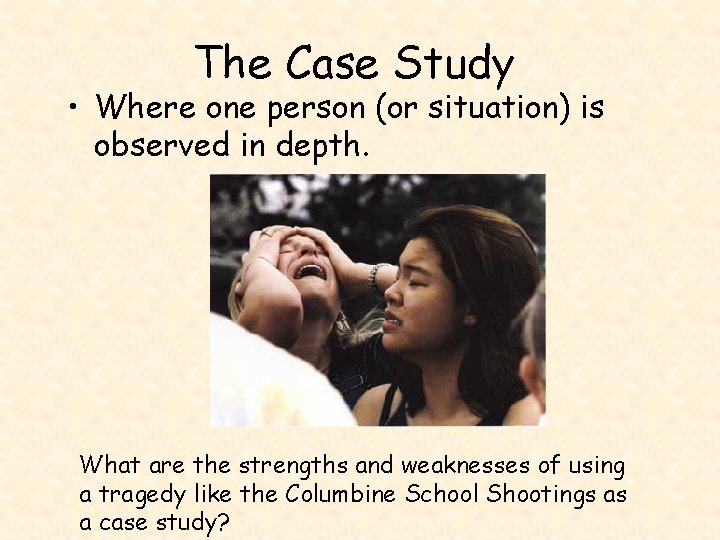
The Case Study • Where one person (or situation) is observed in depth. What are the strengths and weaknesses of using a tragedy like the Columbine School Shootings as a case study?
Types of Case Studies • Longitudinal studies – Follow same person, or group of people, over a long period of time – Advantage: same subjects, results maybe more reliable – Disadvantage: time, money, subjects drop out or move • Cross-sectional studies – Study various age groups at one time – Advantage: less time, money, … – Disadvantage: groups may bring in extraneous variables that cannot be controlled
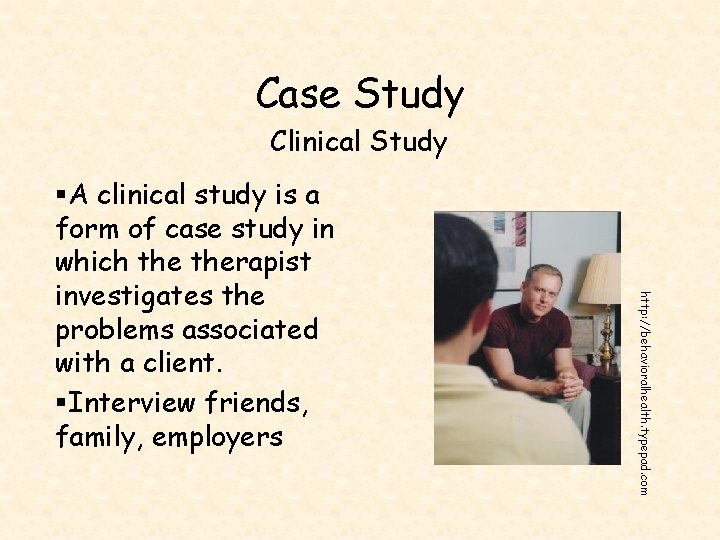
Case Study Clinical Study http: //behavioralhealth. typepad. com §A clinical study is a form of case study in which therapist investigates the problems associated with a client. §Interview friends, family, employers
The Survey Method • Used in both descriptional and correlational research. • Use Interview, mail, phone, internet etc… • The Good- cheap, anonymous, diverse population, and easy to get random sampling (a sampling that represents your population you want to study).
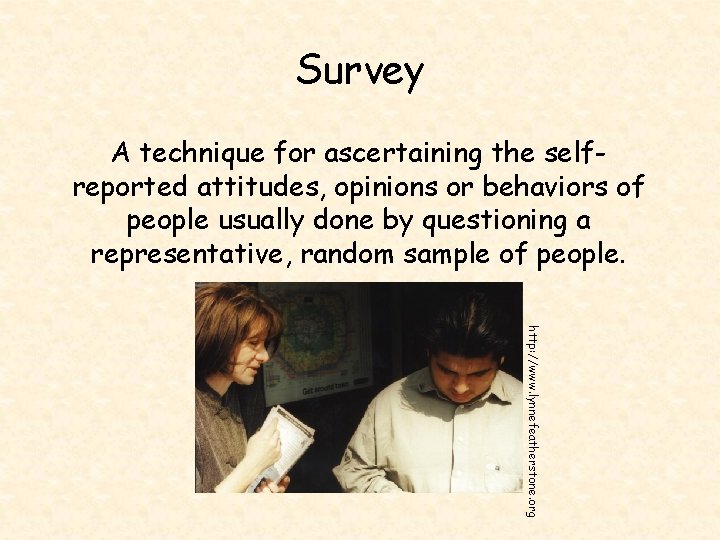
Survey A technique for ascertaining the selfreported attitudes, opinions or behaviors of people usually done by questioning a representative, random sample of people. http: //www. lynnefeatherstone. org
Survey Wording Effect Wording can change the results of a survey. Q: Should cigarette ads and pornography be allowed on television? (not allowed vs. forbid)
Survey False Consensus Effect A tendency to overestimate the extent to which others share our beliefs and behaviors.
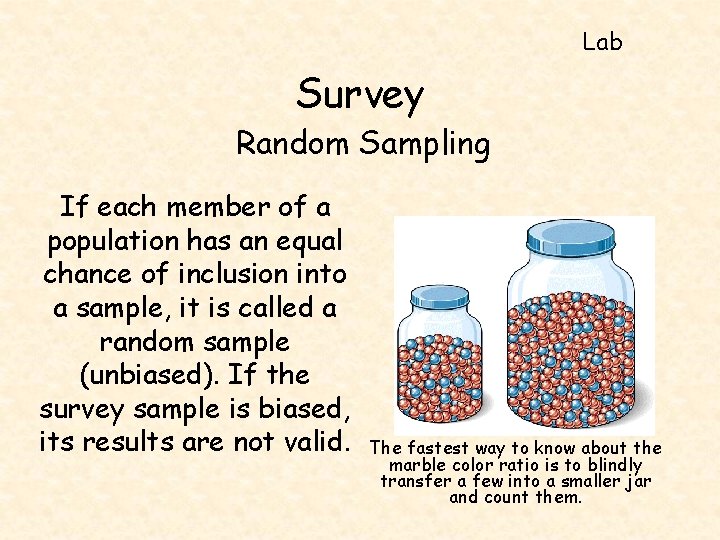
Lab Survey Random Sampling If each member of a population has an equal chance of inclusion into a sample, it is called a random sample (unbiased). If the survey sample is biased, its results are not valid. The fastest way to know about the marble color ratio is to blindly transfer a few into a smaller jar and count them.
Survey form of natural observation • Widely used to observe attitudes, , opinions, and reported behaviors • Advantages – Targets specific information – Can gather large amounts of information in a relatively short time • Disadvantages – Based on subject’s responses which can be distorted due to • • Misleading answers (Outright lying, bias, etc. ) Misunderstanding of the question Poorly devised questions Placebo effect
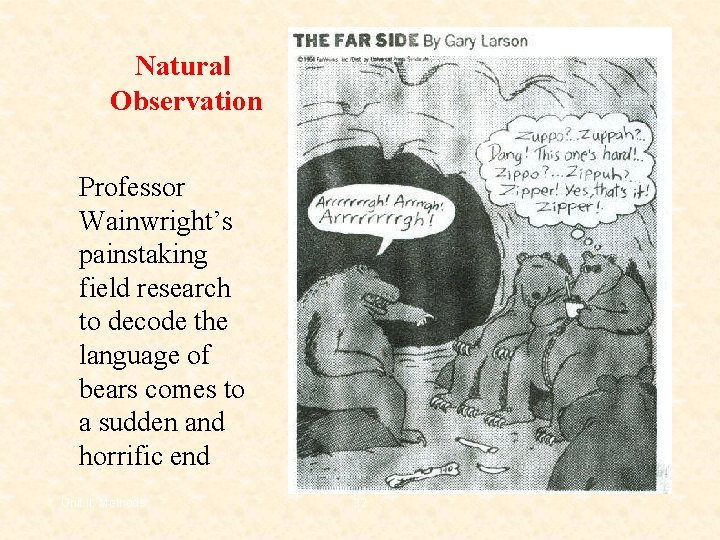
Natural Observation Professor Wainwright’s painstaking field research to decode the language of bears comes to a sudden and horrific end Unit II. Methods 32
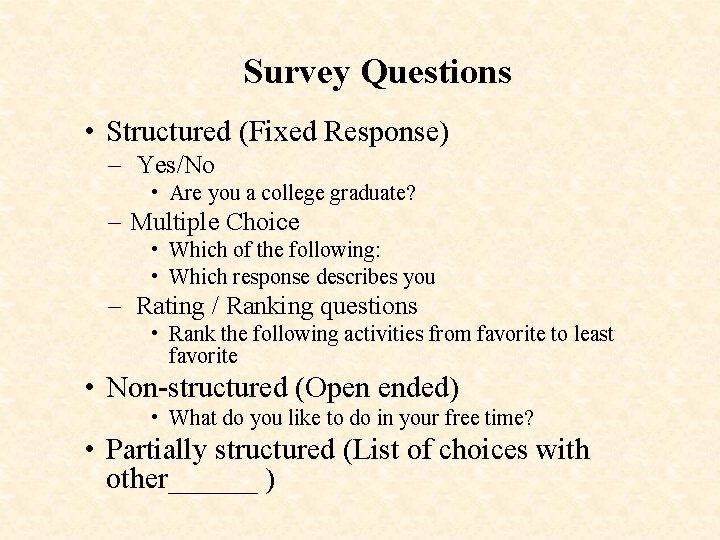
Survey Questions • Structured (Fixed Response) – Yes/No • Are you a college graduate? – Multiple Choice • Which of the following: • Which response describes you – Rating / Ranking questions • Rank the following activities from favorite to least favorite • Non-structured (Open ended) • What do you like to do in your free time? • Partially structured (List of choices with other______ )
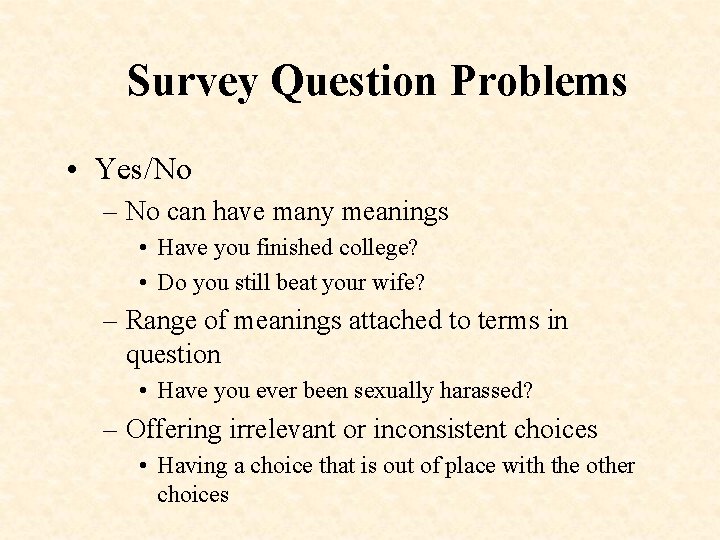
Survey Question Problems • Yes/No – No can have many meanings • Have you finished college? • Do you still beat your wife? – Range of meanings attached to terms in question • Have you ever been sexually harassed? – Offering irrelevant or inconsistent choices • Having a choice that is out of place with the other choices
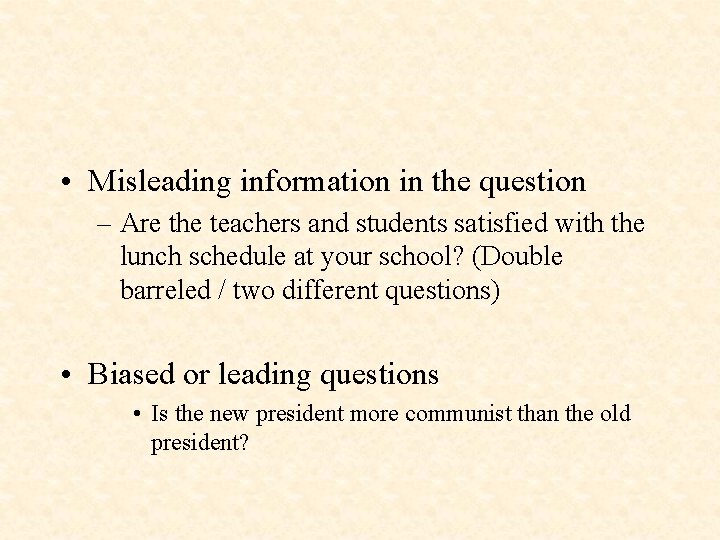
• Misleading information in the question – Are the teachers and students satisfied with the lunch schedule at your school? (Double barreled / two different questions) • Biased or leading questions • Is the new president more communist than the old president?
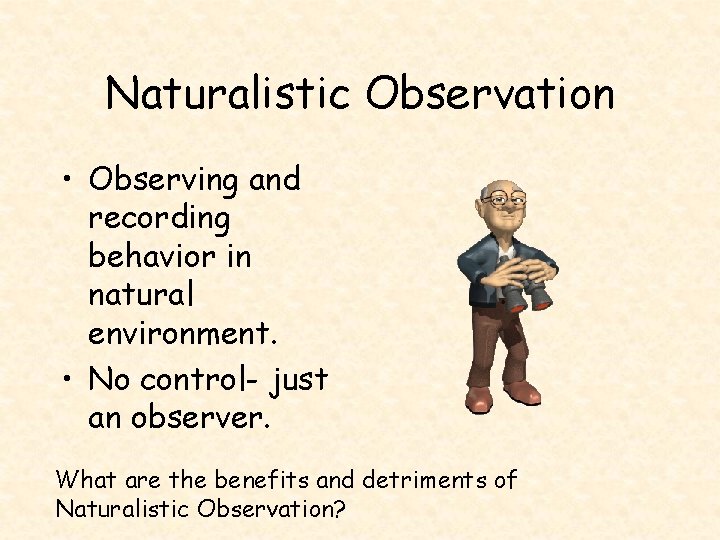
Naturalistic Observation • Observing and recording behavior in natural environment. • No control- just an observer. What are the benefits and detriments of Naturalistic Observation?
Laboratory Observation • Psychologist controls the environment and variables • May not see true behavior
Descriptive Methods Summary Case studies, surveys, and naturalistic observation describe behaviors.
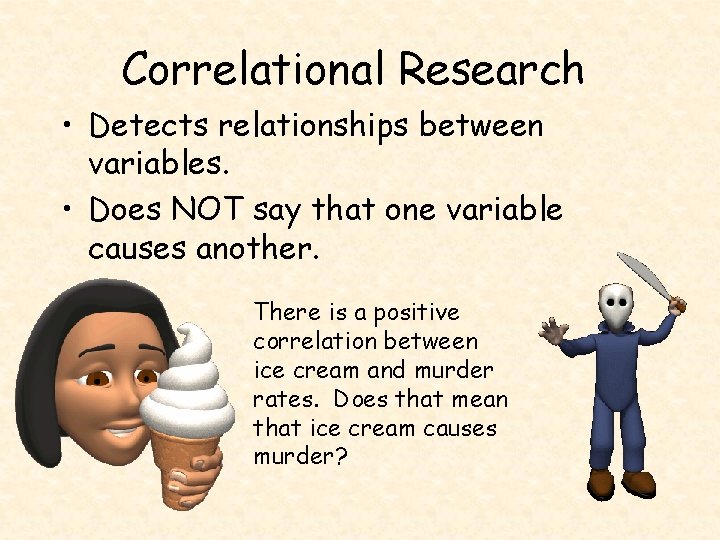
Correlational Research • Detects relationships between variables. • Does NOT say that one variable causes another. There is a positive correlation between ice cream and murder rates. Does that mean that ice cream causes murder?
Types of Variables • There are typically four levels of measurement that are defined: – Nominal – Ordinal – Interval – Ratio
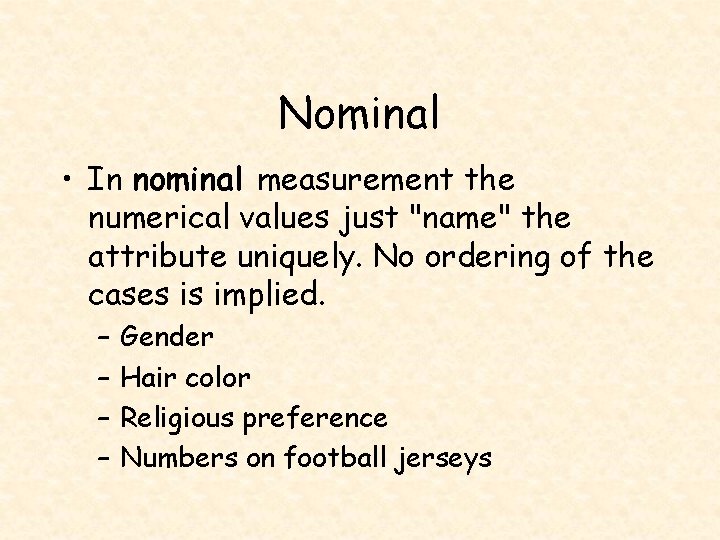
Nominal • In nominal measurement the numerical values just "name" the attribute uniquely. No ordering of the cases is implied. – – Gender Hair color Religious preference Numbers on football jerseys
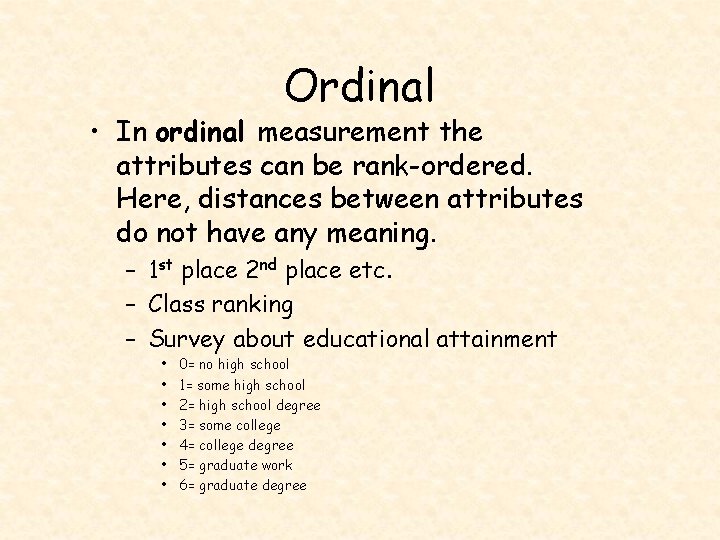
Ordinal • In ordinal measurement the attributes can be rank-ordered. Here, distances between attributes do not have any meaning. – 1 st place 2 nd place etc. – Class ranking – Survey about educational attainment • • 0= no high school 1= some high school 2= high school degree 3= some college 4= college degree 5= graduate work 6= graduate degree
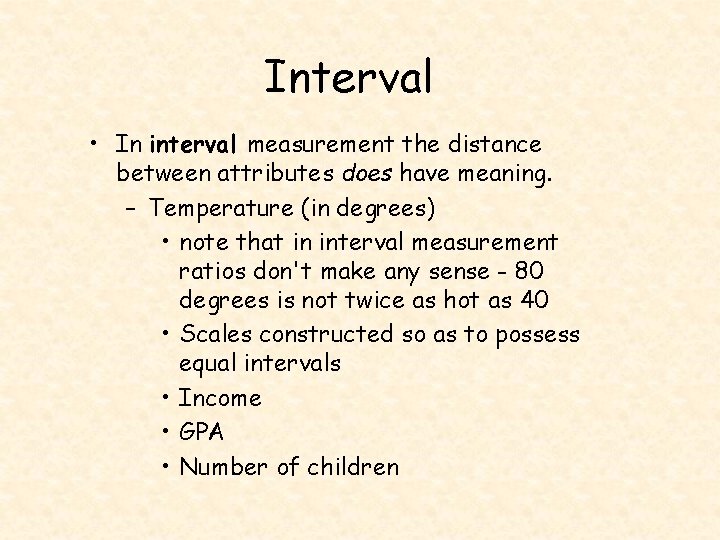
Interval • In interval measurement the distance between attributes does have meaning. – Temperature (in degrees) • note that in interval measurement ratios don't make any sense - 80 degrees is not twice as hot as 40 • Scales constructed so as to possess equal intervals • Income • GPA • Number of children
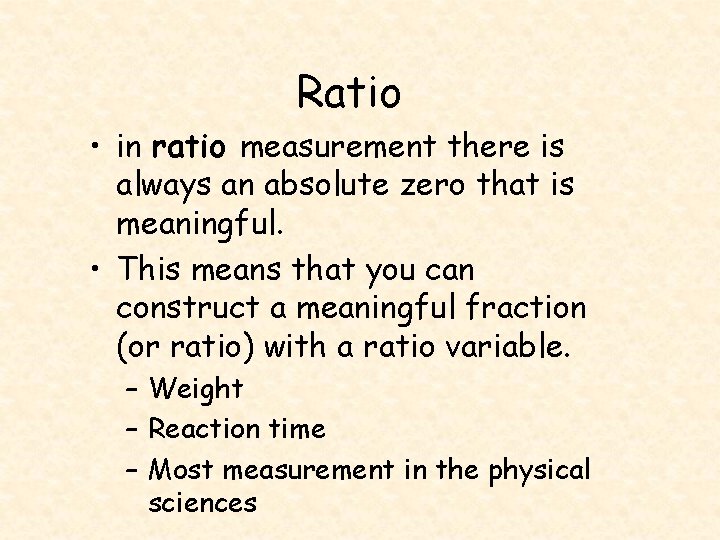
Ratio • in ratio measurement there is always an absolute zero that is meaningful. • This means that you can construct a meaningful fraction (or ratio) with a ratio variable. – Weight – Reaction time – Most measurement in the physical sciences
Why is this important? • The type of variable you use determines the statistical analysis you can use. • At lower levels of measurement, assumptions tend to be less restrictive and data analyses tend to be less sensitive • At each level up the hierarchy, the current level includes all of the qualities of the one below it and adds something new.
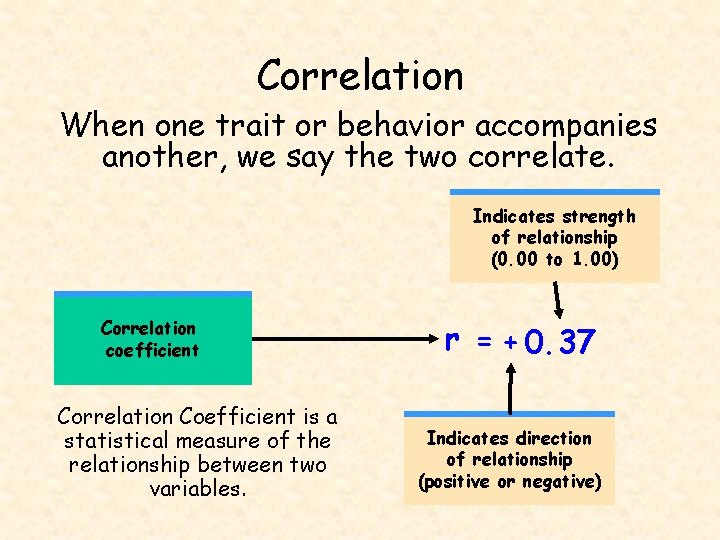
Correlation When one trait or behavior accompanies another, we say the two correlate. Indicates strength of relationship (0. 00 to 1. 00) Correlation coefficient Correlation Coefficient is a statistical measure of the relationship between two variables. r = + 0. 37 Indicates direction of relationship (positive or negative)
Correlation – Key Concepts • Correlational research is a form of observational research – Correlation does not show causation • Causation can only be inferred from the experimental method • Confusion over the concept of experiment – Casual use – Used to describe demonstrations • Confusion over positive vs. negative correlation – Statistical methods give us Correlation from • 0 to +/- 1
Positive v. Negative Correlation ØCorrelation Coefficients ØPositive Correlation ØNegative Correlation Unit II. Methods 48
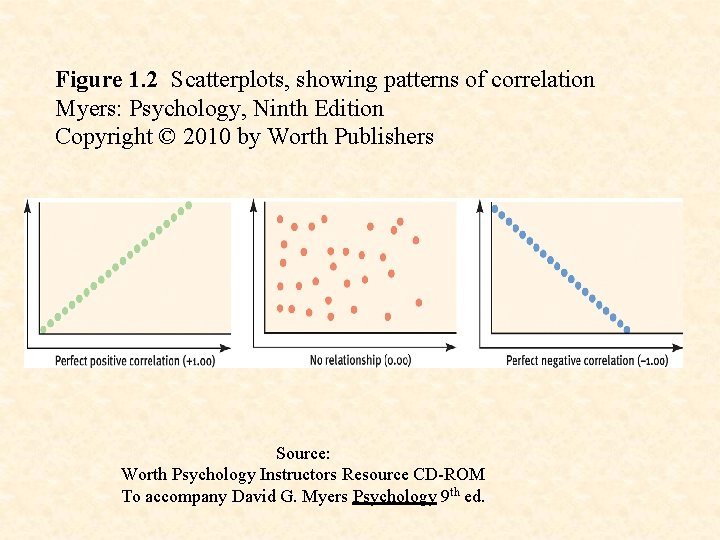
Figure 1. 2 Scatterplots, showing patterns of correlation Myers: Psychology, Ninth Edition Copyright © 2010 by Worth Publishers Source: Worth Psychology Instructors Resource CD-ROM To accompany David G. Myers Psychology 9 th ed.
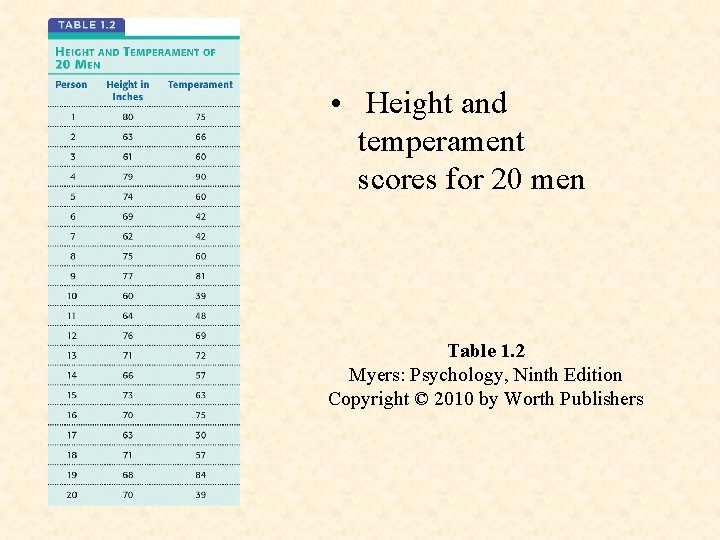
• Height and temperament scores for 20 men Table 1. 2 Myers: Psychology, Ninth Edition Copyright © 2010 by Worth Publishers
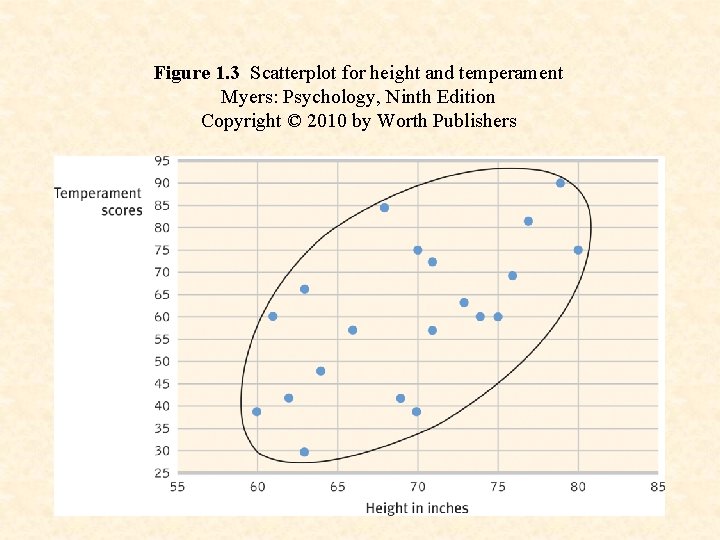
Figure 1. 3 Scatterplot for height and temperament Myers: Psychology, Ninth Edition Copyright © 2010 by Worth Publishers
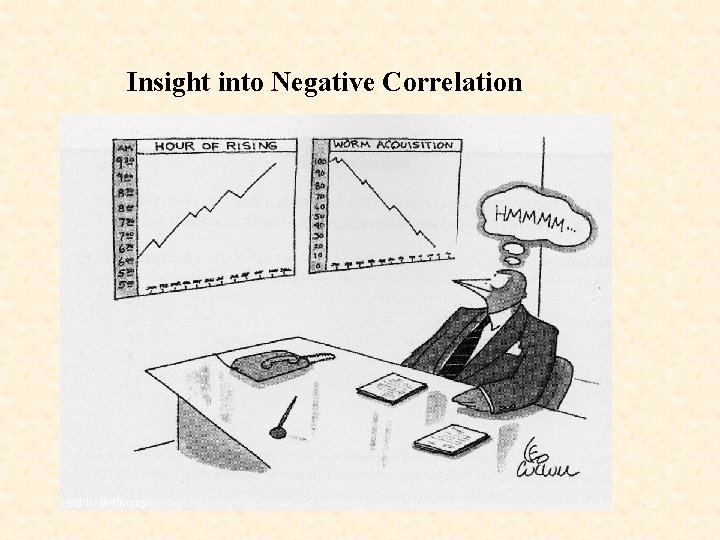
Insight into Negative Correlation Unit II. Methods 52
For the following correlation findings, state 1) whether the correlation is positive or negative, and 2) what possible intervening variables might explain the results. (Some examples are imaginary. ) • • A. The more rooms a person has in their house, the more pairs of shoes they are likely to own. • B. The more class days students miss, the lower their grades are likely to be. • C. The more expensive a person’s car is, the fewer successful intimate relationships they have. • D. More educated people tend not to buy designer label clothing.
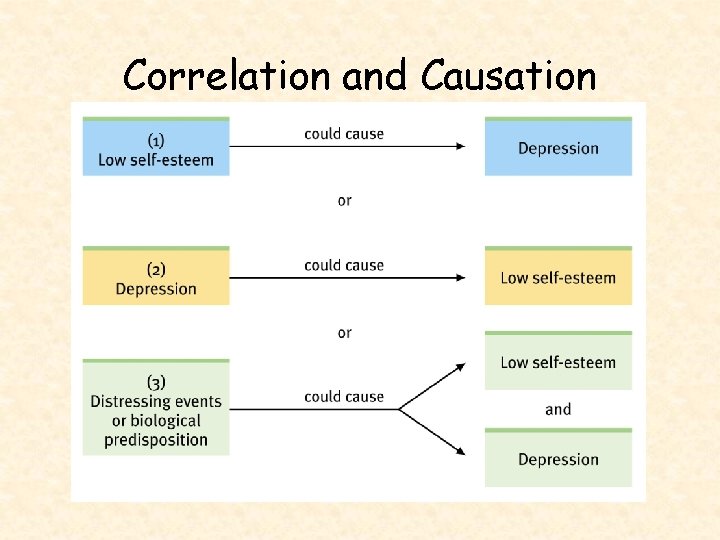
Correlation and Causation or
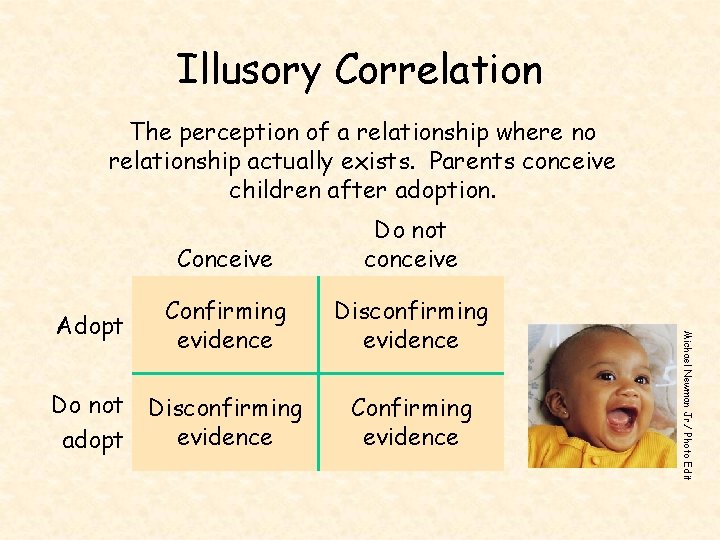
Illusory Correlation The perception of a relationship where no relationship actually exists. Parents conceive children after adoption. Confirming evidence Disconfirming evidence Do not Disconfirming evidence adopt Confirming evidence Michael Newman Jr. / Photo Edit Adopt Conceive Do not conceive
Experimentation Exploring Cause and Effect Like other sciences, experimentation is the backbone of psychology research. Experiments isolate causes and their effects.
Experimentation “No amount of experimentation can ever prove me right, a single experiment can prove me wrong. ” Albert Einstein
Exploring Cause & Effect Many factors influence our behavior. Experiments (1) manipulate factors that interest us, while other factors are kept under (2) control. Effects generated by manipulated factors isolate cause and effect relationships.
Steps in Designing an Experiment 1. Hypothesis 2. Pick Population: Random Selection then Random Assignment. 3. Operationalize the Variables 4. Identify Independent and Dependent Variables. 5. Look for Extraneous ( Intervening) Variables 6. Type of Experiment: Blind, Double Blind etc. . 7. Gather Data 8. Analyze Results
Experimental & Control Groups Unit II. Methods 60
A. 2. Experiments Ø Experimental Design Ø Selection of Participants ØPopulation ØSample ØRandom sampling Ø Assignment of Participants to Groups ØExperimental Group ØControl Group ØRandom Assignment Unit II. Methods 61
Key Ideas in Experiment Design ØTreatment of Groups ØVariables ØIndependent Variable (IV) ØDependent Variable (DV) ØPlacebo ØExperimenter Bias ØSteps to control experimenter bias Ødouble-blind design, etc. Unit II. Methods 62
Steps of the Scientific Method • Ask a question – Why does something happen? What is the cause? • Do background research – Who has already studied this? Related studies and ideas. • Form a hypothesis – If “a” then “b” / causal relationship • Test the hypothesis by doing an experiment • Analyze your data and draw a conclusion – Statistical analysis / Accept or reject hypothesis • Communicate your findings – Fully report hypothesis, methodology, statistical methods – Allows for informed review and replication
Experimental Design-only method meant to show “cause and effect” • Null Hypothesis- a formal expression that there is NO relation • Hypothesisbetween or among the • A statement about the variables under relation between two or investigation more variables • One attempts to reject • Must be testable, the null when a verifiable and refutable relationship is observed
Experimental Variables • Independent– variable manipulated by the experimenter (IV) • Dependent– Measured variable influenced by the independent variable (DV) • Confounding- any variable besides the IV that could influence the experimental results (this is unwanted)
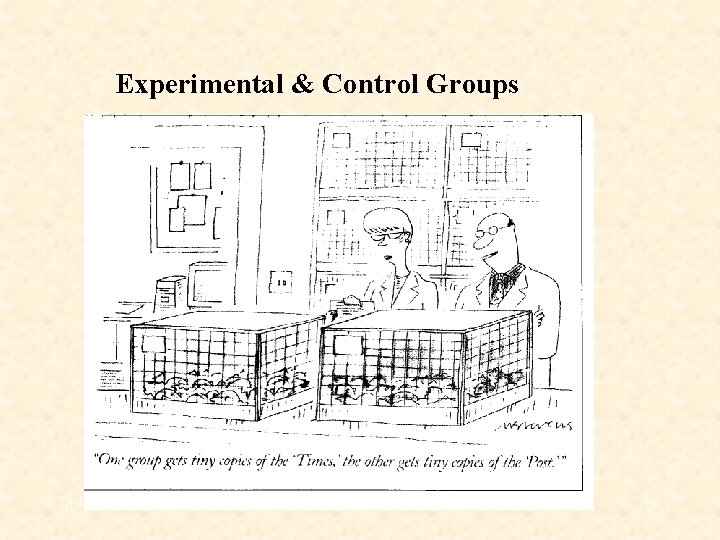
Subject Groups • Experimental Group – The group that receives treatment (IV) • Control Group – Group that does not receive treatment (or receives treatment that is presumed to be ineffective e. g. placebo) – Used as a basis of comparison – Serves to eliminate alternative explanations of the results
Population • The larger group of people or animals from which the sample is drawn • Sample-set of subjects drawn from a particular population • Representative Sampleselected subjects are reflective of the population from which the sample is drawn
Control Measures • Counterbalancing– Controls for order effect of conditions • Randomization– Selection and assignment of subjects to groups through chance procedure
Control Measures • Single-blind– Controls subject awareness of group assignment • Double-blind– Controls subject and experimenter awareness of group assignment
Operational Definitionan empirical measure of a vague term • WHY? • Try this. . . • See Activities for research design
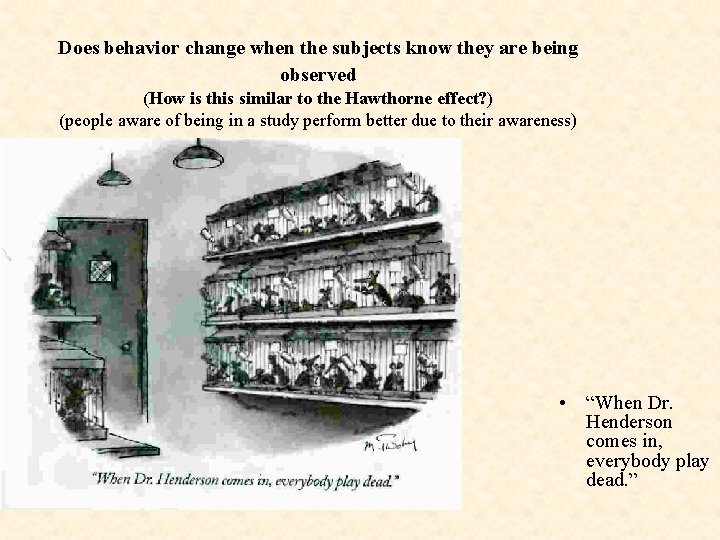
Does behavior change when the subjects know they are being observed (How is this similar to the Hawthorne effect? ) (people aware of being in a study perform better due to their awareness) • “When Dr. Henderson comes in, everybody play dead. ”
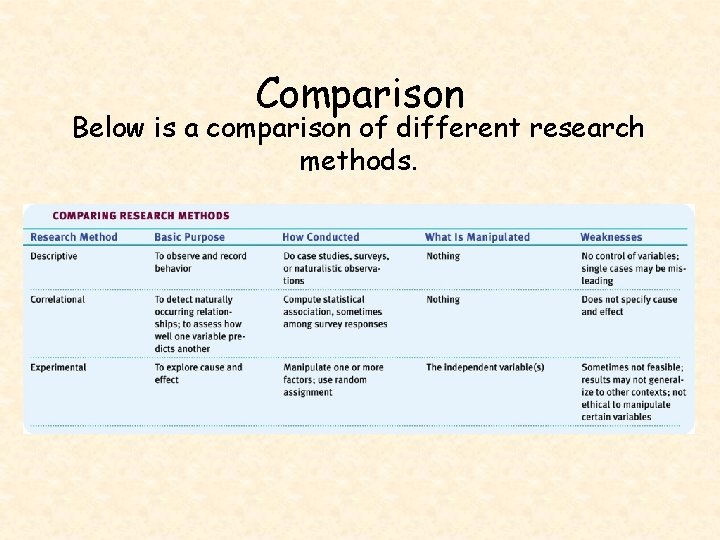
Comparison Below is a comparison of different research methods.
- Slides: 72