
Thesis writing workshop Wojtek Gierlotka MSE Outline l



- Slides: 80
Thesis writing workshop Wojtek Gierlotka, MS&E
Outline l The Format of a Thesis l Subjects/Materials l Data Collection Procedure l Data Analysis l Questions and Answers
Important! This is a WORKSHOP So let’s have some interaction.
The Format of a Thesis This is not easy to talk about a thesis here. Why? Because you are from different departments
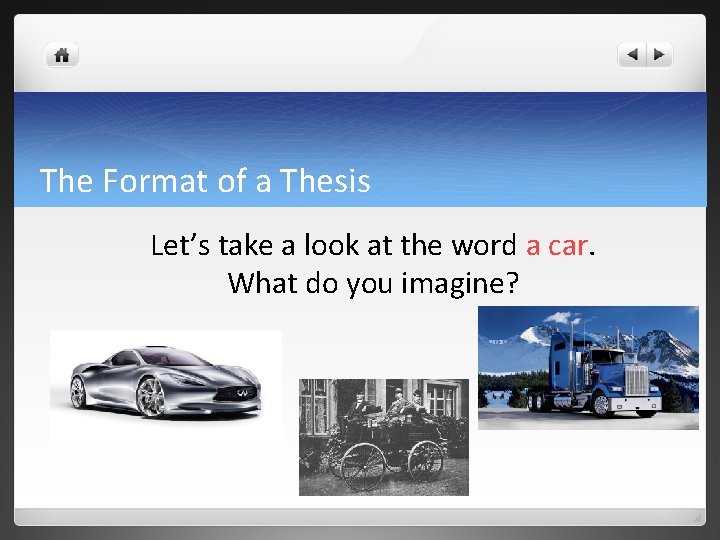
The Format of a Thesis Let’s take a look at the word a car. What do you imagine?
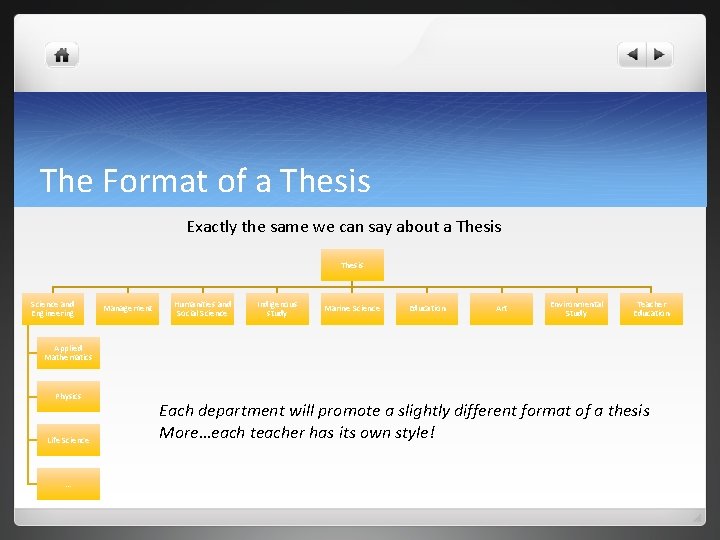
The Format of a Thesis Exactly the same we can say about a Thesis Science and Engineering Management Humanities and Social Science Indigenous study Marine Science Education Art Environmental Study Teacher Education Applied Mathematics Physics Life Science … Each department will promote a slightly different format of a thesis More…each teacher has its own style!
The Format of a Thesis General rule: Always respect reader – explain your work, even you think that something should be known.
The Format of a Thesis Even the details can very from Department A to Department B, There are still general rules for writing thesis in English. Let’s take a look at the rules:
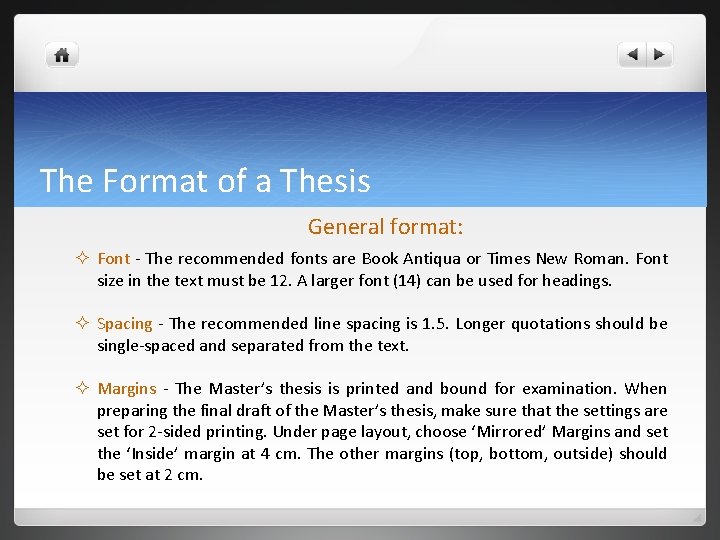
The Format of a Thesis General format: ² Font - The recommended fonts are Book Antiqua or Times New Roman. Font size in the text must be 12. A larger font (14) can be used for headings. ² Spacing - The recommended line spacing is 1. 5. Longer quotations should be single-spaced and separated from the text. ² Margins - The Master’s thesis is printed and bound for examination. When preparing the final draft of the Master’s thesis, make sure that the settings are set for 2 -sided printing. Under page layout, choose ‘Mirrored’ Margins and set the ‘Inside’ margin at 4 cm. The other margins (top, bottom, outside) should be set at 2 cm.
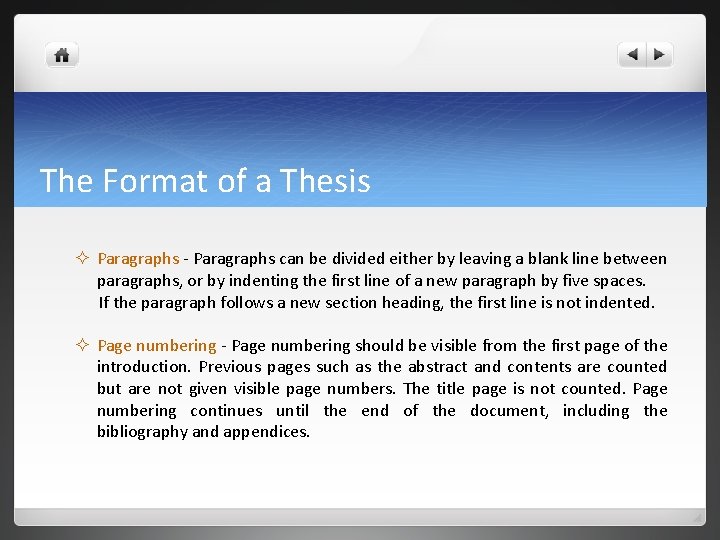
The Format of a Thesis ² Paragraphs - Paragraphs can be divided either by leaving a blank line between paragraphs, or by indenting the first line of a new paragraph by five spaces. If the paragraph follows a new section heading, the first line is not indented. ² Page numbering - Page numbering should be visible from the first page of the introduction. Previous pages such as the abstract and contents are counted but are not given visible page numbers. The title page is not counted. Page numbering continues until the end of the document, including the bibliography and appendices.
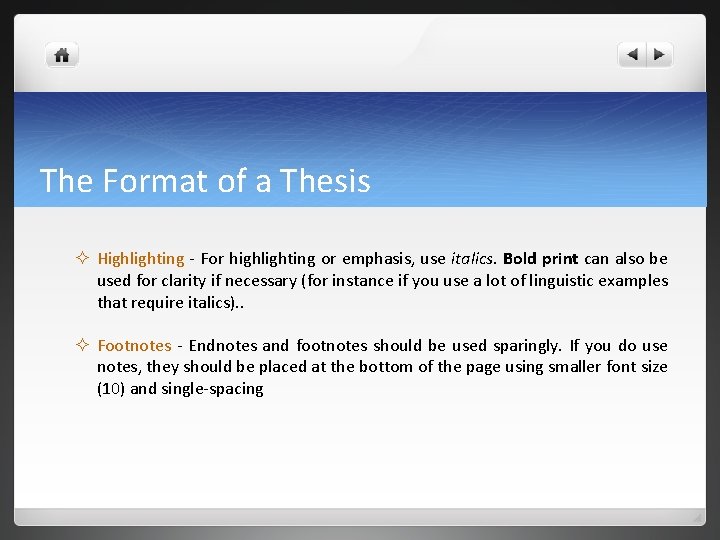
The Format of a Thesis ² Highlighting - For highlighting or emphasis, use italics. Bold print can also be used for clarity if necessary (for instance if you use a lot of linguistic examples that require italics). . ² Footnotes - Endnotes and footnotes should be used sparingly. If you do use notes, they should be placed at the bottom of the page using smaller font size (10) and single-spacing
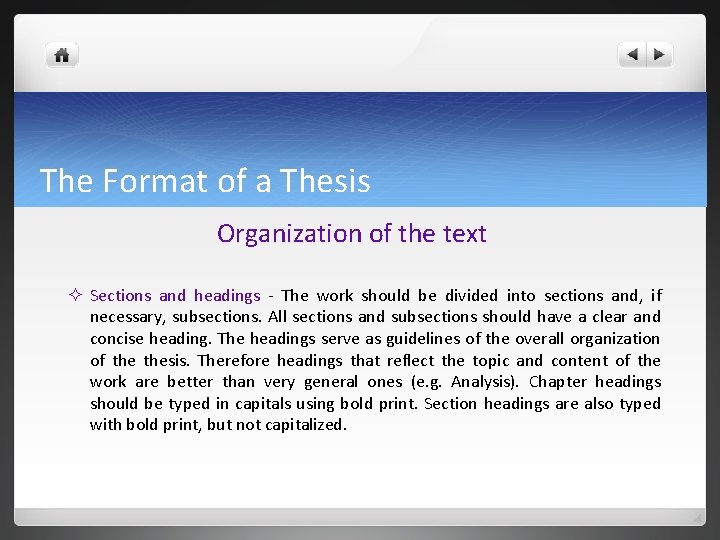
The Format of a Thesis Organization of the text ² Sections and headings - The work should be divided into sections and, if necessary, subsections. All sections and subsections should have a clear and concise heading. The headings serve as guidelines of the overall organization of thesis. Therefore headings that reflect the topic and content of the work are better than very general ones (e. g. Analysis). Chapter headings should be typed in capitals using bold print. Section headings are also typed with bold print, but not capitalized.
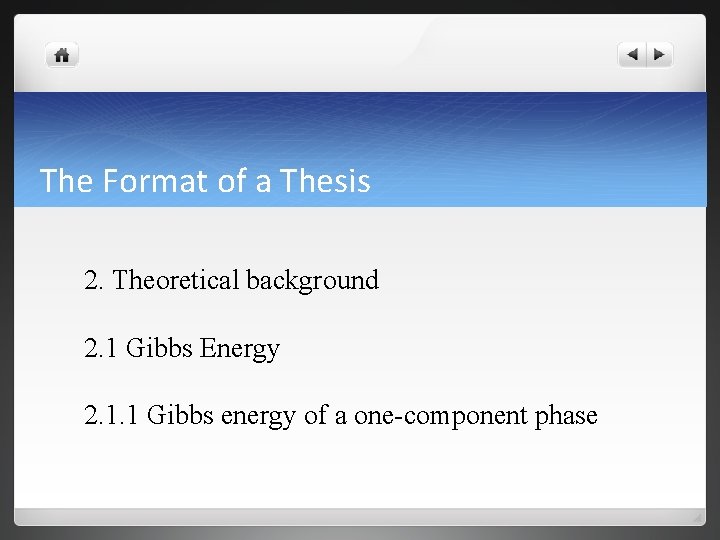
The Format of a Thesis The level of the section is indicated with numbers. The number of levels depends on the length of the work and the complexity of the subject matter. However, too much complexity should be avoided: the number of levels should not be more than three or four.
The Format of a Thesis 2. Theoretical background 2. 1 Gibbs Energy 2. 1. 1 Gibbs energy of a one-component phase
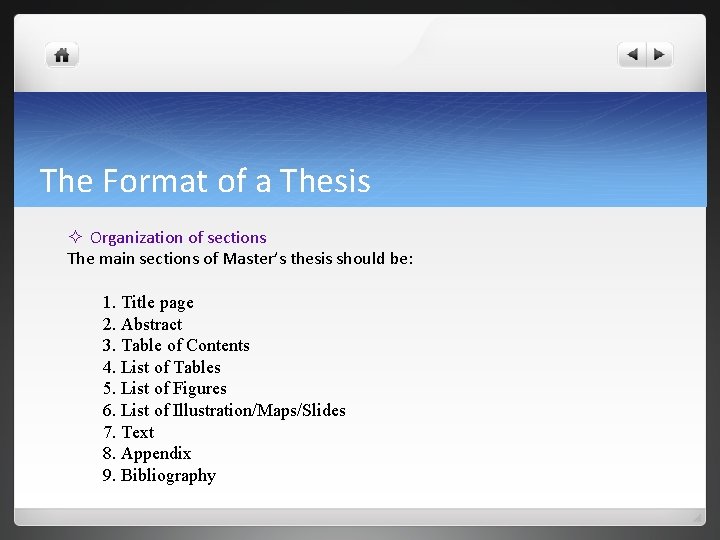
The Format of a Thesis ² Organization of sections The main sections of Master’s thesis should be: 1. Title page 2. Abstract 3. Table of Contents 4. List of Tables 5. List of Figures 6. List of Illustration/Maps/Slides 7. Text 8. Appendix 9. Bibliography
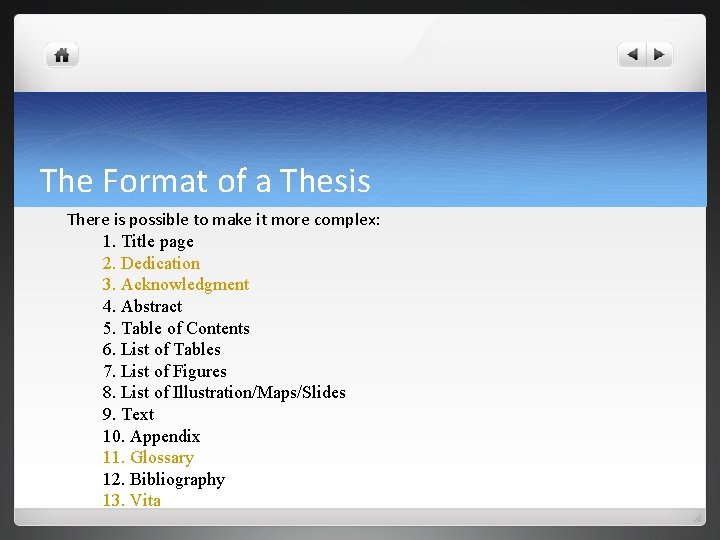
The Format of a Thesis There is possible to make it more complex: 1. Title page 2. Dedication 3. Acknowledgment 4. Abstract 5. Table of Contents 6. List of Tables 7. List of Figures 8. List of Illustration/Maps/Slides 9. Text 10. Appendix 11. Glossary 12. Bibliography 13. Vita
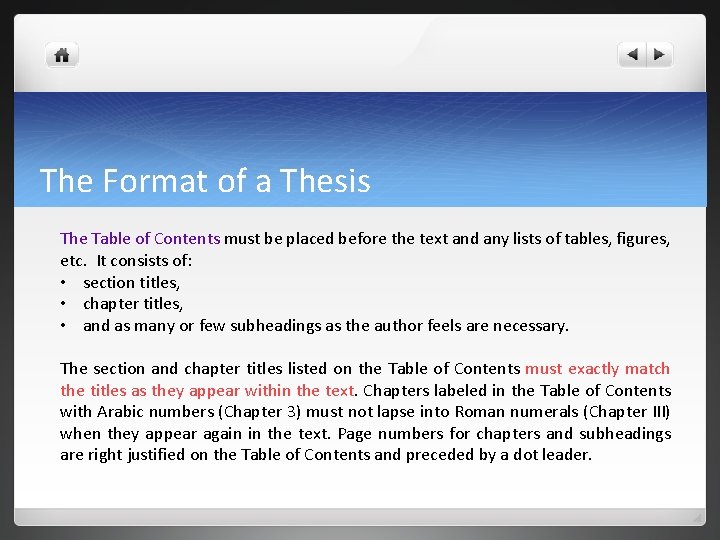
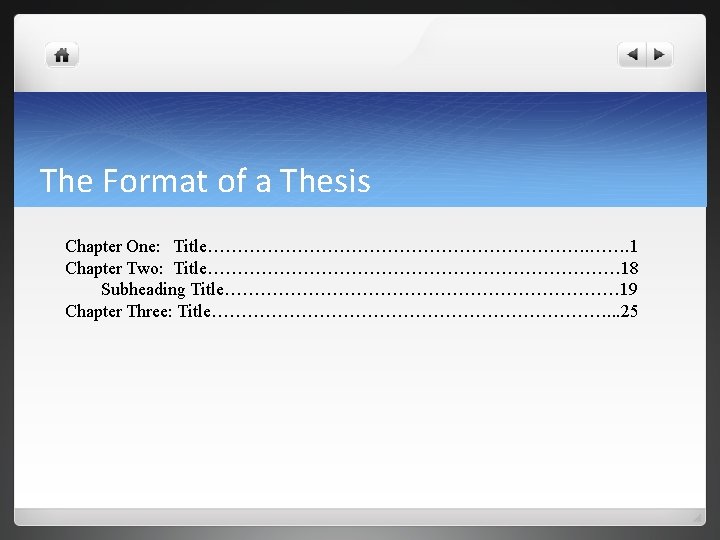
The Format of a Thesis The Table of Contents must be placed before the text and any lists of tables, figures, etc. It consists of: • section titles, • chapter titles, • and as many or few subheadings as the author feels are necessary. The section and chapter titles listed on the Table of Contents must exactly match the titles as they appear within the text. Chapters labeled in the Table of Contents with Arabic numbers (Chapter 3) must not lapse into Roman numerals (Chapter III) when they appear again in the text. Page numbers for chapters and subheadings are right justified on the Table of Contents and preceded by a dot leader.
The Format of a Thesis Chapter One: Title……………………………. ……. 1 Chapter Two: Title……………………………… 18 Subheading Title…………………………… 19 Chapter Three: Title……………………………. . . 25
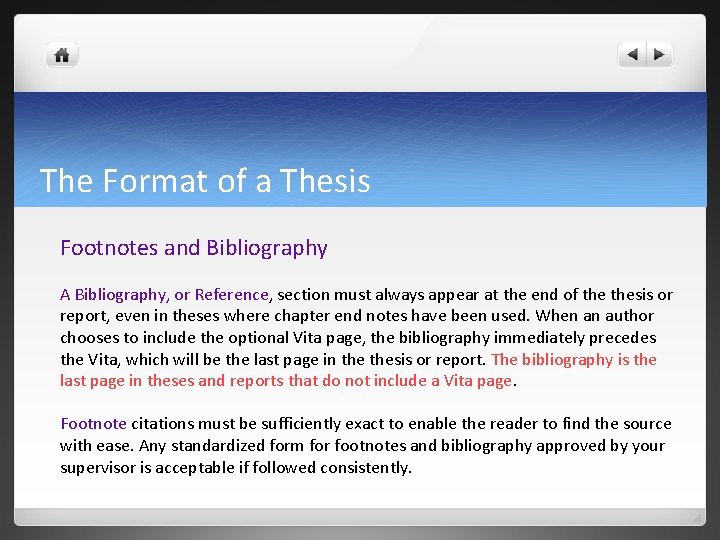
The Format of a Thesis Footnotes and Bibliography A Bibliography, or Reference, section must always appear at the end of thesis or report, even in theses where chapter end notes have been used. When an author chooses to include the optional Vita page, the bibliography immediately precedes the Vita, which will be the last page in thesis or report. The bibliography is the last page in theses and reports that do not include a Vita page. Footnote citations must be sufficiently exact to enable the reader to find the source with ease. Any standardized form for footnotes and bibliography approved by your supervisor is acceptable if followed consistently.
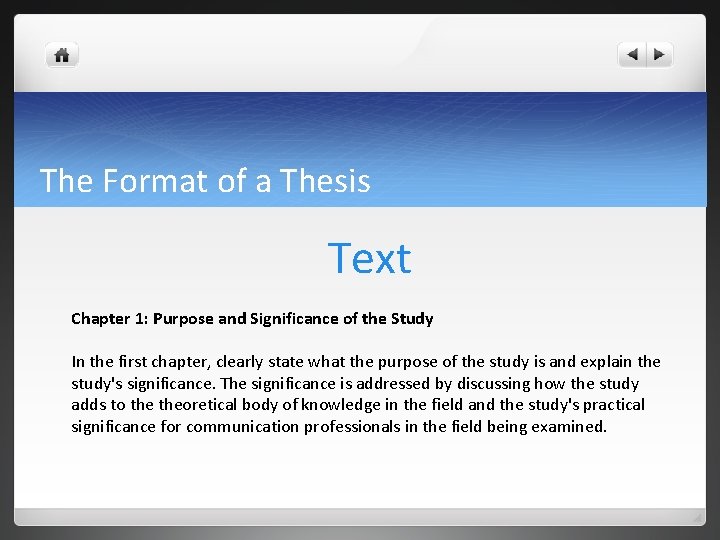
The Format of a Thesis Text Chapter 1: Purpose and Significance of the Study In the first chapter, clearly state what the purpose of the study is and explain the study's significance. The significance is addressed by discussing how the study adds to theoretical body of knowledge in the field and the study's practical significance for communication professionals in the field being examined.
The Format of a Thesis Chapter 2: Review of the Literature The purpose of the study should suggest some theoretical framework to be explained further in this chapter. The literature review thus describes and analyzes previous research on the topic. This chapter, however, should not merely string together what other researchers have found. Rather, you should discuss and analyze the body of knowledge with the ultimate goal of determining what is known and is not known about the topic. This determination leads to your research questions and/or hypotheses. In some cases, of course, you may determine that replicating previous research is needed.
The Format of a Thesis Chapter 3: Methodology This chapter describes and justifies the data gathering method used. This chapter also outlines how you analyzed your data. Begin by describing the method you chose and why this method was the most appropriate. In doing so, you should cite reference literature about the method. Next, detail every step of the data gathering and analysis process.
The Format of a Thesis Although this section varies depending on method analysis technique chosen, many of the following areas typically are addressed: Ø description of research design: internal validity, external validity Ø description of population and description of and justification for type of sample used or method for selecting units of observation Ø development of instrument or method for making observations (e. g. , question guide, categories for content analysis) pre-test, reliability and validity of instrument or method Ø administration of instrument or method for making observations (e. g. , interviews, observation, content analysis) Ø coding of data Ø description of data analysis: statistical analysis and tests performed, identification of themes/categories (qualitative or historical research)
The Format of a Thesis Chapter 4: Findings This chapter addresses the results from your data analysis only. This chapter does not include discussing other research literature or the implications of your findings. Usually you begin by outlining any descriptive or exploratory/confirmatory analyses (e. g. , reliability tests, factor analysis) that were conducted. You next address the results of the tests of hypotheses. You then discuss any ex post facto analysis. Tables and/or figures should be used to illustrate and summarize all numeric information.
The Format of a Thesis Chapter 5: Discussion The purpose of this chapter is not just to reiterate what you found but rather to discuss what your findings mean in relation to theoretical body of knowledge on the topic and your profession. Typically, students skimp on this chapter even though it may be the most important one because it answers the "So what? " question. Begin by discussing your findings in relation to theoretical framework introduced in the literature review. In some cases, you may need to introduce new literature (particularly with qualitative research). This chapter also should address what your findings mean for communication professionals in the field being examined. In other words, what are the study's practical implications?
The Format of a Thesis Finishing Do not expect to begin and finish your thesis in the same semester. You need to make significant progress (which usually means you are already collecting data) the semester before you want to graduate. The defense is scheduled when thesis has been completed successfully - not when it is convenient for the student to graduate. Even if nothing goes wrong (and things often do), a quality thesis takes about six to nine months to complete (from inception to graduate school clearance).
The Format of a Thesis Do not expect your chair or committee members to copy edit your thesis or dissertation. Before turning in any drafts, you should carefully edit and spell check your work. Editing occurs at two different levels at least. Micro editing involves correcting spelling and grammatical errors. It also involves checking for proper paragraph and sentence structure, consistent use of terms, and variety in word choice. Macro editing assesses the overall structure of thesis. This includes making sure each chapter flows logically from the previous chapter, headings and subheadings are used properly and consistently, and transitions are included between major topics. Macro editing also determines whether any parts of thesis need to be streamlined or expanded.
The Format of a Thesis Leave time for the chair to read your completed thesis or dissertation at least twice before giving it to your committee members. Don't expect to submit the completed thesis or dissertation for the first time to the chair and defend in the same or following week. Also, it is customary to give thesis or dissertation to committee members at least a week before the defense.
The Format of a Thesis It is the student’s responsibility to reserve a room for the defense and to bring the signature page and the examination form to the defense. Be prepared for revisions after the defense. You can expedite clearance by the graduate school by letting the staff examine a draft of thesis or dissertation before you defend. It is customary to provide your chair and committee members with a bound copy of the final version of thesis or dissertation.
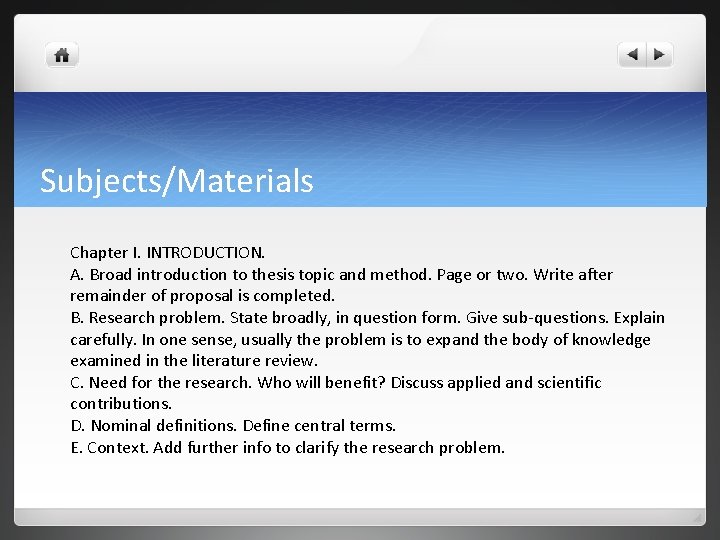
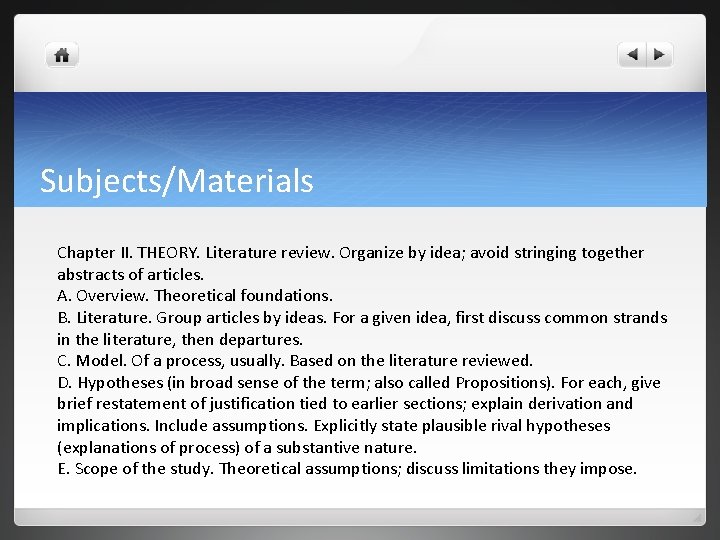
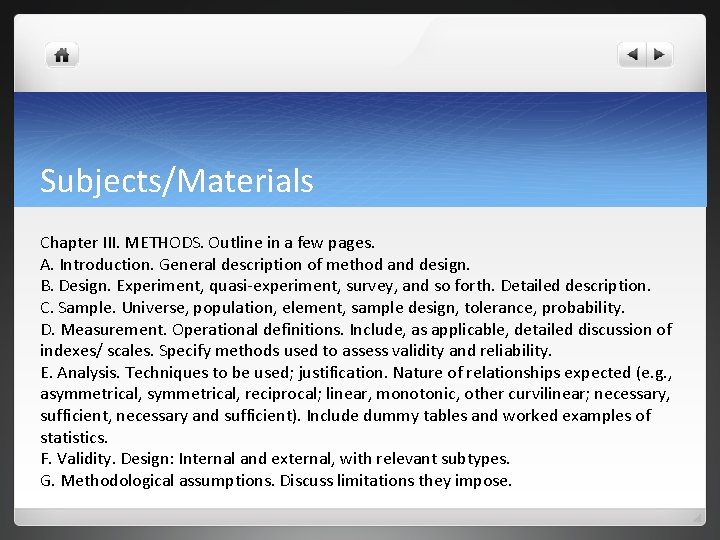
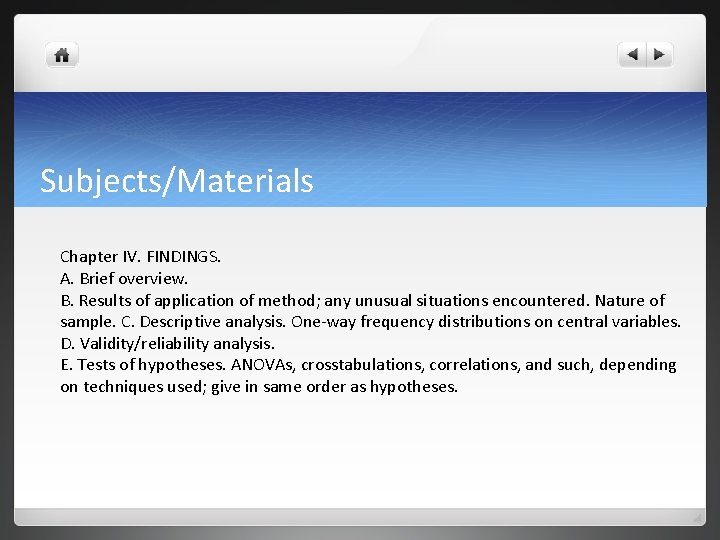
Subjects/Materials The following subjects are proposal – they usually will be included.
Subjects/Materials Chapter I. INTRODUCTION. A. Broad introduction to thesis topic and method. Page or two. Write after remainder of proposal is completed. B. Research problem. State broadly, in question form. Give sub-questions. Explain carefully. In one sense, usually the problem is to expand the body of knowledge examined in the literature review. C. Need for the research. Who will benefit? Discuss applied and scientific contributions. D. Nominal definitions. Define central terms. E. Context. Add further info to clarify the research problem.
Subjects/Materials Chapter II. THEORY. Literature review. Organize by idea; avoid stringing together abstracts of articles. A. Overview. Theoretical foundations. B. Literature. Group articles by ideas. For a given idea, first discuss common strands in the literature, then departures. C. Model. Of a process, usually. Based on the literature reviewed. D. Hypotheses (in broad sense of the term; also called Propositions). For each, give brief restatement of justification tied to earlier sections; explain derivation and implications. Include assumptions. Explicitly state plausible rival hypotheses (explanations of process) of a substantive nature. E. Scope of the study. Theoretical assumptions; discuss limitations they impose.
Subjects/Materials Chapter III. METHODS. Outline in a few pages. A. Introduction. General description of method and design. B. Design. Experiment, quasi-experiment, survey, and so forth. Detailed description. C. Sample. Universe, population, element, sample design, tolerance, probability. D. Measurement. Operational definitions. Include, as applicable, detailed discussion of indexes/ scales. Specify methods used to assess validity and reliability. E. Analysis. Techniques to be used; justification. Nature of relationships expected (e. g. , asymmetrical, reciprocal; linear, monotonic, other curvilinear; necessary, sufficient, necessary and sufficient). Include dummy tables and worked examples of statistics. F. Validity. Design: Internal and external, with relevant subtypes. G. Methodological assumptions. Discuss limitations they impose.
Subjects/Materials Chapter IV. FINDINGS. A. Brief overview. B. Results of application of method; any unusual situations encountered. Nature of sample. C. Descriptive analysis. One-way frequency distributions on central variables. D. Validity/reliability analysis. E. Tests of hypotheses. ANOVAs, crosstabulations, correlations, and such, depending on techniques used; give in same order as hypotheses.
Subjects/Materials Chapter V. DISCUSSION. When discussing implications, deal with both theoretical and the practical. Present only interpretations of the findings, not opinion. A. Brief overview. B. Discussion of results of application of method. Implications. C. Discussion of descriptive analysis. Implications. D. Discussion of tests of hypothesis. Implications. E. Post-hoc analysis. Implications.
Subjects/Materials Chapter VI. CONCLUSION. May include writer's opinion. A. Summary of entire thesis in a few pages. B. Conclusions. Refer to lit review. C. Implications. Speculate about broadest possible consequences, both theoretical and practical. Label speculation clearly. D. Limitations. Theory, method. E. Suggestions for future research.
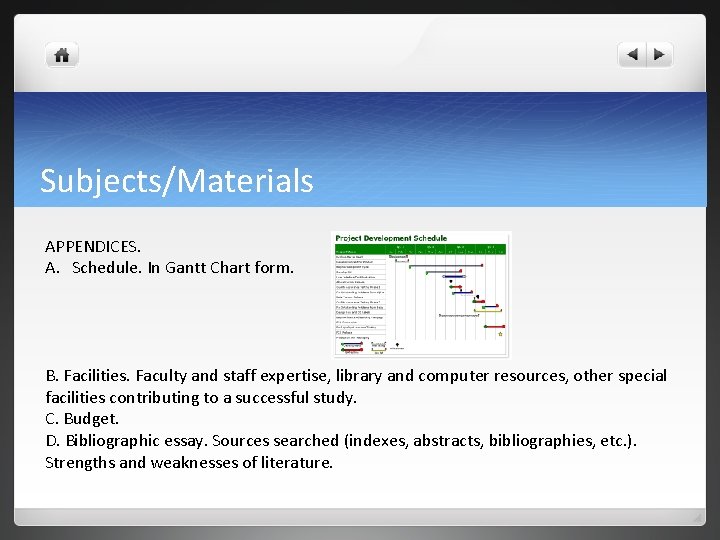
Subjects/Materials APPENDICES. A. Schedule. In Gantt Chart form. B. Facilities. Faculty and staff expertise, library and computer resources, other special facilities contributing to a successful study. C. Budget. D. Bibliographic essay. Sources searched (indexes, abstracts, bibliographies, etc. ). Strengths and weaknesses of literature.
Subjects/Materials BIBLIOGRAPHY. Include all relevant sources examined, whether cited or not.
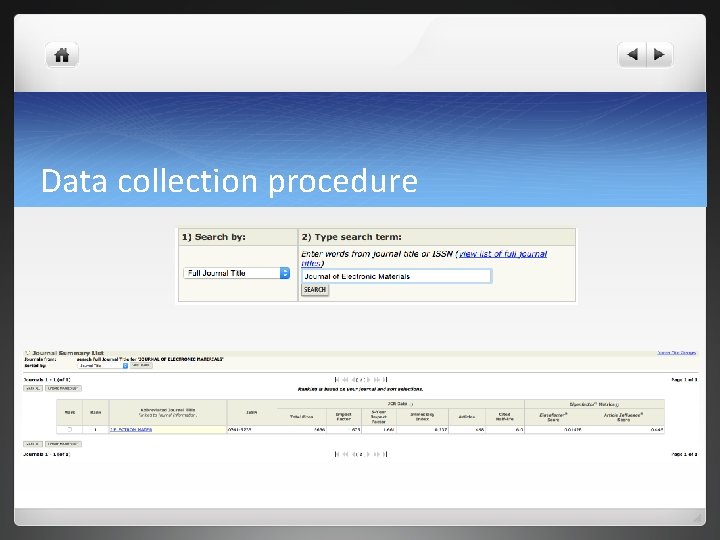
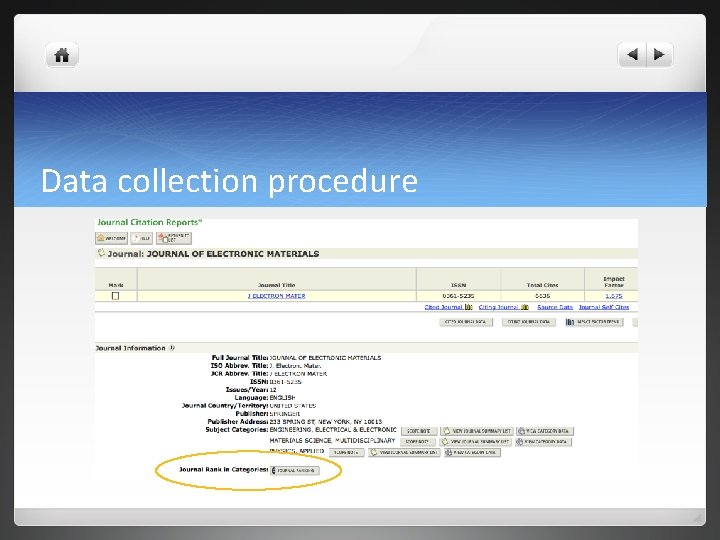
Data collection procedure Before we go to data collection from our own experiment, let’s talk about collection of literature data
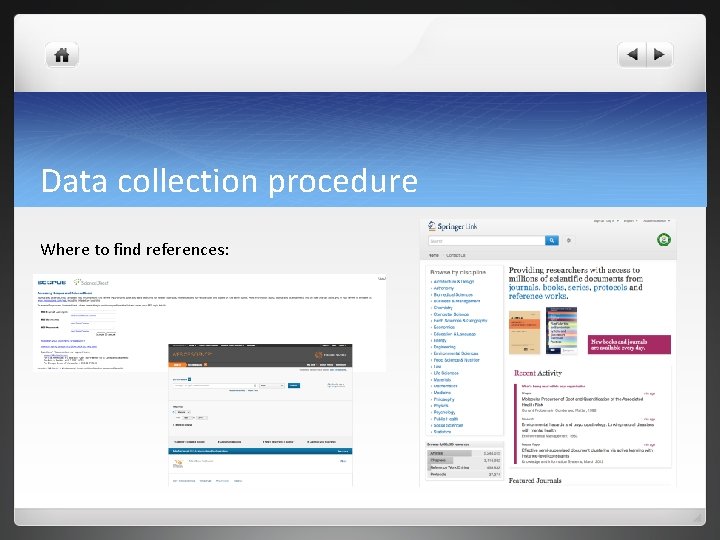
Data collection procedure Where to find references:
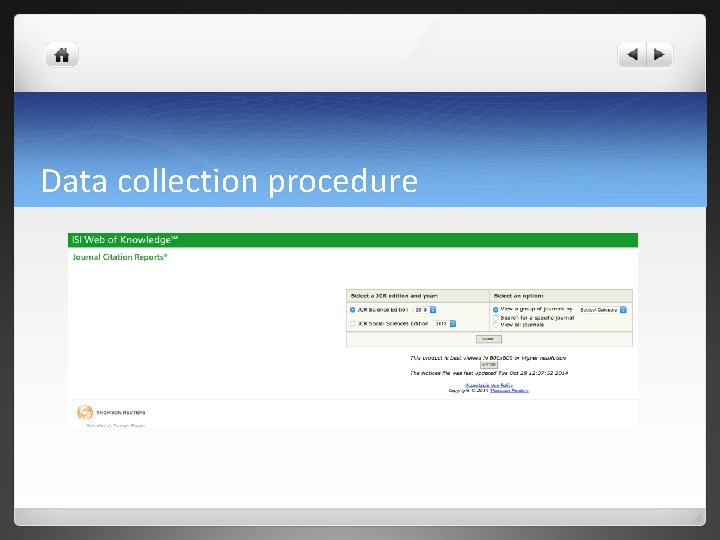
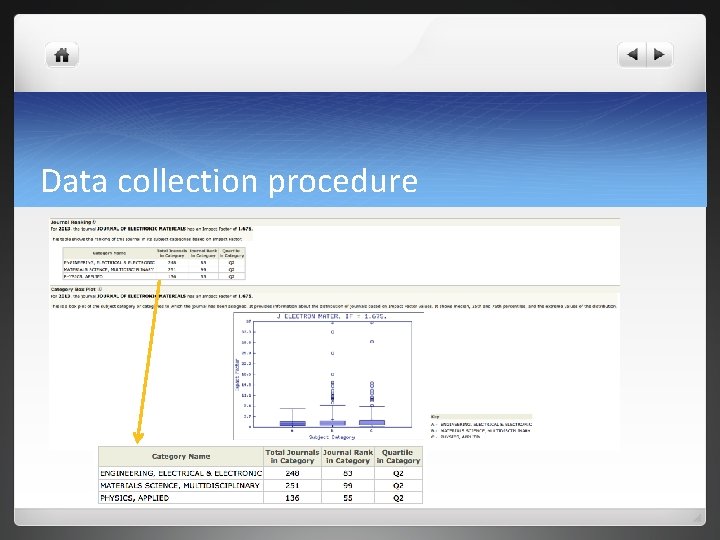
Data collection procedure How to decide which reference is good? u. Impact factor of the Journal u. Ranking of the Journal
Data collection procedure
Data collection procedure
Data collection procedure
Data collection procedure
Data collection procedure There are so-called “open access” journals. Be careful! In general these journals work as follow: You pay, you publish You never can be sure if the paper has a good quality. Check authors in Scopus or Web of Science
Data collection procedure Never include to your references papers you didn’t read!!!!! To do it, it’s like playing Chinese whispers (or deaf telephone). Let’s play and we will see the result. One person whispers a message to another, which is passed through a line of people until the last player announces the message to the entire group. You can not repeat the message, you whisper ONLY once.
Data collection procedure Methods of data collection: Census. A census is a study that obtains data from every member of a population. In most studies, a census is not practical, because of the cost and/or time required. Sample survey. A sample survey is a study that obtains data from a subset of a population, in order to estimate population attributes. Experiment. An experiment is a controlled study in which the researcher attempts to understand cause-and-effect relationships. Observational study. Like experiments, observational studies attempt to understand cause-and-effect relationships. However, unlike experiments, the researcher is not able to control it.
Data collection procedure Each method of data collection has advantages and disadvantages. Resources. When the population is large, a sample survey has a big resource advantage over a census. A well-designed sample survey can provide very precise estimates of population parameters - quicker, cheaper, and with less manpower than a census. Causal inference. Cause-and-effect relationships can be teased out when subjects are randomly assigned to groups. Therefore, experiments, which allow the researcher to control assignment of subjects to treatment groups, are the best method for investigating causal relationships.
Data collection procedure Generalizability refers to the appropriateness of applying findings from a study to a larger population. Generalizability requires random selection. If participants in a study are randomly selected from a larger population, it is appropriate to generalize study results to the larger population; if not, it is not appropriate to generalize. Observational studies do not feature random selection; so generalizing from the results of an observational study to a larger population can be a problem.
Data collection procedure Problem Which of the following statements are true? I. A sample survey is an example of an experimental study. II. An observational study requires fewer resources than an experiment. III. The best method for investigating causal relationships is an observational study. (A) I only (B) II only (C) III only (D) All of the above. (E) None of the above.
Data collection procedure The correct answer is (E). In a sample survey, the researcher does not assign treatments to survey respondents. Therefore, a sample survey is not an experimental study; rather, it is an observational study. An observational study may or may not require fewer resources (time, money, manpower) than an experiment. The best method for investigating causal relationships is an experiment - not an observational study - because an experiment features randomized assignment of subjects to treatment groups.
Data collection procedure Collecting data from experiment: § Always provide raw data! § Provide conditions of the experiment, so everyone can repeat § Calculate or estimate experimental error § Graphs are easier to understand than tables
Data collection procedure Each field of science will have its own specific data collection procedure. However there is one very smart sentence: If you have two different datasets from the same experiment, only one is correct. It’s impossible that both are correct.
Data analysis The data analysis is a huge part of a science. You can learn it if you join the Statistics class (1 or 2 or even more semesters!!!). Every “more advanced” software like Matlab, Mathematica, Stat. Graph, Math. Cad or even Excel provide a set of tools for data analysis.
Data analysis Since everyone has access to Excel, let’s take a look at very simple data analysis that can be done using this software.
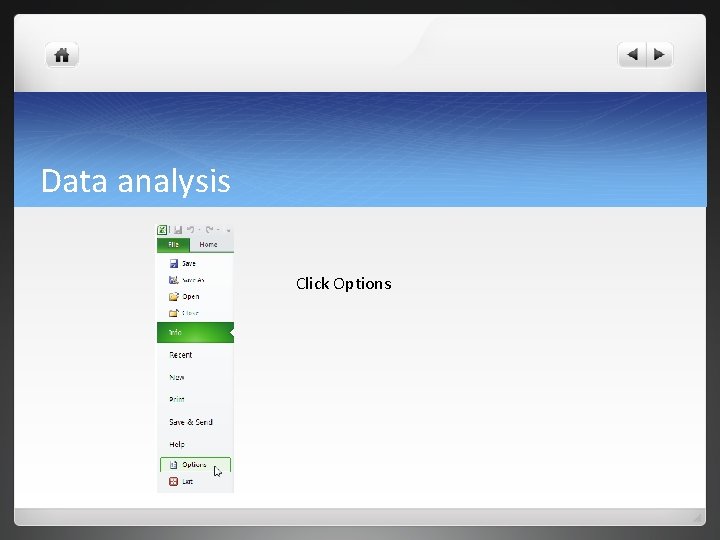
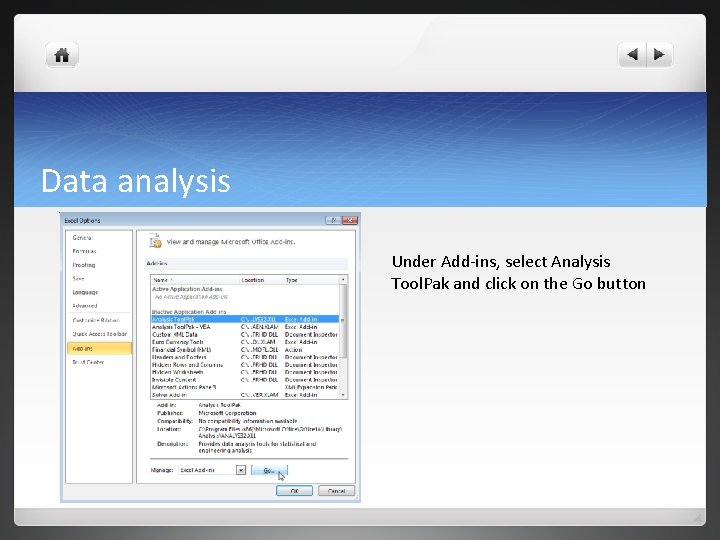
Data analysis The Analysis Tool. Pak is an Excel add-in program that provides data analysis tools for financial, statistical and engineering data analysis. To load the Analysis Tool. Pak add-in, execute the following steps. 1. Click on the green File tab. The File tab in Excel 2010 replaces the Office Button (or File Menu) in previous versions of Excel.
Data analysis Click Options
Data analysis Under Add-ins, select Analysis Tool. Pak and click on the Go button
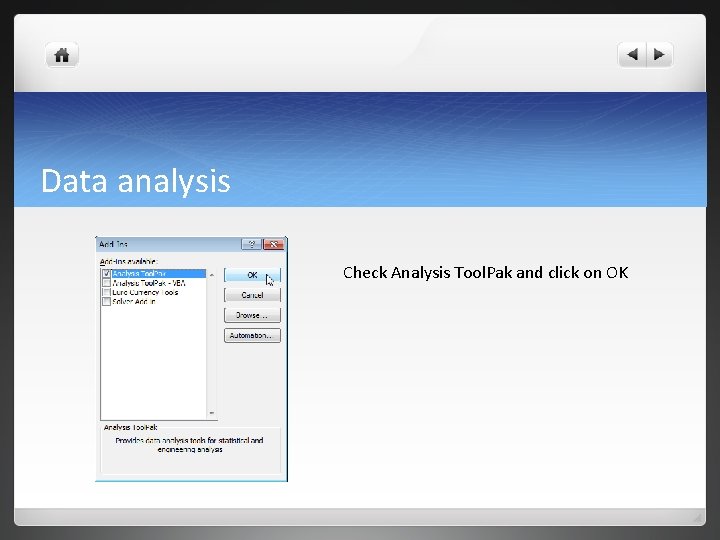
Data analysis Check Analysis Tool. Pak and click on OK
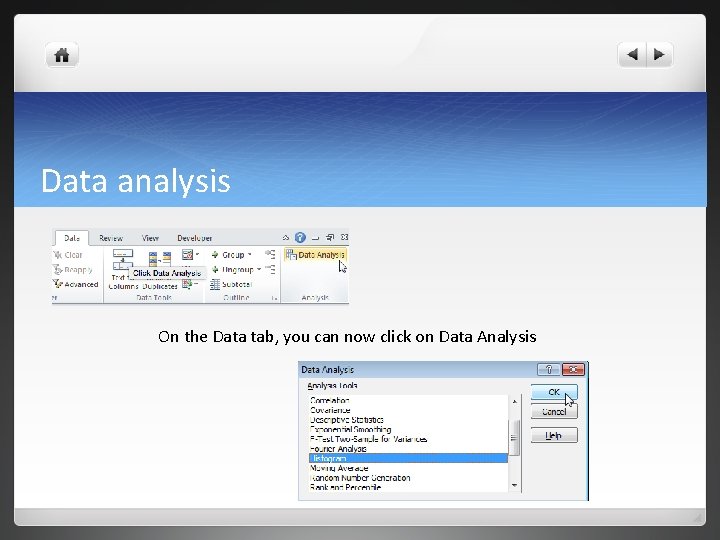
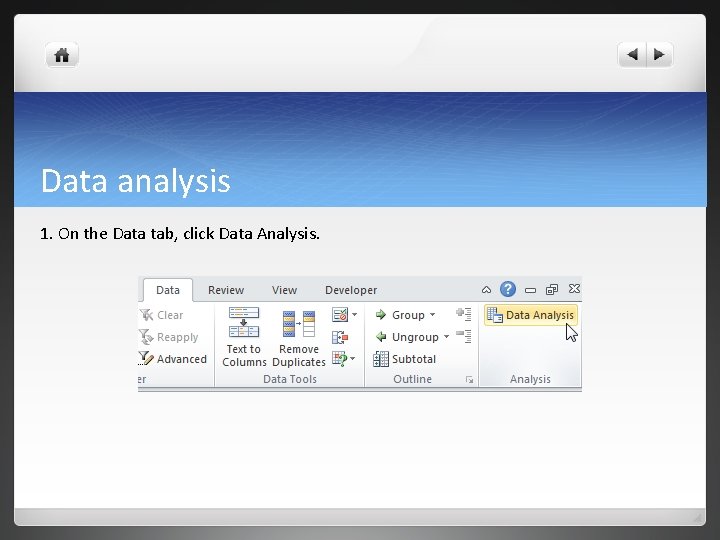
Data analysis On the Data tab, you can now click on Data Analysis
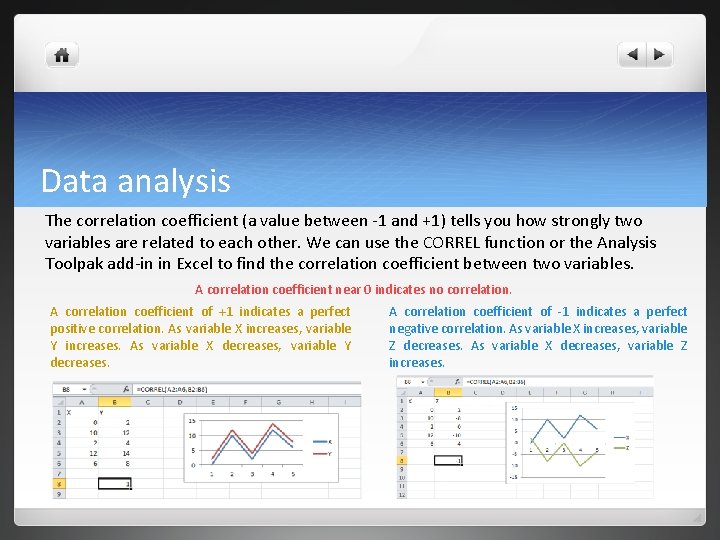
Data analysis The correlation coefficient (a value between -1 and +1) tells you how strongly two variables are related to each other. We can use the CORREL function or the Analysis Toolpak add-in in Excel to find the correlation coefficient between two variables. A correlation coefficient near 0 indicates no correlation. A correlation coefficient of +1 indicates a perfect positive correlation. As variable X increases, variable Y increases. As variable X decreases, variable Y decreases. A correlation coefficient of -1 indicates a perfect negative correlation. As variable X increases, variable Z decreases. As variable X decreases, variable Z increases.
Data analysis 1. On the Data tab, click Data Analysis.
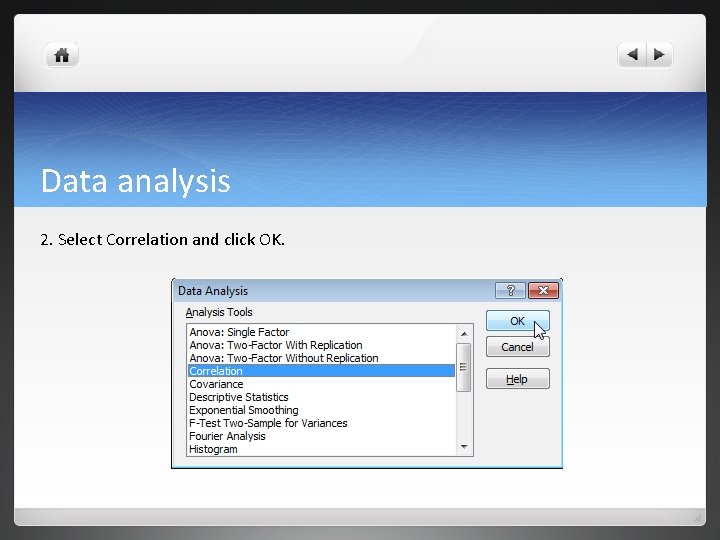
Data analysis 2. Select Correlation and click OK.
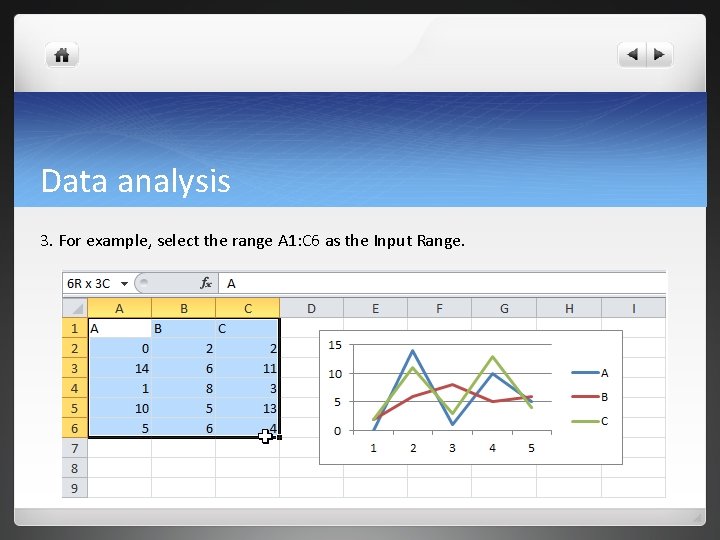
Data analysis 3. For example, select the range A 1: C 6 as the Input Range.
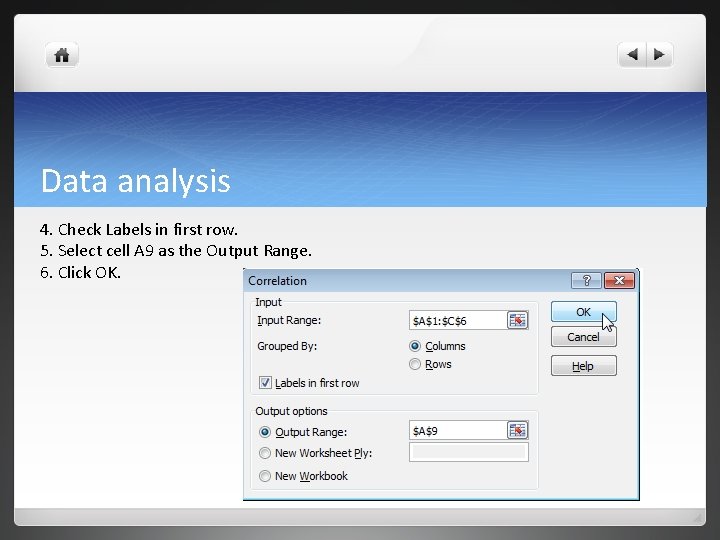
Data analysis 4. Check Labels in first row. 5. Select cell A 9 as the Output Range. 6. Click OK.
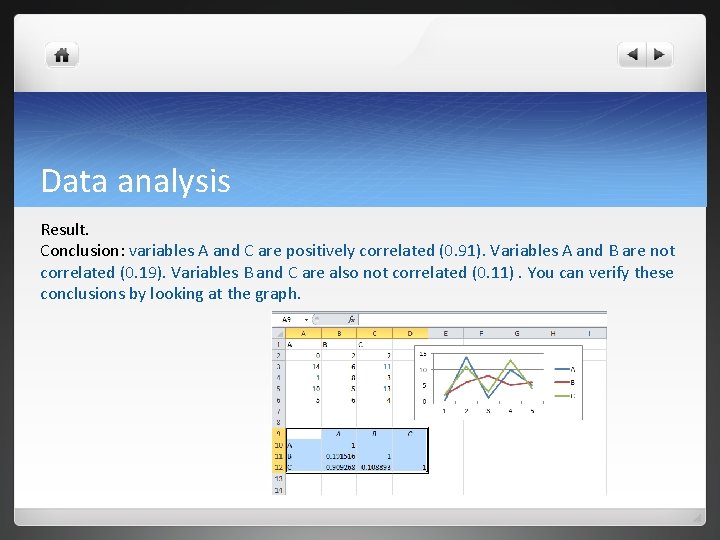
Data analysis Result. Conclusion: variables A and C are positively correlated (0. 91). Variables A and B are not correlated (0. 19). Variables B and C are also not correlated (0. 11). You can verify these conclusions by looking at the graph.
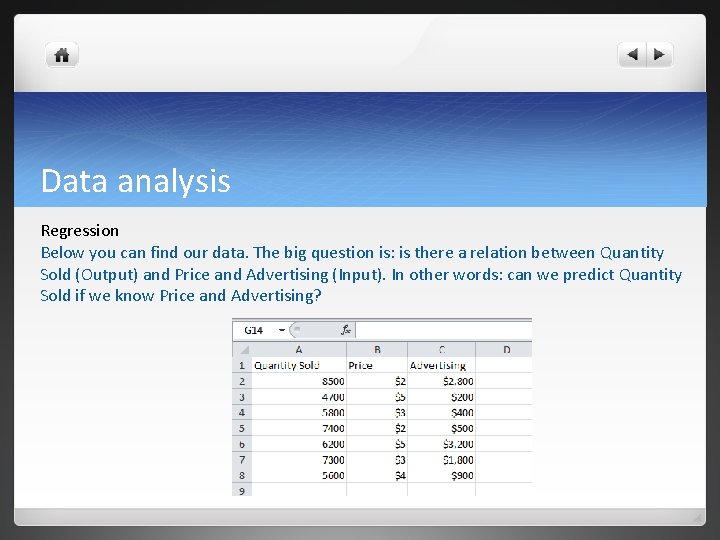
Data analysis Regression Below you can find our data. The big question is: is there a relation between Quantity Sold (Output) and Price and Advertising (Input). In other words: can we predict Quantity Sold if we know Price and Advertising?
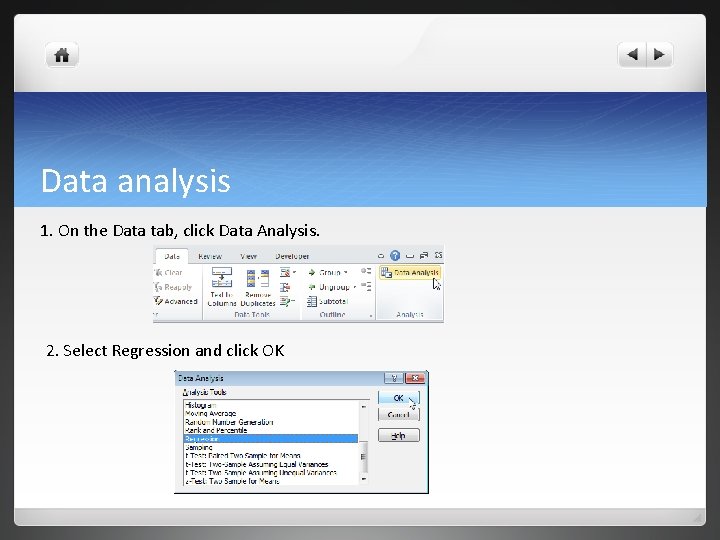
Data analysis 1. On the Data tab, click Data Analysis. 2. Select Regression and click OK
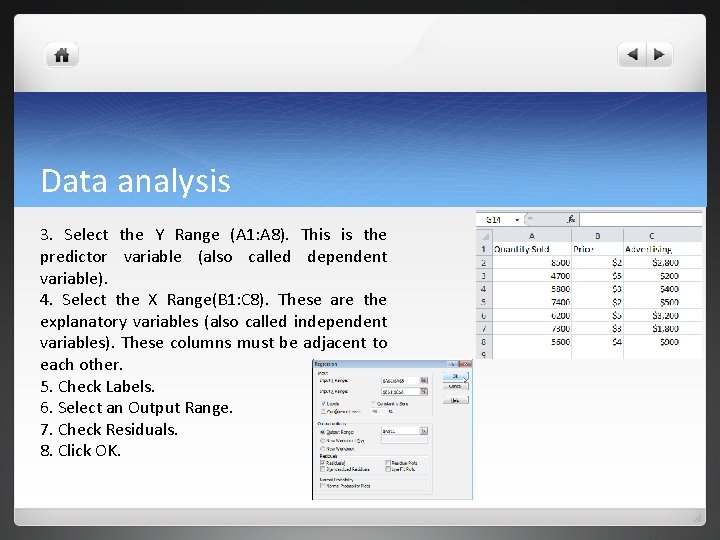
Data analysis 3. Select the Y Range (A 1: A 8). This is the predictor variable (also called dependent variable). 4. Select the X Range(B 1: C 8). These are the explanatory variables (also called independent variables). These columns must be adjacent to each other. 5. Check Labels. 6. Select an Output Range. 7. Check Residuals. 8. Click OK.
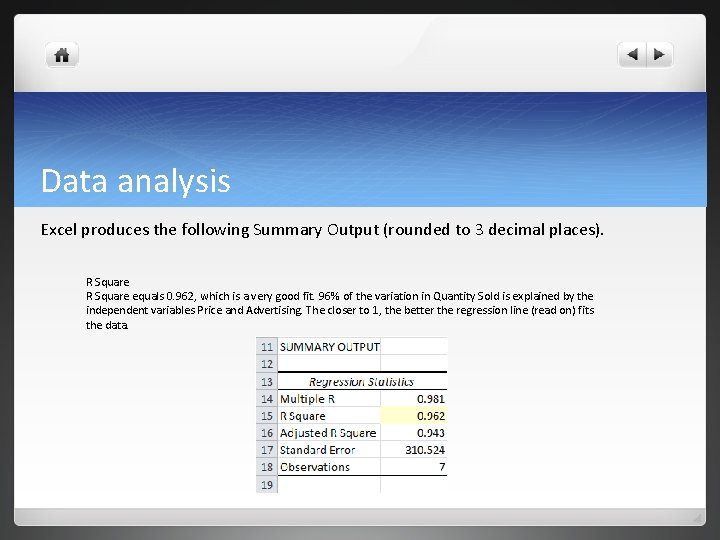
Data analysis Excel produces the following Summary Output (rounded to 3 decimal places). R Square equals 0. 962, which is a very good fit. 96% of the variation in Quantity Sold is explained by the independent variables Price and Advertising. The closer to 1, the better the regression line (read on) fits the data.
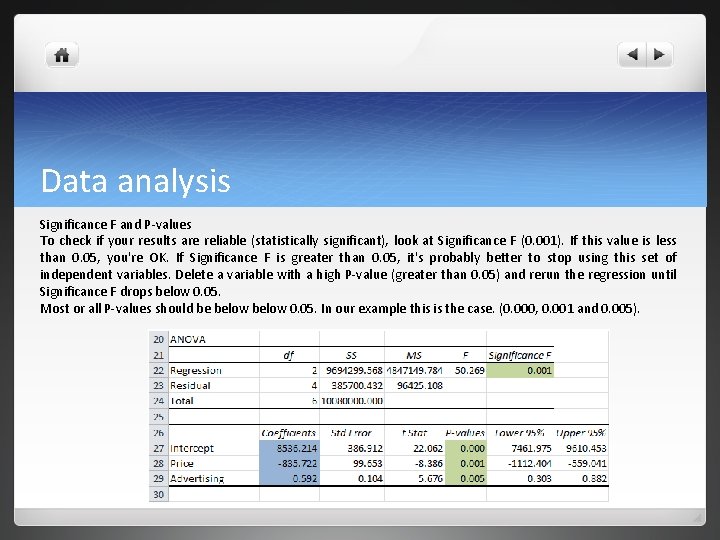
Data analysis Significance F and P-values To check if your results are reliable (statistically significant), look at Significance F (0. 001). If this value is less than 0. 05, you're OK. If Significance F is greater than 0. 05, it's probably better to stop using this set of independent variables. Delete a variable with a high P-value (greater than 0. 05) and rerun the regression until Significance F drops below 0. 05. Most or all P-values should be below 0. 05. In our example this is the case. (0. 000, 0. 001 and 0. 005).
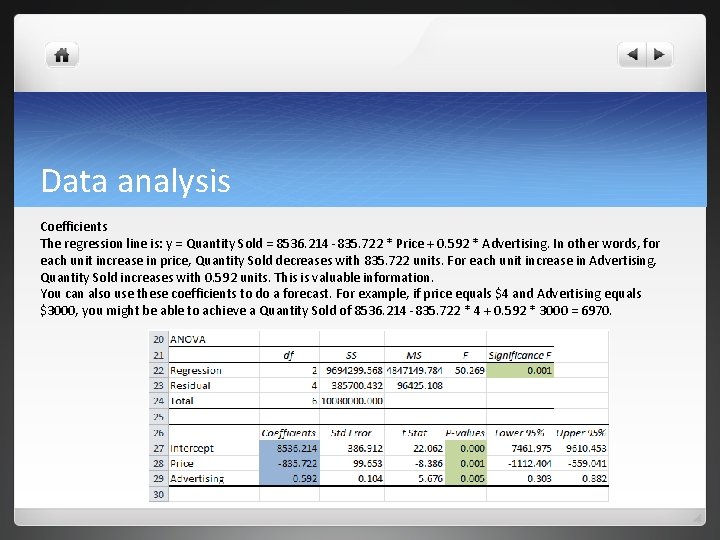
Data analysis Coefficients The regression line is: y = Quantity Sold = 8536. 214 -835. 722 * Price + 0. 592 * Advertising. In other words, for each unit increase in price, Quantity Sold decreases with 835. 722 units. For each unit increase in Advertising, Quantity Sold increases with 0. 592 units. This is valuable information. You can also use these coefficients to do a forecast. For example, if price equals $4 and Advertising equals $3000, you might be able to achieve a Quantity Sold of 8536. 214 -835. 722 * 4 + 0. 592 * 3000 = 6970.
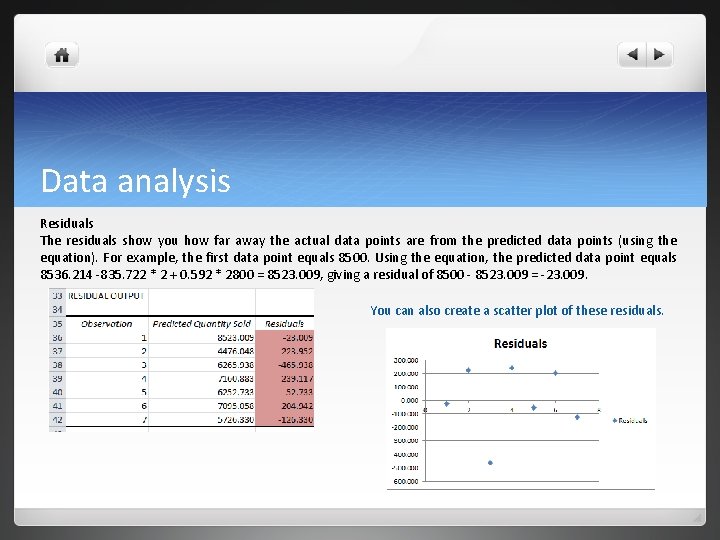
Data analysis Residuals The residuals show you how far away the actual data points are from the predicted data points (using the equation). For example, the first data point equals 8500. Using the equation, the predicted data point equals 8536. 214 -835. 722 * 2 + 0. 592 * 2800 = 8523. 009, giving a residual of 8500 - 8523. 009 = -23. 009. You can also create a scatter plot of these residuals.
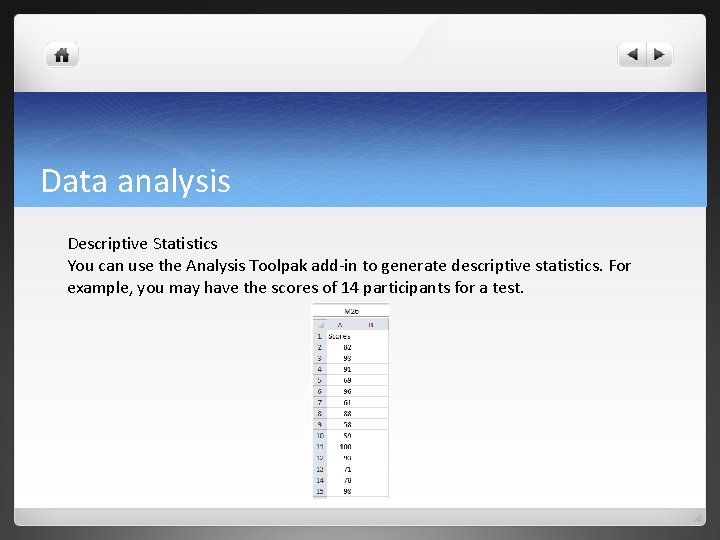
Data analysis Descriptive Statistics You can use the Analysis Toolpak add-in to generate descriptive statistics. For example, you may have the scores of 14 participants for a test.
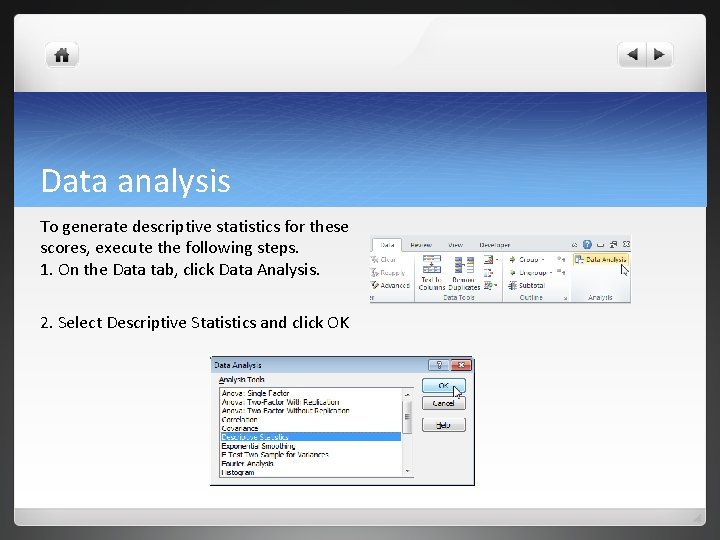
Data analysis To generate descriptive statistics for these scores, execute the following steps. 1. On the Data tab, click Data Analysis. 2. Select Descriptive Statistics and click OK
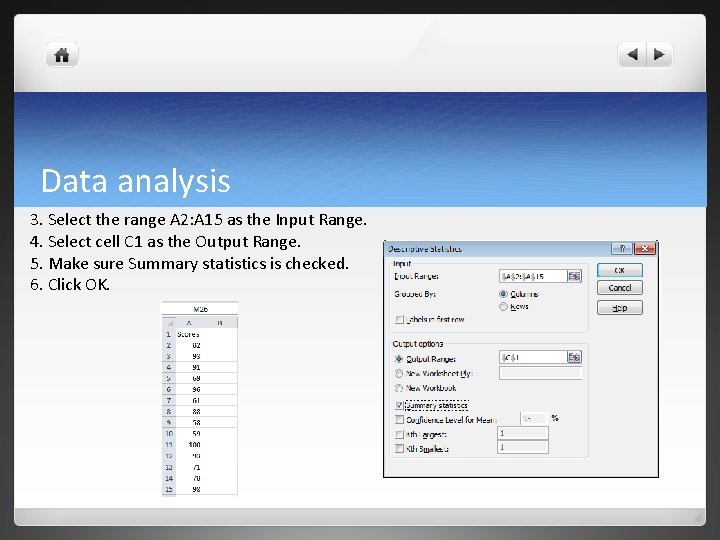
Data analysis 3. Select the range A 2: A 15 as the Input Range. 4. Select cell C 1 as the Output Range. 5. Make sure Summary statistics is checked. 6. Click OK.
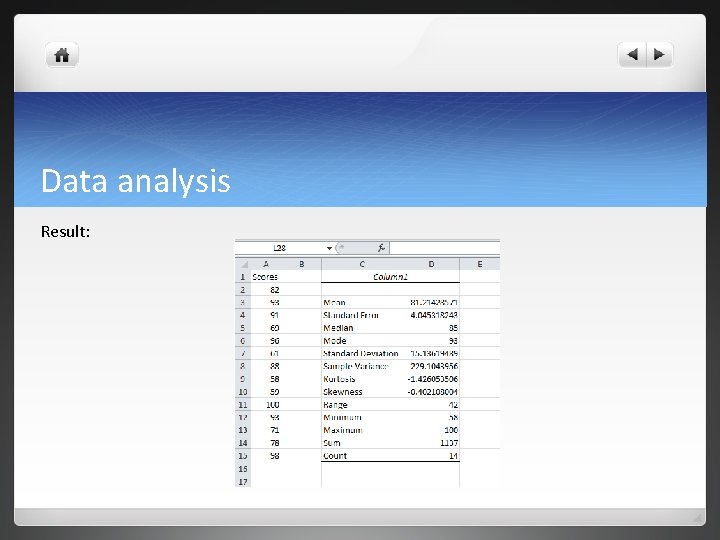
Data analysis Result:
Questions and Answers Questions and answers
Thank you